Bitcoin Playbook: 115k Reclaim or 110.8k Breakdown__________________________________________________________________________________
Market Overview
__________________________________________________________________________________
Bitcoin is consolidating after a leverage flush, basing near 110.8–111.3k while rallies stall below 114.8–115k.
Momentum: 📉 Mild bearish intraday tone within a broader range; sellers capping under 115k as 111k still absorbs.
Key levels:
• Resistances (1D/12H): 113.8–115k, 118k, 123–126k
• Supports (1D/12H): 110.8–111.3k, 108–109k, 100k
Volumes: MODERATE across TFs; look for spikes to validate any break.
Multi-timeframe signals: 1D/12H = neutral→down; only 6H shows a tactical buy; intradays (4H/2H/1H) lean lower within the range.
Risk On / Risk Off Indicator: neutral buy — a light tailwind that aligns with range context but stops short of a strong buy.
__________________________________________________________________________________
Trading Playbook
__________________________________________________________________________________
Strategic stance: post-reset range; stay tactical and level-driven, with a cautious bias until 115k is reclaimed.
Global bias: Neutral-to-cautious below 115k; invalidate on clean acceptance/daily close above 114.8–115k.
Opportunities:
• Confirmed long: Reclaim/hold 114.8–115k → target 118k, then 123–126k on volume confirmation.
• Defensive long: Hold 110.8–111.3k with bullish close → target 113.5–115k.
• Tactical short: Fade 114.8–115k or short breakdown <110.8k → target 109k/108k.
Risk zones / invalidations:
• Acceptance below 110.8k → invalidates defensive longs, opens 109k then 108k/100k.
• Acceptance above 115k → invalidates range fades, opens 118k.
Macro catalysts (Twitter, Perplexity, news):
• Fed “higher for longer” and data dependence → caps upside momentum.
• U.S.–China tension chatter; firmer Treasuries and bid gold → caution.
• Spot ETF 7d inflows positive → tailwind if 111k holds.
Action plan:
• Long (reclaim 115k): Entry ~115.0k / Stop ~113.5k / TP1 118k, TP2 123k, TP3 126k / R:R ~1:2–1:3.
• Long (111k hold): Entry ~111.1k / Stop ~110.4k / TP1 113.5k, TP2 115k, TP3 118k / R:R ~1:2.
• Short (break <110.8k): Entry ~110.6k / Stop ~111.6k / TP1 109k, TP2 108k, TP3 105k / R:R ~1:1.5–1:2.
__________________________________________________________________________________
Multi-Timeframe Insights
__________________________________________________________________________________
Higher timeframes stay range-bound and cautious while intradays lean bearish until 115k is reclaimed.
1D/12H: Base at 110.8–111.3k capped by 113.8–115k; a daily close above 115k would unlock 118k. Volumes are moderate → need confirmation.
6H: Active demand at 110.8–111.3k with a tactical buy read; room to rotate toward 113.5–115k if support holds.
4H/2H/1H/30m/15m: Lower‑timeframe sellers fade rallies; best risk points are fades under 113.5–115k or contrarian buys on sweeps/holds at 111k.
Key divergences: Risk-on tailwind vs cautious higher‑TF filters; this tempers conviction and emphasizes strict invalidations.
__________________________________________________________________________________
Macro & On-Chain Drivers
__________________________________________________________________________________
Macro is mixed (hawkish Fed, geopolitics) while spot ETF flows add a modest tailwind; on-chain suggests a post‑flush reset regime.
Macro events: Fed “higher for longer” with data dependence; renewed U.S.–China tension; firmer Treasuries and bid gold — a cautious mix for risk.
Bitcoin analysis: BTC underperforms broader risk despite visible absorption at support; key zones align at 110.8–111.3k and 114.8–115k/118k.
On-chain data: Large deleverage behind, funding normalized; sustained recovery needs spot demand and persistent ETF inflows.
Expected impact: Neutral bias with a slight tailwind; technical confirmation above 115k is needed to unlock 118k+.
__________________________________________________________________________________
Key Takeaways
__________________________________________________________________________________
BTC is consolidating on higher‑timeframe support while 115k caps rallies.
- Trend: neutral to mildly bearish until 115k is reclaimed.
- Top setup: confirmed reclaim of 114.8–115k → 118k, then 123–126k if volume expands.
- Macro driver: positive 7d spot ETF inflows cushioning downside amid a hawkish Fed.
Stay patient and disciplined: let price confirm above 115k or below 110.8k before pressing risk.
Fed

GAMMA SQUEEZE: Why Gold Prices will hit 5 000 + USDBottom line
If 1% of Treasuries ($278B) rotates into gold, $5,000/oz is not only plausible—it sits inside the low end of what flow math + today’s market microstructure can deliver. The path (and whether we print $8k+ spikes) hinges on how much of that flow shows up as short-dated calls—because that is what turns steady demand into a self-feeding gamma loop.
________________________________________
Executive summary
• A 1% rotation out of U.S. Treasuries is roughly $278B of new gold demand (using SIFMA’s latest estimate that Treasuries outstanding ≈ $27.8T).
• At today’s context (gold ~$3.53k/oz on Sep 2–5, 2025), $278B buys ~79.4M oz ≈ 2,471 tonnes; at $5k/oz it buys ~55.6M oz ≈ 1,729 tonnes. For scale, annual mine supply ≈ 3,661 t and total above-ground stocks ≈ 216,265 t (bars/coins+ETFs ≈ 48,634 t).
• That flow is huge relative to both quarterly demand value (Q2’25 ≈ $132B) and typical daily trading turnover (~$290B/day across OTC, futures & ETFs). Even spread out, it materially tilts the tape; if concentrated and routed via options, it can produce dealer hedging feedback—i.e., a gamma squeeze.
• Price targets (framework, not prophecy):
o Conservative flow-only: +40–60% → $4,900–$5,600/oz
o Base case (flow + some options reflexivity): +70–110% → $6,000–$7,500/oz
o Squeeze/overshoot window (short-dated calls heavy): episodic spikes >$8,000/oz possible, but hard to sustain without continued flow.
These bands come from scaling prior ETF-driven episodes (notably ~877 t ETF inflow in 2020 alongside a ~+36% price run) and sizing against current market depth, while layering a realistic options-hedging multiplier (details below).
________________________________________
1) What a “gamma squeeze” in gold means (and why it can happen)
Definition (in one line): When call buying concentrates near-dated, near-the-money strikes, dealers short gamma must buy futures as price rises (and sell if it falls) to keep neutral—this feedback accelerates upside (“gamma squeeze”).
Why it’s plausible in gold right now:
• The listed derivatives stack is large. As of Fri, Sep 5, 2025, CME’s daily bulletin shows COMEX gold options open interest ~0.80M contracts (calls ~0.49–0.69M; puts ~0.30–0.38M depending on line item), each on 100 oz—i.e., option OI notionally ties to ~2,400–2,800 t of gold. That is the powder keg a call-wave can act on.
• Implied vol is moderate (GVZ ~18 for 30-day GLD options), so vega is “affordable,” gamma is punchy in the front end.
• CME’s CVOL framework and open-interest tools confirm where strikes/expiries cluster; when OI stacks close to spot and near expiry, market-wide gamma becomes most sensitive.
Back-of-envelope hedging math (illustrative):
For a 30-day, at-the-money option with σ≈18%, the Black-Scholes gamma is about
Γ≈ϕ(0)SσT≈0.399S⋅0.18⋅30/365\Gamma \approx \frac{\phi(0)}{S\sigma\sqrt{T}} \approx \frac{0.399}{S\cdot 0.18 \cdot \sqrt{30/365}}.
At S=$3,500/oz, that’s ~0.0022 per $. A +1% move (+$35) bumps delta by ~0.077 per option. If just 150k near-ATM front-tenor calls are held by customers (dealers short gamma), hedge buying ≈ 150,000 × 100 oz × 0.077 ≈ 1.16M oz ≈ 36 t—per 1% price pop. That’s only a slice of total OI; a broader crowding raises this number. Compare with ~2,500 t/day of global turnover and you can see how concentrated dealer hedging can move price intraday.
________________________________________
2) Sizing a 1% Treasury → gold rotation
Treasury base: latest SIFMA comment put U.S. Treasuries outstanding ≈ $27.8T (Q1’25). 1% → $278B.
Gold the rotation would buy:
• At $3,500/oz: $278B → ~79.4M oz → ~2,471 t
• At $5,000/oz: $278B → ~55.6M oz → ~1,729 t
For scale:
• Annual mine supply (2024): ~3,661 t; total supply (incl. recycling): ~4,974 t. A $278B buy ticket equals 47–67% of a year’s mine output (depending on price), or ~35–50% of total annual supply.
• ETF precedent: In 2020, ~877 t net ETF inflow (~$48B) coincided with a ~+36% move from Jan→Aug 2020. Today’s $278B is ~5–6× that dollar size (and ~2–3× the tonnes, depending on price), hinting at large flow-driven upside even before any options reflexivity.
• Turnover lens: WGC puts average daily trading across OTC/futures/ETFs at roughly $290B/day recently. A $278B program is ~one day’s global turnover. Pushed quickly (or skewed to options), that’s impactful; stretched over months, the price impact softens but still accumulates.
Futures-only lens (capacity check):
At $3,500/oz, one COMEX GC contract notionally = $350k (100 oz). $278B equals ~794k GC contracts. Current futures OI is ~0.49M contracts, so this exceeds all COMEX OI—you cannot push that much via futures quickly without major repricing. Even at $5,000/oz (~$500k/contract), it’s ~556k contracts, still comparable to the entire OI.
________________________________________
3) Price-target framework (with the math that gets you there)
Think of the price in layers: (A) base flow impact + (B) options-gamma reflexivity + (C) second-round effects (short-covering, momentum, FX, central banks).
A) Flow-only impact (calibrated to 2020)
• 2020 anchor: 877 t ETF inflow ↔ ~+36% price. Using a simple proportionality, 1,729–2,471 t (your $278B) maps to ~+71% to +101%.
• Apply to spot ≈ $3,532/oz (early Sep 2025):
o +71% → ~$6,050/oz
o +101% → ~$7,100/oz
Caveat: 2020 had unique macro tailwinds, so I treat this as upper-middle of base range.
B) Options reflexivity / gamma squeeze overlay
If 20–30% of the $278B rotation expresses via short-dated calls (common for levered macro expressions), dealer hedging can amplify flow impact:
• From the OI math earlier, a mere 1% up-move can demand ~20–40 t of dealer hedge buying if near-ATM OI is thick. A 3–5% multi-day grind can easily cascade into 100–200 t of incremental buying from hedgers alone. That’s non-trivial vs. mine supply pace, and it pulls forward upside.
• Result: add another +10–20% to the flow-only levels during a squeeze while it lasts.
C) Second-round effects
• Central banks: still persistent net buyers (>1,000 t/yr pace in recent years), tending to fade dips rather than rallies—a structural bid.
• FX & rates: the GVZ ~18 regime means bursts of vol aren’t “expensive”; a weakening USD or policy shocks can tilt the target higher.
Putting it together—scenario bands
Scenario Assumptions Implied move Target
Conservative $278B spread over 6–9 months, mostly physical/ETFs; limited options +40–60% $4,900–$5,600
Base case 50–70% to physical/ETFs, 30–50% to futures/options; moderate dealer short-gamma +70–110% $6,000–$7,500
Squeeze / overshoot Short-dated call concentration, dealers persistently short gamma; flow bunches in weeks +120–>150% (episodic) >$8,000 (brief spikes)
$5,000 target is well within the conservative band if any meaningful fraction of the $278B pushes through quickly, even without a full-blown gamma loop.
________________________________________
4) Why the market could mechanically gap higher
• Market size vs. flow: Q2’25 total demand value = $132B. Dropping $278B into this ecosystem is a 2× quarterly shock.
• Trading capacity: $278B ≈ one full day of global turnover; price impact is convex when the risk-absorption (dealers, miners, recyclers) cannot scale linearly day-by-day.
• Derivatives gearing: With ~0.8M options contracts OI outstanding and futures OI ~0.49M, even a partial shift into calls forces hedge-buys on the way up, the hallmark of a squeeze.
________________________________________
5) Key risks / reality checks
• Time profile of the rotation matters. A slow, programmatic shift spreads impact; a front-loaded move can overshoot then mean-revert as gamma decays.
• Elasticity is asymmetric. Jewelry/fabrication falls at high prices (demand destruction), recycling rises, both cushioning extremes. That moderates how long >$7k can persist without continued flow.
• Volatility regimes change. If GVZ spikes to high-20s/30s, option premia jump, slowing new call demand; conversely, put demand can flip net gamma long for dealers, dampening squeezes.
________________________________________
References (most load-bearing)
• Treasury base: SIFMA—Treasuries outstanding $27.8T (Feb 2025).
• Gold supply & stocks: WGC—Above-ground stock 216,265 t (end-2024); bars/coins+ETFs 48,634 t; mine supply 2024 ≈ 3,661 t.
• Trading turnover: WGC—gold trading ≈ $290B/day.
• ETF precedent: WGC—2020 ETF inflows 877 t (~$47.9B) alongside major price rise.
• Current price context: Reuters—record highs $3,532/oz set in early Sep 2025. (
• Options/hedging plumbing: CME daily bulletin (Sep 5, 2025) showing gold options OI ~0.8M contracts; CME CVOL/tools; Cboe GVZ ~18 as 30-day IV.
________________________________________

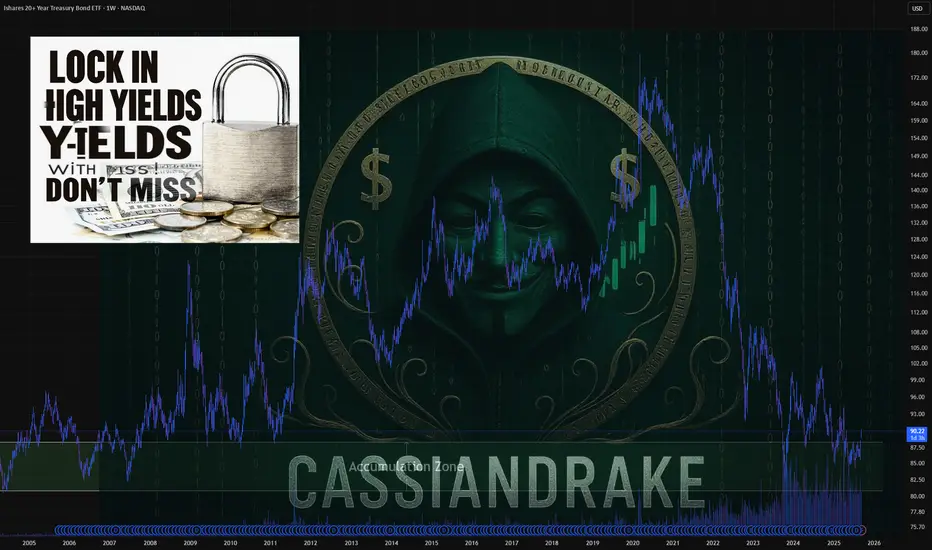
Why Now is the Best Time to Load Up on T-BillsIn 2025, investors have a unique opportunity to capitalize on high yields from Treasury Bills (T-Bills) as interest rates hover at their highest levels in years. With indications that the Federal Reserve may soon start cutting rates, now could be the ideal time to invest in T-Bills through the TLT ETF. This article explores why investing in T-Bills now could reap significant returns over the next decade.
Key Points:
Highest Interest Rates in Years:
Current interest rates on T-Bills are elevated, offering attractive yields for investors.
Historical data shows that such high yield opportunities are rare and may not be seen again for years.
Federal Reserve Rate Cut Expectations:
The Federal Reserve has signaled potential rate cuts due to concerns about job market stability and inflation trends.
Market expectations suggest that rate cuts may begin later in 2025, which could reduce yields on T-Bills in the future.
Strategic Advantage of T-Bills:
Investing now allows investors to lock in current high yields before potential rate cuts reduce returns.
T-Bills offer a safe investment with guaranteed returns, backed by the U.S. government, making them a low-risk option.
Why TLT ETF?
The TLT ETF provides exposure to long-term Treasury securities, making it an excellent vehicle for capitalizing on current high yields.
The advantages of using an ETF include ease of trading and diversification.
Conclusion:
With interest rates at a peak and expectations of future rate cuts, now is a strategic time to invest in T-Bills via the TLT ETF. By taking advantage of the current high yields, investors can secure returns that may not be available again for years to come.
TVC:DXY NASDAQ:MSTR TVC:GOLD TVC:SILVER BITSTAMP:BTCUSD $VNIDIA NASDAQ:TSLA VANTAGE:SP500
Gold Holds 4,010 Ahead of Powell as Shutdown Clouds CPI OutlookHey Traders,
In today’s session, we’re keeping a close eye on XAUUSD for a potential buy setup around the 4,010 zone. Gold remains in a broader uptrend, and the current pullback brings price action near a key support and trend confluence that could attract fresh buyers.
All eyes are on Fed Chair Powell’s remarks later today. With the U.S. government shutdown disrupting key economic releases, including a possible delay of next week’s CPI data, Powell’s tone could heavily influence short-term Dollar sentiment—and by extension, Gold momentum.
If Powell hints at policy caution amid data uncertainty, the safe-haven narrative could re-emerge quickly. We’ll be watching closely for a potential technical trigger to align with the macro backdrop.
Trade safe,
Joe.

EUR/NZD Correction Loading… or Just a Trap? Watch 2.0000 Closely🔹 COT (Commitment of Traders)
Euro Futures: Non-commercial longs slightly decreased (-789) while shorts increased (+2,625) → mild bearish tone on EUR.
NZD Futures: Non-commercial longs rose sharply (+3,044) along with shorts (+6,160) → institutional traders adding exposure on both sides, but still heavily net short on NZD (≈3:1 short/long).
📌 Combined Interpretation: Despite the small decline in EUR sentiment, the strong short positioning on NZD keeps the broader bias bullish for EUR/NZD in the medium term, though near-term correction is likely after recent highs.
🔹 FX Sentiment (Retail Positioning)
82% short vs 18% long.
📌 Retail traders are extremely net short → strong contrarian bullish signal. This suggests the downside could be limited before another potential upside leg.
🔹 Seasonality
October is typically positive for NZD.
EUR tends to be flat to slightly negative in October.
📌 Seasonal bias: mildly bearish for EUR/NZD — NZD’s seasonal strength could fuel a temporary pullback, aligning with the current technical setup.
🔹 Price Action
Rejection from major supply zone 2.0250–2.0350, forming a potential double-top.
Price now consolidating near 2.0050–2.0000, sitting just above key structure and ascending trendline support.
RSI neutral → room for further retracement.
Break below 2.0000 could accelerate the correction toward 1.9850–1.9750 demand zone.
Bullish structure would resume only above 2.0250.
🎯 Outlook: Expect a corrective leg toward 1.9850–1.9750 before potential bullish continuation. Structure remains constructive as long as price stays above 1.9700.

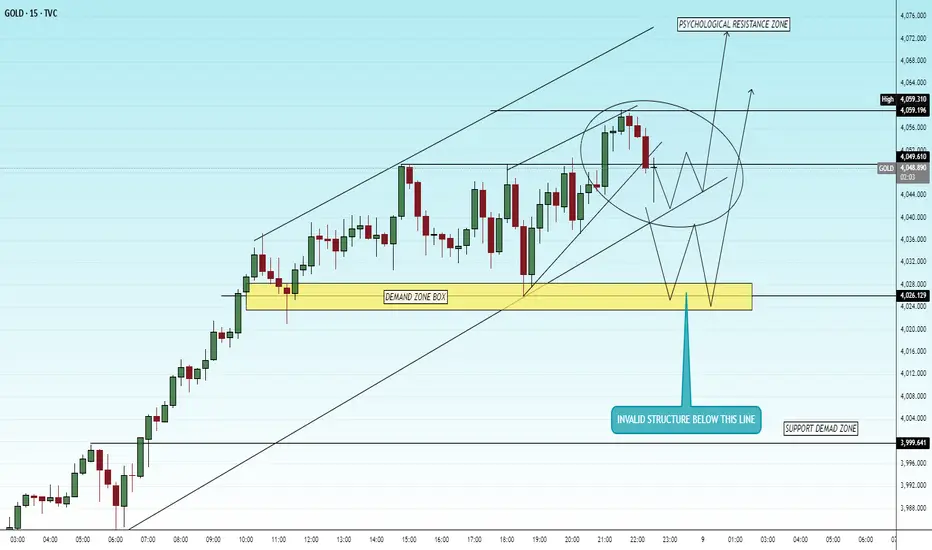
XAUUSD 15m – FOMC Setup AheadTVC:GOLD
Structure | Trend | Key Reaction Zones
Price still maintaining a descending channel structure.
Sitting near psychological and demand support zone (4030–4025).
FOMC volatility expected — final structure below 4025 could trigger continuation down, else a short-term bullish correction may occur.
Market Overview
Gold has been under intense selling pressure before the FOMC event, forming multiple lower highs within a bearish channel. The zone around 4030–4025 remains a key area where liquidity may sweep before a potential retracement toward upper levels if the market rejects strongly from this zone.
Key Scenarios
✅ Bullish Case 🚀 → Bounce from 4030–4025 → 🎯 Target 4068 → 🎯 Target 4085 → 🎯 Target 4100
❌ Bearish Case 📉 → Break below 4020 → 🎯 Target 4005 → 🎯 Target 3980
Current Levels to Watch
Resistance 🔴: 4068 / 4085
Support 🟢: 4030 / 4020
⚠️ Disclaimer: This analysis is for educational purposes only. Not financial advice.
$SPY / $SPX Scenarios — Wednesday, Oct 8, 2025🔮 AMEX:SPY / SP:SPX Scenarios — Wednesday, Oct 8, 2025 🔮
🌍 Market-Moving Headlines
🚩 FOMC Minutes drop: Traders zero in on the Fed’s tone around balance sheet runoff and rate-cut timing clues.
📉 Macro sentiment reset: Bond yields + USD volatility remain key — equities tracking real-rate shifts post-minutes.
💬 Fed chorus continues: Barr, Kashkari, and Goolsbee headline a dense speaker lineup shaping policy narrative.
💻 Tech leadership check: Mega-caps face another liquidity test as macro dominates tape action.
📊 Key Data & Events (ET)
⏰ 9:20 AM — Alberto Musalem (St. Louis Fed) remarks
⏰ 9:30 AM — Michael Barr (Fed Governor) speech
⏰ 🚩 2:00 PM — FOMC Minutes (September Meeting)
⏰ 3:15 PM — Neel Kashkari (Minneapolis Fed) speech
⏰ 5:45 PM — Michael Barr (Fed Governor) remarks
⏰ 7:15 PM — Austan Goolsbee (Chicago Fed) speech
⚠️ Disclaimer: Educational/informational only — not financial advice.
📌 #trading #stockmarket #SPY #SPX #FOMC #Fed #Powell #Barr #Kashkari #Goolsbee #minutes #bonds #Dollar #economy #megacaps

EUR/AUD Ready for Another Drop? Watch 1.7500!🔹 COT (Commitment of Traders)
Euro Futures: Non-commercial longs slightly decreased (-789) while shorts increased (+2,625) → mild bearish sentiment on the Euro.
AUD Futures: Non-commercial longs increased (+1,718) while shorts surged strongly (+10,148) → clear bearish positioning on the Australian Dollar.
📌 Combined Interpretation: Mixed signals — institutional investors are trimming Euro longs while heavily increasing AUD shorts, which could sustain EUR/AUD strength in the short term despite mild Euro weakness.
🔹 FX Sentiment (retail positioning)
56% short vs 44% long.
📌 Retail slightly net short → mild contrarian signal supporting short-term upside for EUR/AUD, but not extreme enough to indicate a reversal.
🔹 Seasonality
October is historically neutral to slightly bullish for the Australian Dollar, suggesting potential resilience.
However, Euro tends to gain modestly into late Q4, often supported by defensive flows.
📌 Seasonal bias leans slightly bearish for EUR/AUD in October, but momentum remains fragile and can easily flip on macro catalysts.
🔹 Price Action
EUR/AUD rejected from the 1.7920–1.7950 supply zone, confirming a descending channel structure.
Price bounced from the local support around 1.7660–1.7680, with sellers still in control below the upper trendline.
RSI neutral, showing potential for continuation lower after a minor corrective pullback.
Key downside target remains at 1.7500, followed by 1.7400 extension if momentum persists.
Bullish invalidation only above 1.7930, which would confirm a breakout from the descending channel.
🔹 Trading Outlook
Main Bias: Bearish short-term, supported by technical rejection and macro weakness in the Euro.
Contrarian Risk: Slightly short retail exposure could trigger a corrective bounce before the next leg down.
Key Levels:
Resistance: 1.7800 / 1.7930
Support: 1.7600 / 1.7500 / 1.7400

NAS100 - Stock Market on Federal Holiday!The index is above the EMA200 and EMA50 on the four-hour time frame and is in its long-term ascending channel. If the upward momentum decreases, we can expect a correction to the demand zones and buy Nasdaq in that range with an appropriate reward for the risk.
Traders in prediction markets now estimate that the U.S. federal government shutdown could last more than a week and potentially extend into mid-October. These projections suggest that Washington’s political environment has reached a deadlock, making a swift agreement in Congress increasingly unlikely.
The shutdown began early Wednesday morning after Democrats and Republicans—along with President Donald Trump—failed to reach a compromise on a temporary funding bill. As a result, hundreds of thousands of federal employees have been placed on unpaid leave, and numerous government programs and public services have been suspended.
According to data from Bank of America, since 1990, U.S. government shutdowns have lasted an average of 14 days. Although the S&P 500 has typically risen about 1% during such periods, an extended impasse could weigh heavily on an already fragile economy and markets near record highs.
The credit rating agency Fitch stated that the current shutdown will not have a direct impact on the United States’ credit rating, which remains at AA+ with a stable outlook. However, the agency noted that repeated reliance on short-term funding resolutions reflects persistent weaknesses in U.S. fiscal governance. Still, Fitch expects the U.S. dollar’s status as the world’s reserve currency to remain intact in the near future.
Fitch also added that a short-lived shutdown is unlikely to affect most public-finance credits, though a prolonged one could pose negative risks for bond issuers—particularly those dependent on federal funding in areas such as healthcare, housing, and higher education.
Meanwhile, UBS argued that concerns over the U.S. government shutdown have been overstated, predicting that its economic impact will be limited and short-lived. The bank advised investors to look beyond political noise and instead focus on Federal Reserve rate cuts, corporate earnings, and opportunities in artificial intelligence.
Economists at Citi expect the Federal Reserve to implement two 25-basis-point rate cuts in October and December, in line with its Dot Plot projections. However, the shutdown could delay access to key labor and inflation data, forcing investors to rely more heavily on private sources such as ADP reports.
Similarly, Bank of America forecasts a rate cut in October but notes that markets have already priced in this outcome, assigning a 95% probability for October and 85% for December. In essence, this projection merely aligns with the consensus that has already formed among traders.
In actual market developments, expectations have shifted back toward easing policies. Over the past two weeks, the hawkish pressure that had supported the dollar has eased, and markets are once again pricing in a lower-rate trajectory. Currently, about 105 basis points of rate cuts are priced in for next year, compared with a previous low of 94 basis points—a shift that favors equities while weighing on the dollar.
According to Daniel Pavilonis, senior commodities broker at RJO Futures, the government shutdown will not significantly impair the Fed’s ability to assess labor market conditions. “The Fed relies more on its proprietary datasets than on official government statistics,” he explained. “Even amid a shutdown, policymakers maintain a fairly accurate picture of the economy.”
After a week dominated by employment data—some released and others delayed due to the shutdown—the upcoming week is expected to be relatively quiet for official U.S. economic releases unless a resolution is reached.Instead, market attention will pivot toward remarks from Federal Reserve officials.
On Wednesday, the minutes of the September FOMC meeting will be released, offering deeper insight into policymakers’ views on the rate path and inflation risks. Then, on Friday, the University of Michigan’s preliminary Consumer Sentiment Index for October will shed light on household perceptions of the economy and their financial conditions—a key gauge for domestic demand strength.
In addition, investors will closely monitor speeches from several Fed officials, including Bostic, Bowman, Miran, Kashkari, Barr, and Musalem. Their comments could directly influence market expectations for monetary policy and shape trading sentiment in the days ahead.
XAUUSD - Will Gold Hit $4,000?!Gold is trading above the EMA200 and EMA50 on the hourly chart and is trading in its medium-term ascending channel. A correction towards the demand zone will provide us with a better risk-reward buying opportunity. It should be noted that these positions are intended to hedge against this uptrend.
In early Monday trading in Asian markets, global gold prices surpassed $3,900 per ounce for the first time, driven by stronger demand for safe-haven assets amid the U.S. government shutdown and rising expectations of further Federal Reserve rate cuts.
Goldman Sachs once again reaffirmed its bullish outlook on gold, calling it its “most favored long-term commodity asset”, even as the precious metal continues to reach new record highs. Analysts at the bank believe the upward momentum remains intact.
Goldman forecasts that gold will reach $4,000 by mid-2026 and $4,300 by December 2026. However, the bank cautioned that upside risks beyond these projections are emerging. Notably, speculative flows account for only about 1% of the recent 14% rally, signaling stronger and more sustainable support from ETFs and central banks.
Marc Chandler, CEO of Bannockburn Global Forex, commented: “Gold has risen for the seventh consecutive week, having declined in only one week since late July. The U.S. government shutdown, Europe’s debate over reusing Russian reserves, and ongoing hybrid tensions across Europe have all contributed to this rally.” He added, “A short-term support level has formed near $3,800, and reaching $4,000 no longer seems far-fetched.”
Similarly, Darin Newsom, senior market analyst at Barchart.com, noted: “The market trend remains bullish. The U.S. economy has not improved—if anything, it has deteriorated further. Central banks and global investors clearly recognize this and continue accumulating gold.”
For this week, considerable uncertainty surrounds the U.S. data release calendar. If Democrats and Republicans manage to reach an agreement on a temporary funding bill early in the week, the September employment report could be released on schedule Friday. Estimates suggest a modest improvement in job creation, with around 50,000 new positions, though the weak ADP private payrolls data paints a more cautious picture. Still, downside risks to employment remain, reinforcing expectations for further rate cuts.
Even if the jobs report is delayed, the ongoing government shutdown alone could drive markets to increase bets on rate reductions, as a surge in furloughed federal workers and reduced economic output from halted government operations may compel the Fed to lower borrowing costs.
Beyond Washington’s political standoff, investors’ focus this week will be on the minutes from the Fed’s September meeting, which could reveal growing divisions among policymakers over the labor market outlook.
The Fed’s latest dot plot highlights a widening gap between hawkish and dovish members, meaning any new clues in the minutes about the timing or pace of rate cuts could spark a strong market reaction.
Toward the end of the week, attention will also turn to the University of Michigan’s preliminary consumer sentiment survey, particularly the inflation expectations component, which holds significant weight for gauging domestic demand. At the same time, the U.S. Treasury market faces a busy schedule of debt auctions, adding another layer of focus for investors.

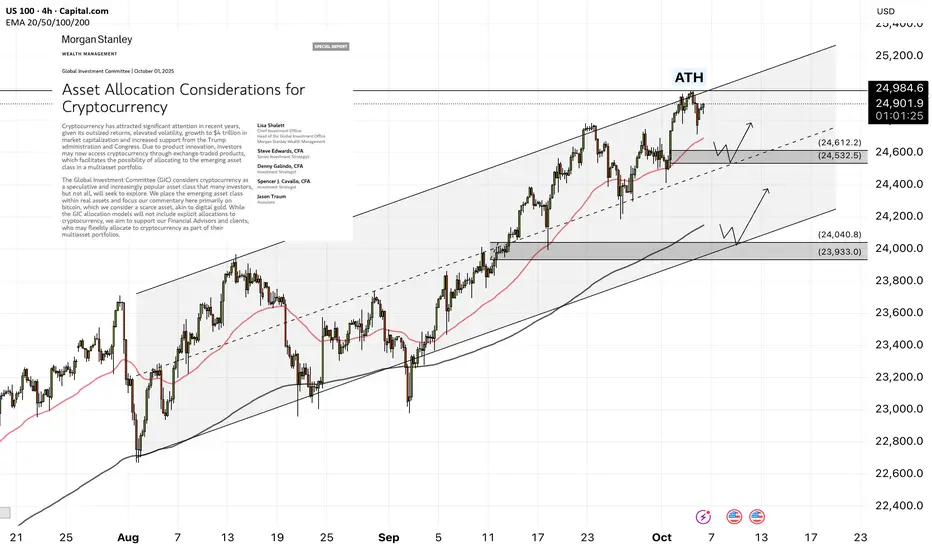
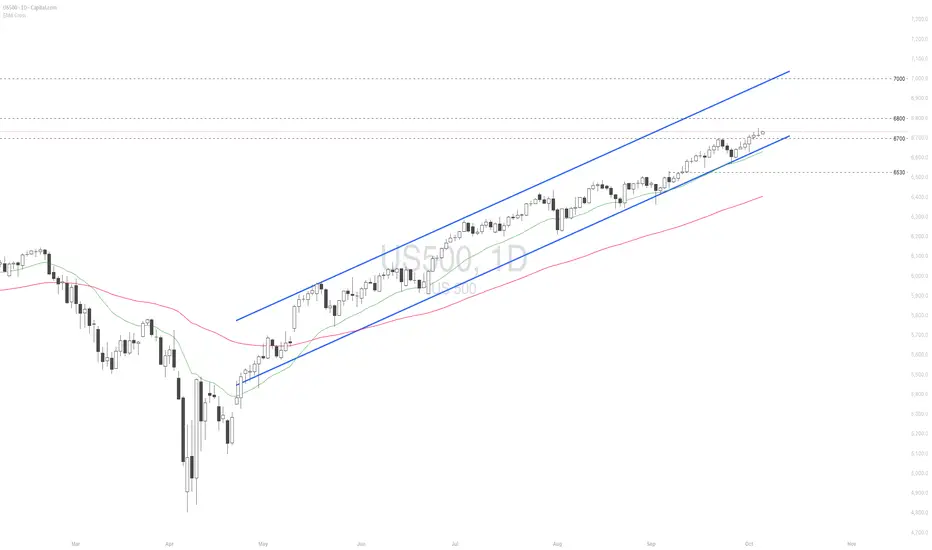
Will the AI frenzy drive US indices to new record highs again?
Despite the US government shutdown risk and elevated valuation concerns, US equities continued their upward rally, driven primarily by strength in AI-related stocks.
OpenAI’s valuation has surged to USD 500 billion, a sharp jump from the USD 300 billion valuation in an earlier SoftBank-led funding round earlier this year. This makes OpenAI the most valuable startup in the world, surpassing SpaceX.
Citigroup (C) raised its forecast for global AI spending, projecting USD 490 billion by 2026 (up from USD 420 billion) and cumulative hyperscaler investments by Amazon (AMZN), Microsoft (MSFT), and others to reach USD 2.8 trillion by 2029, up from the previous USD 2.3 trillion estimate.
US500 extended its rally to a new record high, maintaining a solid uptrend within the ascending channel. The diverging bullish EMAs point to the potential continuation of bullish momentum. If US500 breaches above the psychological resistance at 6800, the index may gain upward momentum toward the next psychological resistance at 7000. Conversely, if US500 breaks below the support at 6700, the index could retreat toward 6530.
USD/CHF Bulls Eye 0.8080 – But Is a Trap Coming First?🔹 COT (Commitment of Traders)
USD Index: Non-commercial longs increased (+1,541), shorts decreased (-1,009). → Speculators turning more bullish on the Dollar.
CHF Futures: Non-commercial longs rose (+1,992), shorts declined (-1,030). → Speculators also turning more bullish on the Swiss Franc.
📌 Combined Result: Strength on both USD and CHF, but the imbalance favors the Dollar.
🔹 FX Sentiment (retail positioning)
74% long USD/CHF vs 26% short.
📌 Retail is heavily long → contrarian signal → risk of a downside correction, even though the macro setup still favors USD.
🔹 Seasonality
October is historically bearish for USD/CHF (average -0.01 to -0.02 over the last 10–20 years).
November tends to be neutral, while December is again weak.
📌 Seasonal bias → contradicts Dollar strength, adding short-term downside risk.
🔹 Price Action
Price consolidating around 0.7980, after a recovery from the BPR (Balanced Price Range).
Structure suggests possible continuation higher toward the 0.8050–0.8080 supply zone.
RSI neutral, with room for further upside.
A break below 0.7940 would invalidate the bullish scenario and expose downside toward 0.7900.

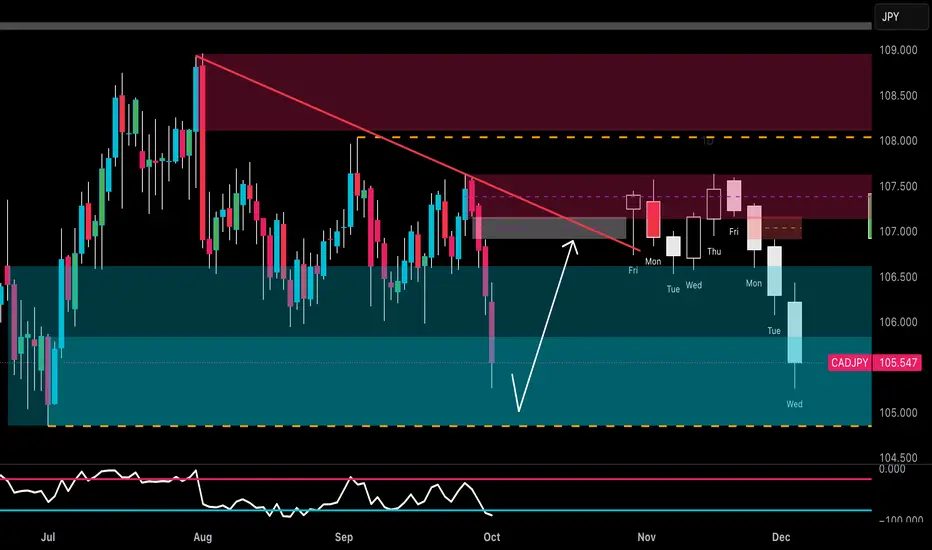
CADJPY Set for October Crash? Institutions Bet Big on Yen 📊 Multi-Factor Analysis – CADJPY
COT Data
JPY: Net long positions are strongly increasing → Non-Commercial long +14.7K, Commercial long +12K. Institutional flows favor the Yen, confirming a bullish bias on JPY.
CAD: Heavy liquidation → Commercial longs -49K, shorts -59K, Non-Commercial longs decreasing (-2.9K). Net positioning shows bearish sentiment on CAD, with a clear prevalence of short exposure among speculators.
👉 Interpretation: Institutional flows point toward a strong JPY and weak CAD → bearish bias on CADJPY.
Seasonality
CAD: Historically weak in October (negative averages in 20Y and 15Y, worsening in 5Y and 2Y).
JPY: Historically strong in October, especially on short-term frames (5Y and 2Y very bullish).
👉 Interpretation: Seasonality supports a bearish scenario on CADJPY during October.
Retail Sentiment
90% Long vs 10% Short on CADJPY.
👉 Extreme retail long positioning = contrarian bearish signal → potential for further downside pressure.
Technical Analysis
CADJPY broke below the descending trendline.
Currently trading inside the weekly demand zone (105–106), acting as short-term support.
RSI oversold → likely technical bounce toward 106.8–107.2 (supply + trendline) before continuation lower.
Primary structure remains bearish, with medium-term targets at 104.80–105.00.
EUR/GBP Rejected at 0.8760 - Is a Pullback to 0.8660 Next?🔹 COT (Commitment of Traders)
GBP Futures: Non-commercial longs increased (+3,704) while shorts decreased (-912) → speculators are turning more bullish on the Pound. Commercials slightly increased shorts (-1,853) but remain largely neutral.
Euro Futures: Non-commercial longs decreased (-789) while shorts increased (+2,625) → signaling bearish pressure on the Euro.
📌 Combined Result: Clear imbalance in favor of GBP, with stronger net positioning compared to the Euro.
🔹 FX Sentiment (retail positioning)
EUR/GBP: 87% short vs 13% long.
📌 Extremely skewed retail positioning → contrarian signal → short-term upside potential for EUR/GBP, but macro context still favors GBP strength.
🔹 Seasonality
September and October show a historically neutral to slightly bearish bias over 15–20 years.
November–December tend to favor the Euro with seasonal rebounds.
📌 In the short term, there is no strong seasonal support for an EUR/GBP rally.
🔹 Price Action
Strong rejection from the 0.8740–0.8760 supply zone, with consolidation below resistance.
Possible retracement toward demand area 0.8660–0.8680, aligning with the dynamic trendline.
RSI is neutral, no major divergences, but momentum is cooling.
Structure remains bullish only above 0.8760; otherwise, risk of reversal toward 0.8620–0.8600.

EUR/USD Rejected Hard at 1.19 COT (Commitment of Traders)
Euro FX: Non-commercials slightly reduced longs (-789) but increased shorts significantly (+2,625). Commercials added both longs (+4,978) and shorts (+3,375), signaling hedging but with a defensive bias. → Net positioning remains positive on the Euro, but short pressure is increasing.
USD Index: Non-commercial longs rose (+1,541), while shorts decreased (-1,009). → USD strengthened by large speculators.
📌 Interpretation: Imbalance in favor of the Dollar, with the market turning more cautious on the Euro.
FX Sentiment
55% short EUR/USD vs 45% long.
📌 Retail is slightly skewed short → often contrarian → could support limited upside, but not extreme.
Seasonality
September is historically weak for EUR/USD (-0.01/-0.012 over 5–10 years).
October is also negative, while November–December historically show rebounds.
📌 Short-term seasonal bias (September–October) remains bearish.
Price Action
Strong rejection from the 1.1850–1.1900 supply zone.
Currently testing the 1.1740 area.
Bearish structure with probable downside targets at demand zones:
1.1650 → first key level.
1.1550 → deeper bearish extension if USD strength persists.
Only a stable recovery above 1.1820 would invalidate the bearish scenario.
Trading Outlook
Main Bias: Bearish in the short term (Sep–Oct), supported by COT (USD strength), negative seasonality, and technical rejection.
Contrarian Risk: Slight retail shorts could trigger minor rebounds, but overall setup favors selling rallies.

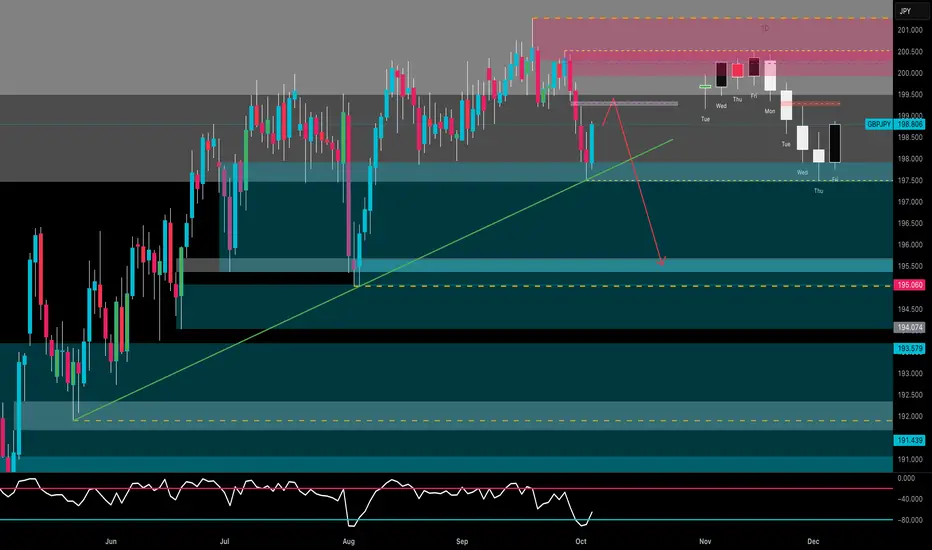
GBP/JPY Bears Back in Control – Is 195.50 the Next Target?🔹 COT (Commitment of Traders)
GBP Futures: Non-commercial longs increased (+3,704) while shorts decreased (-912) → speculators are turning more bullish on the Pound.
JPY Futures: Non-commercial longs sharply increased (+14,727) while shorts declined (-3,362) → strong bullish momentum returning to the Yen.
📌 Combined interpretation: Opposite momentum — both GBP and JPY show long accumulation, but the strength is significantly higher on the Yen, suggesting potential short-term weakness for GBP/JPY.
🔹 FX Sentiment (retail positioning)
59% short vs 41% long.
📌 Retail slightly skewed short → moderate contrarian signal, but not extreme. A short-term bounce is possible, though the broader macro picture remains fragile for GBP.
🔹 Seasonality
October is historically bullish for GBP/JPY on a 5–10 year average (+1.8% to +2.4%).
However, 15–20 year data show a more neutral to slightly negative bias, reflecting volatility rather than stable direction.
📌 Overall, a neutral-to-bullish seasonal bias, but vulnerable to a technical correction after the strong rallies seen in August–September.
🔹 Price Action
Strong rejection from the 200.50–201.00 supply zone with consecutive bearish daily closes.
Current dynamic support sits around 197.00–196.50, aligned with the ascending trendline.
RSI remains neutral and far from oversold → room for further downside.
Possible pullback toward 199.00–199.50 before a new bearish leg.
Main downside targets: 195.50, then 194.00 as an extended target.
🔹 Trading Outlook
Main Bias: Short-term bearish, with JPY strength (COT) and a corrective structure following the 201.00 top.
Contrarian Risk: Slight retail short bias could trigger a minor bounce before continuation lower.
Key Levels:
Resistance: 199.50 / 200.50
Support: 197.00 / 195.50 / 194.00
🎯 Outlook: Expect a pullback toward 199.00 before another bearish move toward 195.50. Daily structure remains bearish as long as 200.50 holds.
Why I have USD/JPY Falling Below 139.5 On My Bingo CardUSD/JPY traders have been treated (or perhaps burned) from two months of choppy trade, reversals and false breakouts. Yet price action clues and developments from the Fed and BOJ have allowed me to revisit my original thesis of a lower USD/JPY. I now have a break below 139.50 on my bingo card.
Matt Simpson, Market Analyst at City Index.

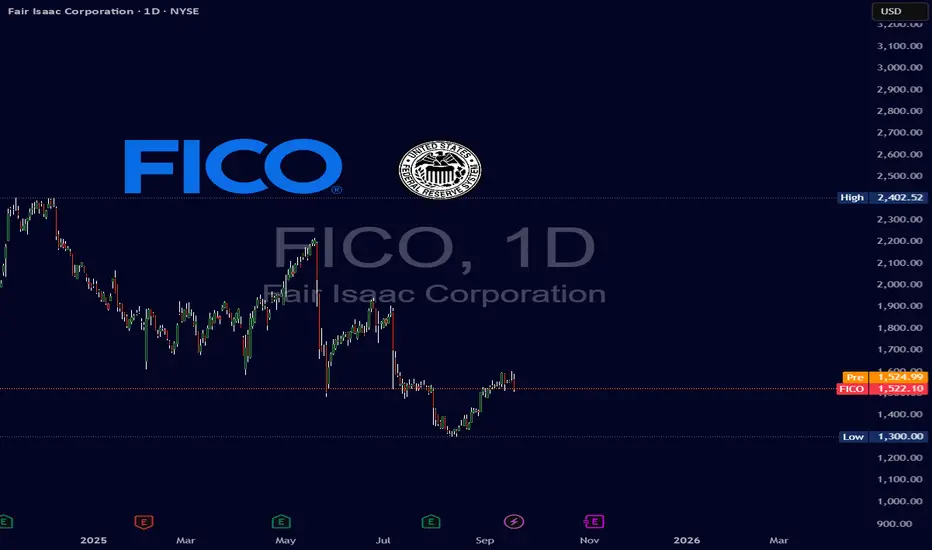
FICO and the FedNow that NYSE:UNH has started to pick up due to the shares acquired by many large names, we need to turn our attention to companies not yet in the news cycle. One of these companies is NYSE:FICO , which handles credit worthiness scores. But why, in a time where home buyers and consumers are being crushed at every turn, would a credit solutions agency be a good buy? The answer is because it is forward looking, and we are looking toward a time of, more likely than not, lower interest rates.
First let’s look at the charts...
As you can see, from the all-time high, FICO is at a 40% discount. So, we are following the universal rule of buying low. Now all we must do is sell high. Based on Powell's speech at Jackson Hole, we can see that the Fed is gearing up to cut interest rates. You can also see this is the case with the amount of debt-buying taking place in the bond market...
So, the problem is not IF they'll cut rates, but WHEN and by how much. In agreement with what most people see coming, expect the next meeting to lead to a 25 bps drop in the $FRED:FEDFUNDS. When this happens, you can also expect the credit agencies to blast off onto the horizon. (Written before Sep 16-17 meeting)
Before we get to the exit plan, we do have some housekeeping. It should be noted that FICO, in the practical sense, is no longer a monopoly. Equifax has been approved for its rating system by the government, so this trade does not come without risk. The good news is that as rates get lowered we can expect more people to take on more debt (because it is cheaper), which will boost the demand for FICO's rating abilities. We should aim for a timeframe before the next earnings call to get out of this trade, but the usual target of 3 to 6 months remains as the timeframe for holding this position. A longer period can be justified based off any unusual performance. The price target will be set at $2,000.
EURUSD BULLSA lot of traders are anticipating sell direction, most have already sold at around 1.17700 zone. For me I still hold a bullish bias due to:
1. Although technical analysis leaves room to catch sells the pair still maintains an uptrend. Therefore, based on recent events claiming a US government shut down, conflicting views on rate cuts from Fed officials and NFP Lining up on Friday creating a risk on mood, I find it wise to sell towards NfP. Any lower than expected will confirm the bulls further and focus can shift to 1.192000 and later 1.20000. But higher than expected will mean that the Fed will keep interest rates steady and a reversal will be confirmed.

Exness: Japanese Yen Hawkish Shift Intertwined with Fed Rate CutExness: Japanese Yen Hawkish Shift Intertwined with Fed Rate Cut Expectations: What Lies Ahead?
The signals from the Bank of Japan's policy meeting on September 18-19 mark a potential turning point. Although the decision was made to keep the policy interest rate at 0.5% with a 7-2 vote, the internal details revealed growing hawkish pressure. Policy board members Hajime Takata and Naoki Tamura voted against maintaining the interest rate, advocating for an immediate 25 basis point hike to 0.75%. This is the first dissenting vote since Governor Kazuo Ueda took office, clearly indicating a growing call for tighter policy within the central bank.
Even more surprisingly, the Bank of Japan simultaneously announced that it would begin preparations to sell its holdings of exchange-traded funds (ETFs) and Japanese Real Estate Investment Trusts (J-REITs). Although the planned pace of sales is relatively modest, this is seen as a substantive step towards policy normalization, with its signaling significance far outweighing its actual market impact.
The "Summary of Opinions" from the September meeting, just released today (September 30), provides decisive evidence of this hawkish shift. The document shows that there was a serious and in-depth debate within the policy board on the "possibility of a near-term rate hike." Several members believed that the conditions for another rate hike were maturing, with one opinion explicitly stating, "Given that it has been more than six months since the last rate hike, perhaps it is time to consider raising the policy interest rate again." Even Asahi Noguchi, a deliberation committee member usually considered dovish, stated in a speech on September 29 that the necessity of adjusting the policy interest rate is "greater than ever."
This series of signals quickly reshaped market expectations. Currently, market pricing reflects that the probability of the Bank of Japan raising rates by 25 basis points at its next meeting on October 29-30 has surged to about 60%.
In stark contrast to the Bank of Japan's increasingly firm stance, the Federal Reserve is on a clear path of easing, primarily driven by concerns about a cooling US labor market. Key inflation data released last week on September 26 further solidified this expectation.
Data shows that the Federal Reserve's most favored inflation indicator, the core Personal Consumption Expenditures (PCE) (Chart 1) price index for August, increased by 2.9% year-on-year, remaining consistent with July and fully meeting market expectations. This "as expected" report is widely interpreted by the market as "non-threatening" inflation, suggesting it will not hinder the Federal Reserve's interest rate cuts and instead bolsters investor confidence in future rate reductions.
The Tug-of-War Between Inflation and Growth
The fierce debate within the Bank of Japan between hawks and doves stems from the contradictory signals sent by Japan's domestic economic data. On the one hand, persistently above-target inflation provides a reason for raising interest rates; on the other hand, recent signs of slowing growth call for the central bank to remain cautious. This tug-of-war between inflation and growth makes the Bank of Japan's decision-making path full of uncertainty.
Inflation Outlook: The Hawks' Confidence
Hawkish officials who support interest rate hikes primarily base their arguments on persistent inflationary pressures in Japan. The national core Consumer Price Index (CPI) (Chart 2) for August, released on September 18th, rose by 2.7% year-on-year. Although this is a slowdown from July's 3.1%, it marks the 29th consecutive month that this data has been above the Bank of Japan's 2% target.
What is even more noteworthy is that the "Core-Core CPI", which excludes fresh food and energy and is regarded by the Bank of Japan as a measure of underlying inflation trends, remained stubbornly high at 3.3% in August. This persistent underlying price pressure is the core argument for hawkish members who believe the inflation target has been "largely achieved." In addition, the Tokyo core CPI for September (released on September 25), which is a leading indicator for national inflation, remained stable at 2.5% year-on-year, further indicating that inflationary pressures are not rapidly dissipating.
Growth Outlook: Dovish Concerns
However, just when the hawkish arguments seemed fully substantiated, the latest series of economic activity data released this week cast a shadow over the outlook, providing strong support for a dovish, cautious stance.
Data released on September 29th and 30th showed that preliminary industrial output for August decreased by 1.2% month-on-month (Chart 3), significantly worse than the market expectation of -0.8% and also weaker than the previous figure of -0.4%. This indicates that production activities are contracting in manufacturing, a crucial pillar of the Japanese economy, possibly due to the negative impact of US tariff policies and a slowdown in global demand.
At the same time, retail sales data for August, a key indicator of domestic demand, was also disappointing.
This data unexpectedly fell by 1.1% year-on-year, a significant departure from market expectations of a 1.0% increase; it even saw a substantial 1.6% month-on-month decrease. This clearly indicates that Japanese household consumption power is being eroded, and domestic demand is beginning to show weakness, against a backdrop of inflation consistently higher than wage growth.
In addition, the preliminary Manufacturing Purchasing Managers' Index (PMI) (Chart 4) for September fell to 48.4, marking the fastest contraction in six months and further confirming the downward pressure on the economy.
From a technical perspective, USD/JPY is at a critical crossroads. Recent price movements show a fierce struggle between bulls and bears around important technical levels, reflecting fundamental uncertainties. USD/JPY failed to reach the key 150.00 level, then fell back below 149.00 and the EMA21. The price is still fluctuating within the 148.00-149.00 range, indicating possible consolidation. If it stays below 149.00, the price may consolidate further within the 148.00-149.00 range. Conversely, if it returns above the EMA21 and 149.00, it may retest the key 150.00 level.
Integrating the above fundamental and technical analysis, a core conclusion can be drawn: the previous one-sided short-yen trading environment has ended. The market is entering a new phase that is more balanced but potentially significantly more volatile.
The movement of USD/JPY is no longer dominated by a single factor, but depends on the interplay between the hawkish potential of the Bank of Japan and the dovish reality of the Federal Reserve. The short-term direction of the exchange rate will be determined by which central bank's actions (or inactions) surprise the market more.
The future path will be largely determined by two key economic data releases scheduled for this week:
Japan Tankan Survey (October 1): Can this report give the Bank of Japan's hawks enough confidence to act in October?
US Non-Farm Payrolls (October 3): Will this data confirm the weakening of the US labor market, thereby "paving the way" for the Federal Reserve's rate cut path?
The outcome of these two events will likely determine whether USD/JPY breaks key support and tests lower levels, or whether it can hold its ground here and gather strength to challenge the strong resistance area of 150 again.
In any case, what is certain is that the era of one-sided yen depreciation is over, and a new phase full of strategic reassessment and uncertainty has arrived.
By: Eric Chia, Financial Market Strategist at Exness

SPY MONEY PRINTER GO BRRR|LONG|
✅SPY with the FED lowering rates, liquidity injections perspective fuel risk assets. Price has broken out above the key level, signaling bullish order flow. SMC outlook suggests momentum could push into new all-time highs as money printer effects unfold. Time Frame 1H.
LONG🚀
✅Like and subscribe to never miss a new idea!✅

BTC Tests Range Highs Below 120k: Wait for Confirmation __________________________________________________________________________________
Market Overview
__________________________________________________________________________________
BTC is back at the top of its range, pressing 116.8k–117.97k just beneath the 120k barrier. Higher timeframes (12H/1D) lean bullish, while mid-TFs still push back — confirmation is key before chasing strength.
Momentum: 📈 Cautiously bullish; above 115.2k, a clean close >117.97k would likely unlock 120k.
Key levels: Resistances: 116.8k–117.97k; 120k; 124.3k. Supports: 115.2k; 114k; 112.4k–111.1k.
Volumes: Very high on 6H→30m (mostly under resistance), normal on 1D.
Multi-timeframe signals: 1D/12H Up; 6H/4H/2H Down; 1H/30m/15m Up.
Risk On / Risk Off Indicator context: NEUTRE VENTE — slight risk-off, contradicting daily momentum.
__________________________________________________________________________________
Trading Playbook
__________________________________________________________________________________
With range highs overhead, stay constructive but disciplined: lean cautiously bullish while 115.2k holds and wait for confirmed breaks to avoid traps.
Global bias: Cautious bullish while 115.2k holds; major invalidation on a 1D close <114k.
Opportunities:
• Pullback buy if 115.2k holds, then confirm >116.8k.
• Breakout long on 1D close >117.97k; add if 120k flips to support.
• Tactical sell on rejection at 116.8k–117.97k toward 115.2k then 114k.
Risk zones / invalidations: Loss of 115.2k opens 114k/112.4k; a 1D close >120.6k invalidates top-shorts.
Macro catalysts: Fed −25 bps (supports risk), potential US data timing shifts (ISM/NFP) that can cluster volatility, and positive BTC spot ETF flows (Day +$430M) reinforcing dips.
Action plan: Entry >117.97k (≥2 closes + retest) / Stop <115.8k / TP1 120k, TP2 122.5k, TP3 124.3k / R:R ~1.8–2.5.
__________________________________________________________________________________
Multi-Timeframe Insights
__________________________________________________________________________________
Higher timeframes point up, but mid-TF supply still caps price near the range highs; intraday strength needs follow-through to avoid bull traps.
1D/12H: Holding above 115.2k preserves upside bias; convert 117.97k to open 120k then 124.3k.
6H/4H/2H: Seller pressure below 116.8k–117.5k; beware fake breaks without volume follow-through.
1H/30m/15m: Impulsive bounce is constructive, but requires break/hold (≥2 bars) to confirm trend continuation.
__________________________________________________________________________________
Macro & On-Chain Drivers
__________________________________________________________________________________
A supportive macro backdrop and improving flows help, but timing risks keep volatility elevated around resistance.
Macro events: Fed easing (−25 bps) underpins risk appetite; shifting ISM/NFP timing may concentrate moves around data windows.
Bitcoin analysis: 114k–115.2k defended; highest quarterly close; weekly ETF inflows turned positive.
On-chain data: STH cost basis ~111k; ETF inflows resumed; recent deleveraging cleans positioning.
Expected impact: Slight bullish tilt if 115.2k holds and 117.97k flips to support; otherwise risk of 114k/112.4k retests.
__________________________________________________________________________________
Key Takeaways
__________________________________________________________________________________
BTC is pressing range highs with active supply below 120k. The cleaner long is a confirmed breakout >117.97k with 120k turning into support; otherwise, fading rejections back into 115.2k remains valid. Macro support (−25 bps + positive ETF flows) helps, but confirmation at resistance matters most. Stay patient and execute only on validated signals.

Long EUR/USD on USD Weakness Amid Government ShutdownShort-term trade idea:
Entry: 1.1740–1.1750
Target: 1.1820
Time Horizon: 1–3 days
The ongoing U.S. government shutdown adds downside risk to the dollar, particularly amid softening data and weakening labor market sentiment. Delays in key releases like jobless claims and nonfarm payrolls reduce policy visibility for the Fed and support market expectations for rate cuts in the coming months. Broader risk-off sentiment and pressure on U.S. equities also weigh on the dollar.
Meanwhile, the ECB's decision to keep rates on hold confirms a "wait-and-see" approach, which was already priced in. More importantly, there was no dovish surprise. The ECB is not signaling imminent cuts. With eurozone inflation expected to remain firm, rate cut expectations should stay contained, helping to keep the euro supported. This opens the door for EUR/USD to grind higher, with 1.1800–1.1820 as a short-term target.
Risks:
Rapid resolution of the U.S. government shutdown
Strong upside surprise in U.S. ISM or ADP data
Hawkish Fed rhetoric pushing back against market dovishness
