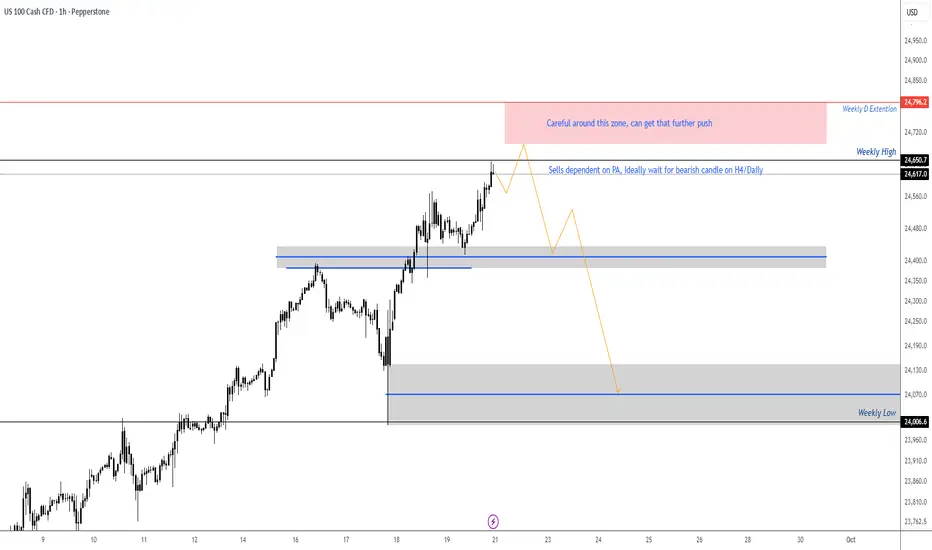
NASDAQ - setting up for Bearish SetupLooking for the bearish signal or the H4/Daily time frame, might get that final push for the D extension on the weekly timeframe, opening of the week might get a small pullback then continuation to the upside. Trade will be validated only if we get bearish PA setup on the H4/Daily. Looking for the setup to create a turn shape then can look for potential entries. If price does not present a bearish setup on the H4/Daily then the plan is no longer valid.
Fed
Gold Sets New Record: Buy or Sell Amid the Market Frenzy?Hello traders,
Last week, gold ended with an unexpected twist. Prices continued to climb on Friday (19/09), marking the 5th straight week of gains, reaching $3,683.24/oz, while futures advanced to $3,718.50/oz. This came right after the Fed cut interest rates—a move that was expected to “cool” gold. So, is this rally sustainable or just a trap?
Fundamental Analysis: Rate Cuts Fuel Gold’s Rise
After the Fed cut rates by 0.25%, the market saw chaotic trading, with gold hitting historic highs before a quick pullback. Still, the Fed’s message reinforced investor confidence in gold:
Lower holding costs: Reduced interest rates lower the opportunity cost of holding non-yielding gold.
Dovish Fed stance: Despite warning about persistent inflation, Minneapolis Fed President Neel Kashkari suggested job risks could lead to further cuts, raising expectations for looser policy.
Strong demand: Physical gold demand remains high. In India, prices hit a 10-month peak, while in China, discounts widened to a 5-year high, signaling robust demand despite rising prices.
Technical Analysis: Structure Break, Uptrend Resumes
By the weekend, gold broke through its downtrend line, confirming a structural shift and highlighting strong buying pressure. This suggests the bullish trend may continue.
Outlook: This week, focus remains on buying opportunities with short-term targets at $372x and $373x. However, caution is needed with upcoming macroeconomic events, which could trigger large liquidity zones and potential traps.
Sample Trading Strategies (strict risk management):
BUY SCALP: $3671–$3669 | SL: $3666 | TP: $3674–$3694
BUY ZONE: $3657–$3659 | SL: $3647 | TP: $3669–$3709
SELL SCALP: $3713–$3715 | SL: $3719 | TP: $3705–$3785
SELL ZONE: $3731–$3733 | SL: $3741 | TP: $3723–$3683
The market is heating up. Can gold smash through barriers to set fresh records? Share your thoughts below! 👇

EUR/GBP at a Critical Level: Breakout or Fakeout?1. Seasonal Tendencies
September over a 20y–15y horizon is historically neutral to slightly positive.
In the last 5y and 2y, however, seasonality has shown stronger bullish tendencies with significant average gains.
October, on the other hand, historically turns negative, suggesting that the current bullish momentum may face resistance and a potential reversal next month.
📌 Seasonal Conclusion: Short-term bullish support until the end of September, but a correction risk in October.
2. Sentiment
90% of retail traders are short from around 0.8623.
Only 10% are long, with worse average entries at 0.8682.
Such an extreme imbalance signals a high risk of a bullish squeeze: retail traders are fighting the trend and often end up trapped.
📌 Sentiment Conclusion: Contrarian bullish → likely continuation higher into liquidity zones.
3. Commitment of Traders (COT)
Euro: Non-Commercials reduced longs (-4,788) and added shorts (+3,130). Commercials increased longs. Net pressure is bearish from speculators, but institutional support remains.
Pound: Non-Commercials increased longs (+5,947) and cut shorts heavily (-21,078). Commercials drastically reduced longs (-71,750).
Speculators are becoming more bullish on GBP, while institutions are scaling back. Short-term this may favor GBP, but with retail heavily short on EUR/GBP, there’s still room for upward pressure.
📌 COT Conclusion: Mixed outlook, but with a slightly bullish bias on EUR/GBP as long as the market unwinds retail shorts.
4. Technical Analysis (Daily Chart)
EUR/GBP is trading at 0.8720, testing a daily supply area (0.8730–0.8770).
Structure: ascending channel, with the latest bullish impulse from 0.8620.
RSI is in overbought territory, signaling stretched conditions.
📌 Technical Conclusion: The market is at a critical juncture → a break above 0.8730 opens the door for longs, while a strong rejection would confirm a correction.
Overall Bias: Slightly bullish in the short term (September + retail shorts), but reversal risk rises into October.

SOFR Futures: Understand Market Pricing for future Fed PolicyWith the Federal Reserve having just cut interest rates and guiding towards further cuts this year and through 2026, I have received several requests to explain how traders can understand for themselves what the market is pricing and expecting for Fed policy by a specific point in time.
Perhaps the more simplistic way to view what is priced or implied for the next FOMC meeting is to use the ‘FedWatch’ tool on the CME's website - www.cmegroup.com . This looks at the distribution of expectations for the next FOMC meeting, as implied in the fed funds futures pricing.
Interest rate futures can guide our understanding of what’s priced
One way traders can gauge the market’s expectations for future Fed policy—commonly referred to as “what is priced in”—is through interest rate futures pricing or in interest rate derivatives (interest rate swaps, for example). These are tradable instruments that allow investors and corporates to hedge their interest rate risk, while also giving speculators a vehicle to express views on where they see Fed interest rate policy at a specific point in time.
TradingView doesn’t offer pricing on IR swaps, but it does offer pricing on SOFR 3-month futures and Fed funds futures, both of which can be useful in understanding where the market sees policy risk. My preference is SOFR futures, as they are comparatively more liquid, especially in the further-dated contracts for 2026 and 2027 and are more heavily traded than Fed funds futures.
What is the SOFR rate?
SOFR is one of, if not the most important, markets in the entire financial ecosystem. It is the first derivative of markets and is worth taking a moment to familiarise yourself with.
SOFR (Secured Overnight Financing Rate) essentially represents the interest rate at which financial institutions lend cash overnight (and what borrowers pay), with borrowers pledging US Treasuries as collateral.
The Federal Reserve influences SOFR through its monetary policy settings, with the rate typically tracking within the Fed’s target corridor. This corridor is defined by the upper bounds and what the Fed pays banks on reserves (currently 4.25%) and the lower bounds and what the Fed pays financial institutions that lend overnight repo to the Fed (the ‘RRP rate’, currently 4%).
SOFR 3-month futures, therefore, reflect the market’s expectations of what the overnight risk-free rate will average over a defined three-month period at a forward point in time.
For example, the SOFR 3-month December 2026 futures contract (TradingView code: SR3Z2026 ) reflects the market’s expected average interest rate on overnight cash borrowing from December 2026 through to the contract’s expiration on 16 March 2027.
Since SOFR is guided by the Fed’s policy corridor, the futures price on that contract provides an indication of where the Fed could set interest rates at a given point in time.
Calculating the markets expectations for future Fed policy from SOFR futures
The price of SOFR 3-month futures moves dynamically through supply and demand, with rates traders reacting to economic data, Fed communications, sentiment in other markets (such as equities), and liquidity conditions. Upon expiration, futures are cash settled at 100 (or “par”), so the implied interest rate for a set contract is calculated as 100 minus the futures price.
For example, if SR3Z2026 trades at 96.99, the implied rate for the SOFR between Dec 2026 and 16 March 2027 is 3.01% (100 – 96.99). If the current SOFR spot rate (TradingView code: SOFR) is 4.38%, this therefore implies that the market is pricing 139 basis points of further Fed rate cuts by early 2027.
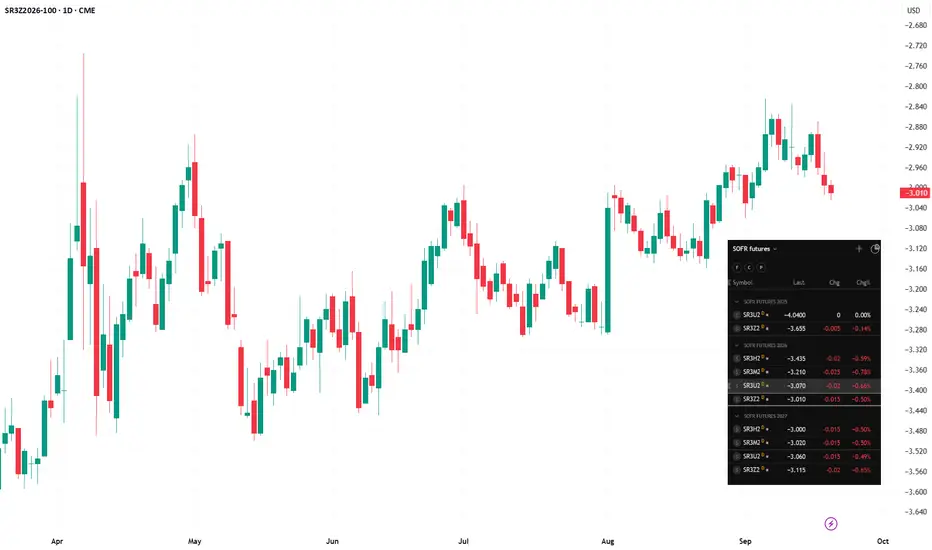
You can add all the SOFR 3-month futures contracts to a watchlist in TradingView, ordered by the contract period. For instance, starting with SR3U2025 (the September SOFR futures expiring on 16 December 2025).
As we see in the screenshot, based on today’s curve, the perceived low point—or the pricing for the “terminal” rate—in the Fed’s cutting cycle is seen in the December 2026 contract, at 2.99%.
Why is this useful for all traders?
Firstly, it provides a clear guide to the market’s view of future Fed policy and what is currently already discounted in interest rate markets. This matters because the USD, US Treasuries, equities, and even gold tend to move in line with—or inversely to—shifts in interest rate futures pricing.
If the market has fully priced in a rate cut, then when the Fed delivers that cut, the market reaction should be minimal. Conversely, if the market expects little or no cut and the Fed surprises by cutting rates, one can expect an outsized reaction in assets like the USD or US 2-year Treasury yields.
This makes SOFR futures incredibly helpful for traders across asset classes when managing risk around key data releases or Fed meetings.
They can also help assess perceived recession risk. If the Fed’s “neutral rate”—the equilibrium setting that is neither stimulatory nor restrictive—is 3%, and the market prices the terminal rate in the cutting cycle at the same level, this suggests a low probability of recession. A recession risk scenario would likely see the market pricing the Fed’s terminal rate well below 2.5%.
Given how often the question “how do I know what’s priced in?” comes up, I hope this offers a clear framework for assessing it through SOFR futures on TradingView.
Good luck to all
Bullish compression below 117k: game plan and risks__________________________________________________________________________________
Market Overview
__________________________________________________________________________________
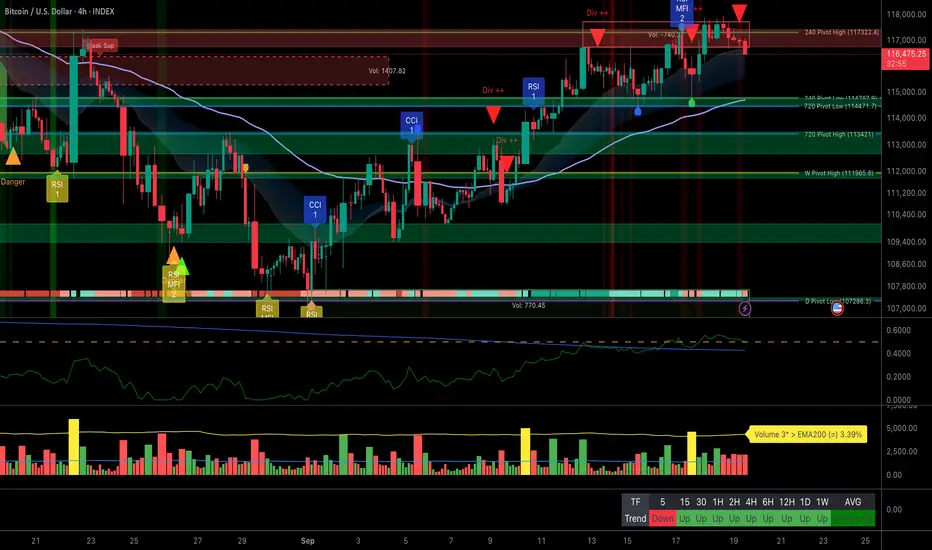
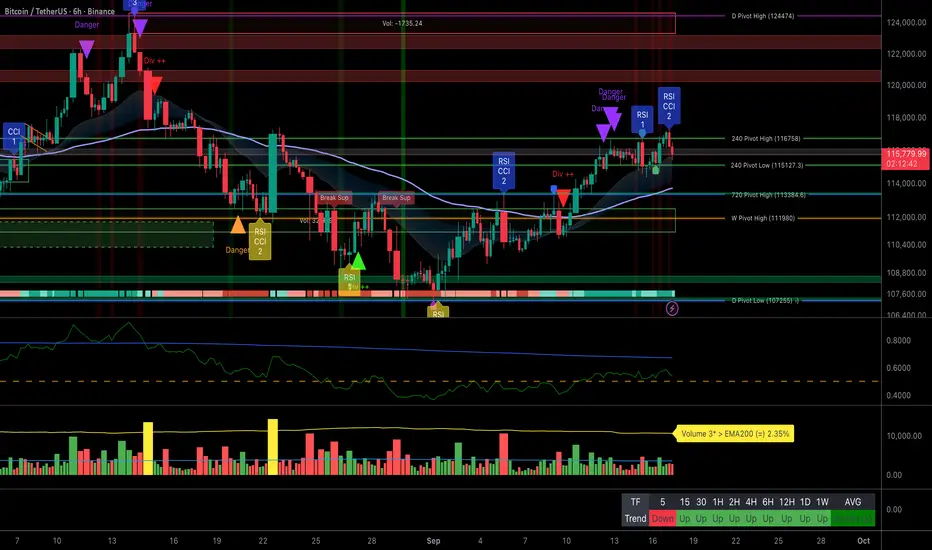
The trend stays bullish but capped by a multi‑TF supply zone, with higher lows supporting the structure. Event‑driven flow (options/witching) may trigger fakeouts around key levels.
Momentum: Bullish 📈 yet constrained below 116.9k–117,322; buyers control as long as 116.2k–116.3k holds.
Key levels:
- Resistances (HTF/ITF): 116,900–117,322 (multi‑TF decision zone); 117,950–118,000 (intraday liquidity); 120,000 (psychological shelf).
- Supports (ITF/HTF): 116,200–116,300 (intraday floor); 114,500–114,800 (240/720 pivot cluster); 111,965.8 (weekly support).
Volumes: Overall normal; 4H moderate (watch for a volume spike on breakout).
Multi-timeframe signals: 1D/12H bullish (MTFTI filter), 6H/4H tactically supportive below 117,322; 15m micro risk‑off → prefer confirmed breakout or buy on support.
Risk On / Risk Off Indicator: Neutral buy — aligns with momentum, but the 1D macro dashboard remains risk‑off, arguing for patience.
__________________________________________________________________________________
Trading Playbook
__________________________________________________________________________________
The dominant stance is cautious‑bullish below resistance; favor pro‑trend executions on confirmed signals.
Global bias: Buy‑the‑dip while 116.2k–116.3k holds; key invalidation below 114,787.9.
Opportunities:
- Breakout buy: daily/4H “break & hold” above 117,322 aiming 118k then 120k.
- Pullback buy: 116.2k–116.3k with 1H/2H bullish reaction, add above 117.0k.
- Tactical sell (counter‑trend): fade a clean rejection at 116.9k–117.3k, tight stop > 117.6k, targets 116.2k then 114.5k.
Risk zones / invalidations:
- A break below 114,787.9 invalidates the bullish bias and opens 114,471.7 then 111,965.8.
- No close > 117,322 over 2 bars (4H/1D) reduces breakout odds.
Macro catalysts (Twitter, Perplexity, news):
- Fed: −25 bps; USD still firm → whipsaw risk around witching/rebalancing.
- BoJ accommodative and softer oil → lighter inflation pressure, tactical risk support.
- Large options expiries ahead → gamma/hedging flows can amplify false breaks.
Action plan:
- Entry: Buy 116,200–116,350 (confirmed 1H/2H bullish reaction).
- Stop: Below 115,950 (1H close).
- TP1/TP2/TP3: 117,000 / 117,950–118,000 / 120,000.
- R/R approx: ~2.5R / ~5–6R / >10R from a 116.25k core entry.
__________________________________________________________________________________
Multi-Timeframe Insights
__________________________________________________________________________________
HTFs are bullish while LTFs manage a compression under 117,322; the key trigger is a confirmed, high‑volume breakout.
1D/12H/6H: Uptrend compressing below 117,322; 114.5k–114.8k is the buy zone; best setups are clean breakout or controlled dip buys.
4H: Strong if triggered; “break & hold” > 117,322 with rising volume unlocks 118k then 120k.
2H/1H/30m: Range 116.2k–117.3k; watch reactions at 116.2k; 4H moderate volume could catalyze the move.
15m: Mild sell pressure; risk of a support sweep before any trigger — avoid anticipating without confirmation.
Major confluence/divergence: Single resistance 116.9k–117,322 across TFs; macro 1D risk‑off vs 4H/6H tailwinds → demand confirmation and volume.
__________________________________________________________________________________
Macro & On-Chain Drivers
__________________________________________________________________________________
Macro is mixed: tactical support post‑Fed contrasts with a 1D risk‑off backdrop, while options flows may dominate near‑term action.
Macro events: Fed −25 bps (tactically risk‑on), USD still firm (headwind for BTC), cluster of events (quad‑witching, rebalancing, expiries) fosters whipsaws; BoJ easy stance and softer oil ease inflation; persistent geopolitical noise.
Bitcoin analysis: Positive ETF inflows and high IBIT volumes back demand; whale withdrawals from institutional venues reduce immediate spot supply — supportive if breakout confirms.
On-chain data: ~95% of supply in profit with a key line near ~115.2k; record options OI (~500k BTC) and max pain ~110k for 26 Sep → potential magnets; perp OI stabilized.
Expected impact: Setup aligns with a cautious‑long bias, but a move > 117,322 needs a volume spike to avoid a head‑fake.
__________________________________________________________________________________
Key Takeaways
__________________________________________________________________________________
BTC is bullish but stuck beneath a key multi‑TF resistance. Trend is positive; the most relevant setup is a “break & hold” above 117,322 (or a controlled dip buy at 116.2k–116.3k) with confirming volume. On the macro side, the Fed’s rate cut helps, but options expiries can blur signals. Be patient, trade confirmed triggers, and defend invalidations.
Dot Plot Divide: Dollar Gains, Gold Stalls The USDJPY spiked lower following the Fed’s 25 basis point cut yesterday but quickly reversed trajectory as the dot plot projections from the FOMC came in softer than markets had expected.
The updated dot plot showed a narrow majority of FOMC members anticipating two more small rate cuts in 2025, while others leaned toward just one or even none.
This potentially suggests that the Fed is not simply aligning with Trump sycophant and newly appointed FOMC board member Stephen Miran’s aggressive call for repeated 50-basis-point cuts and instead signals an element of independence.
USDJPY (left chart, 1H): The pair has carved out a sharp V-shaped reversal after its Fed-driven dip, showing strong bullish momentum. This suggests buyers remain in control unless a reversal candle (such as a bearish engulfing) forms.
XAUUSD (right chart, 4H): Gold’s rally topped out near 3,707 before pulling back more than 600 pips to 3,646. The most recent candles show shorter bodies with upper wicks — a potential sign of fading momentum and supply pressure. If this develops into a bearish continuation pattern, the channel’s border becomes the next area of focus.

Gold Outlook: Bearish Below 3,676, Bulls Need 3,684 BreakGOLD – Overview
Gold remains sensitive ahead of the Federal Reserve rate decision, with volatility also influenced by the potential U.S.–U.K. trade deal.
A Fed rate cut typically supports gold, but
A successful U.S.–U.K. trade deal would reduce safe-haven demand, adding bearish pressure.
Technical Outlook
📉 Bearish scenario
Price may first test 3,676, then drop toward 3,666 → 3,657.
A sustained break below 3,657 would open deeper downside toward 3,640.
📈 Bullish scenario
A confirmed 1H close above 3,684 would signal bullish continuation.
Upside targets: 3,693 → 3,700 → 3,711.
Key Levels
Pivot: 3,676
Resistance: 3,684 – 3,699 – 3,711
Support: 3,666 – 3,657 – 3,640
📌 Market Context:
Fed Decision: A dovish Fed or larger cut could lift gold toward 3,693+.
U.S.–U.K. Trade Deal: Positive headlines would likely weigh on gold by reducing safe-haven flows.

Bank of England holds rates, British Pound slipsThe Bank of England stayed on the sidelines at today's meeting, maintaining interest rates at 4.0%. This followed a quarter-point cut in August. The decision was anticipated by the markets and the British pound is showing limited movement. The 7-2 vote saw two members vote for a quarter-point cut. Last month's decision to lower rates was decided by a 5-4 vote and took an unprecedented two rounds. The split votes reflect dissension within the BoE with regard to the Bank's future monetary policy.
The BoE has been trying to balance rising inflation, which supports holding rates, with the slowdown in the jobs market, which is putting pressure on the central bank to lower rates and ease economic conditions. The BoE cannot ignore inflation, which rose to 3.8% in August, close to double the BoE's target of 2%. Unless inflation slows markedly, the BoE may have to wait until 2026 to lower rates.
The Federal Reserve lowered rates by a quarter-point on Wednesday. The decision, which was widely expected, was the first rate cut since December 2024.
The rate statement cited the cooling labor market as the main reason behind the rate cut. In his press conference, Fed Chair Powell reiterated his concern about the deteriorating job market and said that the risk of higher and more persistent inflation has eased.
Perhaps the highlight of the meeting was the 'dot plot', which charts the expected rate path of members who participated at the meeting. The dot plot indicated that most members expect two more rate cuts before the end of the year, which means the Fed is in a very dovish mood.

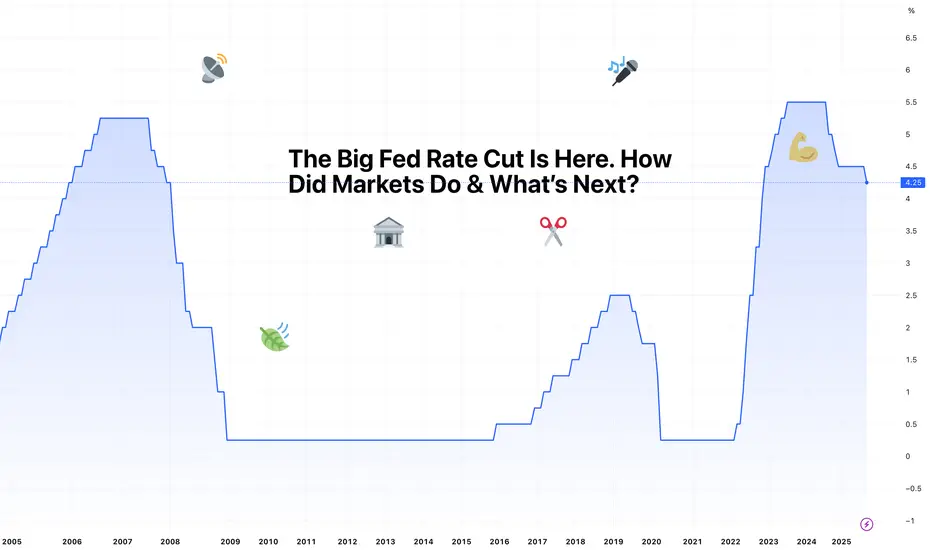
The Big Fed Rate Cut Is Here. How Did Markets Do & What’s Next?“ Best we can do is 25bps ,” officials, probably, when they gathered to lower the federal funds rate. It wasn’t the 50 basis points some of you had expected. But you also didn’t expect to hear that two more trims are most likely coming by year end.
Let’s talk about that and what it means for your trading.
🎤 Powell Delivers
The Federal Reserve finally trimmed rates for the first time in nine months, cutting the federal-funds rate by 25 basis points to 4%–4.25%. This was hardly a surprise.
Markets had already fully priced in a quarter-point move. But the real twist was the Fed boss hinting at two more cuts this year. With just two FOMC meetings on the calendar, it’s pretty clear: unless something changes dramatically, traders should expect a cut at both.
The decision wasn’t unanimous. Newly minted, Trump-appointed Fed governor Stephen Miran wanted to go big or go home with a 50bps slash. Powell, though, balanced his message by saying risks to the labor market had grown while inflation was still running at 2.9% (way above target).
What does this mean? The Fed’s dual mandate of price stability and full employment is officially leaning toward protecting jobs at the risk of flaring up inflation.
💵 Dollar Takes a Dive
The immediate reaction was classic. A weaker dollar is the natural byproduct of lower rates, and the greenback obliged by sliding against major peers.
The FX:EURUSD pushed toward $1.19, its highest in four years, while the FX:GBPUSD tested $1.37 and the FX:USDJPY sank below ¥146.
For forex traders, this was textbook: lower yields make the dollar less attractive, especially compared to rivals with steadier or higher returns. But that was a reaction to the initial shock.
By early Thursday the dollar bounced back, because markets love to overreact before correcting, but the broader trend is still tilted bearish .
📈 Stocks: Buy the Rumor, Sell the News
Stocks were less enthusiastic. The S&P 500 SP:SPX hovered near flat, the Nasdaq Composite NASDAQ:IXIC slipped 0.3% for a second straight loss, and the Dow Jones TVC:DJI managed to buck the trend with a 260-point climb.
The takeaway? Traders had already bought the rumor of rate cuts, jammed their cash into equities, so when Powell delivered the expected 25bps, it wasn’t enough to light another fire.
The bigger hope lies in those promised future cuts, which could set the stage for another push higher – especially if Big Tech earnings hold up through the third quarter. (For the record, earnings season is almost here.)
Thursday's futures contracts were showing a big jump ahead of the opening bell with Nasdaq futures up by more than 1%.
🟡 Gold Shines, Then Stumbles
Gold OANDA:XAUUSD did what gold usually does when the Fed loosens policy: it powered up. Bullion was surfing on the high point of its all-time record of $3,700, before sliding back under $3,640.
What’s the logic behind rising gold prices and a falling dollar? In a low-yield environment, non-yielding assets like gold look more attractive, and a weaker dollar only sweetens the deal for overseas buyers.
Still, this week’s whipsaw reminded everyone that gold is no straight line up – momentum is there, but so are the bears guarding resistance.
🟠 Bitcoin Shrugs
Crypto was more muted. Bitcoin BITSTAMP:BTCUSD slipped 1.2% after the cut, dipping toward $115,000, only to bounce back above $116,000 the next morning.
For the orange coin, the Fed story is just background noise. Institutional inflows and ETF demand remain the key drivers, and traders are still gauging whether crypto wants to behave like a risk asset or play its “digital gold” role.
Still, the OG coin remains off its $124,000 record from mid-August , the market seems caught between consolidation and correction.
⚖️ The Balancing Act
The Fed’s challenge is clear: unemployment is rising, job gains are slowing , and payrolls have been revised lower for months.
At the same time, inflation has crept back up, with core prices still well above target. Cutting too much risks reigniting price pressures; cutting too little risks a labor-market slide that could snowball into recession.
Powell chose the middle ground – a modest 25bps – and teased with two more to calm investor nerves.
👀 What’s Next?
Markets now have a new playbook: watch every jobs report ECONOMICS:USNFP , every CPI ECONOMICS:USCPI release, and every Powell presser between now and December.
If job creation continues to cool, the Fed will likely follow through with the cuts. If inflation heats up, those cuts may get scaled back. And if both trends stall, expect chop – the dreaded sideways trade that tests everyone’s patience.
What can you do in this situation? One message is to stay nimble. The dollar’s longer-term weakness is reshuffling the forex space, gold is on the cusp of a breakout, and stocks remain in record territory. And crypto is doing its usual unpredictable mood swinging.
In a nutshell, Powell gave markets a gift in the form of liquidity, but as history reminds us, the Fed giveth and the Fed taketh away.
👉 Off to you : What’s your strategy in this market? Now that you have the cut (and two more likely on the way), are you bullish or bearish? Share your thoughts in the comments!
Gold faces pressure with data-dependent stanceGold prices increased after the Fed cut the rate by 0.25%, bringing the Fed fund rate to 4.0 - 4.25%. The dot plot showed two more cuts in 2025 by 0.5% and only a 0.25% cut in 2026 and 2027 each.
The Fed also indicated the inflation risk and forecast inflation to be up to 3.1% by the end of this year. It stressed that the labor market is weakening now amid an elevated unemployment rate that has remained low.
However, the gold price fell after Fed Chair Powell's speech, which emphasized a data-dependent stance and raised expectations of more aggressive action from the Fed.
Markets need to observe the next labor data to evaluate how bad the labor market is, which could affect concerns over the US economy's stagflation, which could support the gold price in the medium term.
Technically, the XAUUSD broke down under the EMA21 but remains above the EMA78, indicating that the bullish momentum is weakening. If the XAUUSD closes under 3660, it may prompt a retest of the next support at 3600.
By Van Ha Trinh, Financial Market Strategist at Exness

HYPE has successfully broken out of the red resistance zone 📊 GETTEX:HYPE Market Update
GETTEX:HYPE has successfully broken out of the red resistance zone 🔴✅
👉 If price keeps pushing upward, the next target is the blue line level 🎯📈
⚡ Breakout confirms bullish momentum — manage your trades and watch for continuation.

EGLD has formed a bullish double bottom📊 CRYPTOCAP:EGLD Market Update
CRYPTOCAP:EGLD has formed a bullish double bottom 📈
👉 If it breaks out the red resistance zone 🔴, the first target will be the green line level 🎯

WLD Market Update📊 MIL:WLD Market Update
After an uptrend, MIL:WLD is now retracing 📉
👉 If the price keeps dropping to the green support zone 🟢, it could bounce up from there.
This level is where buyers previously accumulated and may push price up again with confirmation ✅
⚡ Be patient — wait for confirmation before entering.

BITCOIN UPDATEHello friends
According to the open cycle, we can say that our trend is bullish and is in a channel, but a resistance has stopped it, which it has hit twice. Now we have to see if this resistance will finally be broken or if the price will continue to suffer below this resistance.
If the price breaks the resistance, it will move to the specified targets.
Trade safely with us.

Bank of Canada lowers rates, Canadian dollar edges upwardsThe Canadian dollar has posted small gains on Wednesday. In the North American session, USD/CAD is trading at 1.3762, up 0.17% on the day.
There were no surprises from the Bank of Canada, which lowered its policy rate by a quarter-point to 2.5%, its lowest level since July 2022. This was the first time the Bank of Canada lowered rates since March, as it was forced to respond to signs of weakness in the economy and lower inflation.
The rate statement said that a rate cut was justified, given that the economy had weakened and there was less upside risk to inflation. The US tariffs were expected to have a further dampening effect on economic activity.
The statement made three references to the uncertainty of the economic outlook, which has required the BoC to act cautiously. At a follow-up press conference, Governor Macklem defended the rate cut due to a weaker labor market and less upside pressure on underlying inflation.
What was missing from the rate statement and press conference was any forward guidance about future rate cuts, as the central bank doesn't want to be pushed into any corners with regard to future decisions. If inflation risks continue to fade, the BoC could deliver one or even two rate cuts before the end of the year.
The Federal Reserve is virtually certain to lower rates at today's meeting, barring a monumental surprise. The expected rate cut would be the Fed's first since December 2024. With the rate decision virtually a given, investors will be looking for some clues as to whether the Fed is looking at further rates cuts before the end of the year.
USD/CAD is testing resistance at 1.3752. Above, there is resistance at 1.3770
There is support at 1.3721 and 1.3703

Compression Below Resistance: Prepare for Post-FOMC BTC Plays__________________________________________________________________________________
Market Overview
__________________________________________________________________________________
Bitcoin is trapped in a volatility compression zone, trading just below key resistance and awaiting the high-stakes FOMC catalyst. The broader context shows contained flows and limited directional momentum: the market is on standby.
Momentum: Short-term momentum is neutral to slightly bearish 📉, with price tightly range-bound and no strong buying impulse. All eyes on the macro trigger.
Key levels:
— Resistances (clustered):
• 116,800–116,814 (240 Pivot High, dominant multi-TF resistance)
• 124,277 (ATH/Daily Pivot High)
— Supports :
• 114,800–114,809 (240 Pivot, primary short-term support)
• 113,421 (720 Pivot)
• 111,965 (Weekly Pivot High)
Volumes: Volumes are normal across all timeframes, with only a small bump on short-term down moves (30m/15m) — no signs of extreme positioning.
Multi-timeframe signals: Medium-term trend remains bullish (MTFTI "Strong Up" on daily/12H), but short-term timeframes (1H–4H–12H) show downward momentum and lack of a decisive volume trigger.
Risk On / Risk Off Indicator context: Neutral to sell bias , confirming the absence of strong risk-on flows and supporting a cautious tactical approach.
__________________________________________________________________________________
Trading Playbook
__________________________________________________________________________________
The dominant tone is cautious sideways compression — only act on clear breakout or rejection signals at range extremes.
Global bias: Short-term neutral to bearish ; invalidated by a clear reclaim and hold above 116,814.
Opportunities:
• Buy “breakout” only if price clearly breaks and sustains >116,814 with strong volume (first target 117,300, then 118,400+); invalidate below 114,809.
• Sell on firm break and hold <114,809, adding size if volume rises, targeting 114,000–113,000; invalidate on swift rebound >115,700.
Risk zones / invalidations:
• Reclaim and hold >116,814 (with volume) invalidates short bias.
• Breakdown and hold <114,809 across several TFs activates downside.
Macro catalysts (Twitter, Perplexity, news):
• Imminent FOMC decision — options market, volatility compression, and max defensive positioning are the primary drivers.
• ETF flows cooling, Bitcoin dominance declining, risk rotations likely post-FOMC — no strong risk-on evidence yet.
• UK/EU inflation and dovish central banks are background noise, not immediate BTC movers.
Action plan:
• on breakout or clean rejection of technical pivots (116,814/114,809).
• below indicated risk line.
• 117,300, 118,400+ in long; 114,000, 113,000 in short.
• R/R ~1.8–2; max initial exposure 12.5%, only scale in with confirmed multi-TF momentum.
__________________________________________________________________________________
Multi-Timeframe Insights
__________________________________________________________________________________
All timeframes show a tense coil: no timeframe provides a clear trend for now, reinforcing a "wait and see" approach.
1D/12H: Medium-term uptrend filter persists (MTFTI “Strong Up”), but near-term momentum repeatedly stalls below 116,814–116,800, with no volume breakthrough.
6H/4H/2H/1H: Tightly coiled range, anchored at 114,809; loss would open up liquidity tests down to 113,421–114,000.
30m/15m: Volume picks up on short-term declines; only a fleeting “risk-on” flash on 15m (no follow-through to higher TFs).
Major divergences: Isolated 6H “Strong Buy” on equity isn’t confirmed at the market level, making any bounce fragile. 15m “risk-on” flashes lack multi-TF confirmation.
Key invalidation/pivot levels are well aligned across TFs — critical for reactivity when the move comes.
__________________________________________________________________________________
Macro & On-Chain Drivers
__________________________________________________________________________________
Macro and on-chain forces both encourage patience, with the FOMC outcome set to trigger the next major move.
Macro events:
• in focus, strong rate cut expectations and options market tension dominate — clear primary driver.
• BoC goes dovish, UK/EU inflation tensions, but no direct “risk-on” signals across global macro.
• ETF flows tepid, specific post-FOMC asset rotation will be key.
Bitcoin analysis:
• Bitcoin consolidates ~6.8% below ATH, inside technical “cloud” — price activity is all about risk management (options, ETF).
• On-chain support ~110k–114k solid, resistance 115.8k–116.8k, tightly aligned with technical levels.
On-chain data:
• ETF inflows dormant, derivatives lead price action, no clear sign of euphoria or capitulation; on-chain support >108k remains robust.
• Overall attitude is defensive, “wait for the catalyst” mode.
Expected impact:
• The FOMC’s reaction will drive the technical breakout or breakdown; only a clear confirmation will unlock decisive follow-through beyond the current coil.
__________________________________________________________________________________
Key Takeaways
__________________________________________________________________________________
Bitcoin remains trapped in a compression phase under key resistance, on high alert going into the FOMC.
The overall trend is short-term neutral to bearish, with all bullish setups hinged on a confirmed pivot breakout above 116,814. The highest-conviction play is to let the FOMC be the trigger: position with the move, not before. Macro dominance means no reason to anticipate a risk-on rotation until confirmation.
Keep your edge: wait for multi-TF signals and volume confluence, and manage exposure tightly — false breakouts and volatility traps are the enemy heading into this macro event!
Bitcoin Trade of the Week: Liquidity Rules the MarketOne of the most decisive factors for markets right now is the expansion of liquidity. The growth of global M2 remains evident, particularly in China, where the economy faces a deflationary backdrop that forces authorities to maintain – and even expand – both monetary and fiscal stimulus. Ultimately, these flows permeate global financial markets and, as I’ve explained on several occasions, liquidity is the fuel that drives asset prices.
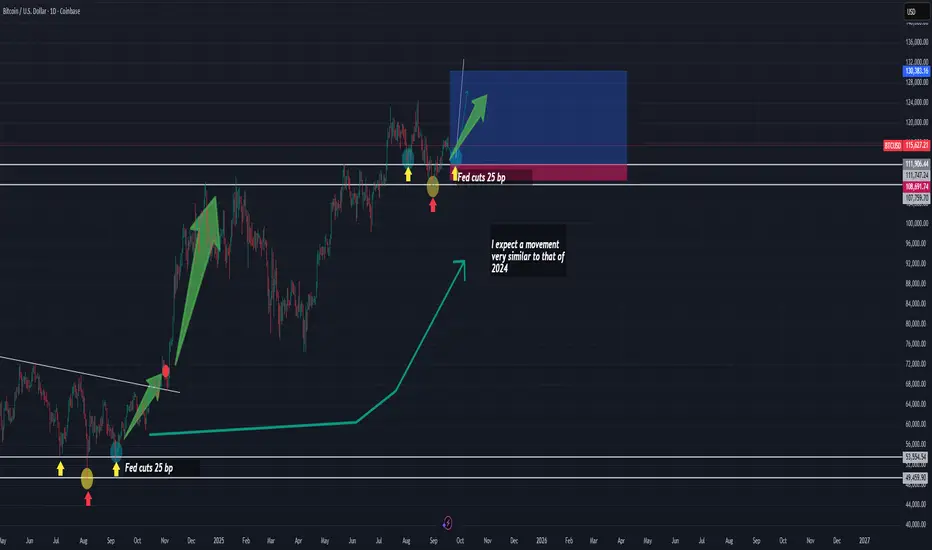
A Parallel with 2024
What we are observing today shows remarkable similarities with what happened in 2024. Back then, the start of Federal Reserve rate cuts marked a turning point. Even a moderate 25-basis-point cut triggered a rebound that coincided with a technical consolidation phase in Bitcoin, shaped as a descending channel.
Later, in November 2024, when the Fed accelerated the move with a 50-basis-point cut, the result was a much more aggressive bullish impulse.
Today, we find ourselves in an environment with rising probabilities of further cuts in upcoming Fed meetings, which could once again act as a catalyst.
Correlation Context with the Nasdaq 100
Meanwhile, the Nasdaq 100 is printing all-time highs, reflecting the strong risk appetite in tech assets. Bitcoin, in contrast, remains slightly behind its own highs. This divergence can be interpreted as a window of opportunity: if additional liquidity is confirmed through another rate cut, the momentum could spill over into Bitcoin and provide the strength needed to form a technical reversal structure—very similar to the inverted Head and Shoulders (H&S) pattern observed in 2024.
Trading Strategy
Entry Zone: 111,906.44
Stop Loss (SL): 108,607.83
Take Profit (TP): 130,383.16
EUR/USD: Bullish Breakout to 1.20 Amid Fed Rate Cut Hype EUR/USD: Bullish Breakout to 1.20 Amid Fed Rate Cut Hype and #Fed Trends Buzz? 1.1920 Target in Sight?
EUR/USD is trading at 1.1878 today, up 0.3% amid surging to a fresh four-year high as markets brace for the Fed's interest rate decision later, with expectations of a 50bps cut to 4.00-4.25% fueling dollar weakness. This comes as South Africa's Treasury eyes new Eurobonds post-$2B redemption, potentially bolstering Euro demand amid broader EM inflows.
Just as #Fed racks up 12K mentions on X with rate cut speculation exploding, and #business trends highlight global bond stability (e.g., SA's move), EUR/USD's rally ties into ECB hawkishness versus Fed easing—positioning it as a high-conviction pair for September volatility. But with RSI overbought, is EUR/USD poised for a breakout to 1.20, or will a hawkish Fed surprise trigger a pullback? Let's break down the fundamentals, SWOT, charts, and setups for September 17, 2025.
Fundamental Analysis
EUR/USD's strength stems from diverging monetary policies, with the ECB holding rates steady at 3.50% while Fed cut bets hit 65% for 50bps today, pressuring the dollar index to 98.50 lows. Analysts forecast a potential climb to 1.1920 if cuts confirm, with 2025 averages eyed at 1.15 amid Eurozone recovery data like 0.3% Q2 GDP growth. With #Fed trends going viral on X, the pair's sensitivity to dot plot signals undervalues its upside if projections show three more cuts by year-end; however, sticky US inflation (core PCE at 2.6%) could cap gains if the Fed pauses.
- **Positive:**
- Fed easing expectations weaken USD, amplified by #Fed hype and SA Eurobond plans signaling global Euro appetite.
- Eurozone resilience with PMI at 51.2 supports hawkish ECB, projecting 1.5% 2025 GDP growth versus US slowdown risks.
- Broader trends in #business (e.g., EM bond inflows) position EUR/USD for 2%+ monthly gains if cuts deliver.
- **Negative:**
- Overbought conditions risk correction to 1.1762 if Fed signals fewer cuts, clashing with #Fed optimism.
- Geopolitical tensions and US election uncertainty could strengthen USD as safe-haven if volatility spikes.
SWOT Analysis
**Strengths:** Policy divergence favors Euro with ECB's steady rates versus Fed cuts, amplified by #Fed relevance in weakening USD sentiment.
**Weaknesses:** High sensitivity to US data; overbought momentum vulnerable in a #business-shifting market post-Fed.
**Opportunities:** SA Eurobond tap boosts Euro liquidity; #Fed cut confirmation could narrow discount, with undervalued upside at current levels amid 1.5% projected 2025 appreciation.
**Threats:** Hawkish Fed pivot eroding gains; competition from yen or pound if global easing synchronizes amid viral #Fed discussions.
Technical Analysis
On the daily chart, EUR/USD shows a bullish ascending channel breakout to four-year highs at 1.1878, with volume surging on Fed anticipation and mirroring #Fed volatility. The weekly confirms an inverse head-and-shoulders from summer lows, now extending higher. Current price: 1.1878, with VWAP at 1.1850 as intraday pivot.
Key indicators:
- **RSI (14-day):** At 72, overbought but holding bullish—potential bounce signal amid #Fed surge. 📈
- **MACD:** Positive histogram expanding, crossover intact for upside momentum.
- **Moving Averages:** Price above 21-day EMA (1.1750) and 50-day SMA (1.1650), golden cross supporting bull trend.
Support/Resistance: Key support at 1.1810 (recent low), resistance at 1.1920 (Fib target) and 1.2000 (psychological). Patterns/Momentum: Channel extension targets 1.1920; fueled by #Fed momentum. 🟢 Bullish signals: Higher highs on volume. 🔴 Bearish risks: RSI divergence could prompt drop to 1.1690.
Scenarios and Risk Management
- **Bullish Scenario:** Break above 1.1920 on dovish Fed targets 1.2000; go long on pullbacks to 1.1810, especially if #Fed goes mainstream with cuts.
- **Bearish Scenario:** Drop below 1.1810 eyes 1.1762; watch for death cross amid #Fed fade if hikes signal.
- **Neutral/Goldilocks:** Range-bound 1.1810–1.1920 if dot plot mixed and #Fed cools.
Risk Tips: Use stops at 1.1790. Risk 1-2% per trade. Diversify to avoid correlation traps with #Fed-linked pairs like USD/JPY.
Conclusion/Outlook
Overall, a bullish bias if EUR/USD holds 1.1810, supercharged by today's #Fed and #business trends, with 1%+ upside to 1.20 on rate cut confirmation. But watch the Fed decision for confirmation—this fits September's policy divergence theme, but SA Eurobonds add supportive Euro tailwinds. What’s your take? Bullish on EUR/USD amid #Fed cuts or hedging the dip? Share in the comments!

BTC – Between Structure and Supply!BTC has been trading inside a clean ascending channel 📈, respecting both support and resistance.
After breaking above the $113,000 structure zone, price pushed higher but is now approaching a potential retest area.
🟠 Structure zone ($113K – $114K): Could act as support on a pullback.
🟢 Channel support: Aligns perfectly with structure for confluence.
🔵 Supply zone ($122K – $124K): Next major resistance where sellers may step in.
As long as BTC holds above structure, bulls 🐂 remain in control, with the next upside target sitting around the supply zone.
Patience ⏳ is key — waiting for a clean retest could set up the next continuation trade.
⚠️ Disclaimer: This is not financial advice. Always do your own research and manage risk properly.
📚 Stick to your trading plan regarding entry, risk, and management.
Good luck!
All Strategies Are Good; If Managed Properly!
~Richard Nasr

USDJPY Deat Cat Bounce at play after Jackson Hole remarks?In this video, we analyse the sharp move in the USDJPY following crucial speeches from Fed Chair Jerome Powell and BOJ Governor Kazuo Ueda at the Jackson Hole Symposium. Powell signalled the possibility of a September rate hike, highlighting ongoing weakness in the US labour market. Meanwhile, Ueda emphasised Japan's strong job market, supported by immigrant labour, which is driving wage growth and sustaining inflationary pressures.
Ueda’s Hawkish Stance:
Ueda maintained a hawkish tone, noting that wage hikes in larger Japanese companies are now spreading to smaller firms, strengthening expectations for continued inflation. This commentary increased the likelihood of a BOJ rate hike, giving the yen additional support.
Market Reaction:
Prior to the Symposium, traders were positioned for a potential rate cut by year-end. However, after Ueda’s remarks, futures market pricing suggests the odds of an October rate cut are now evenly split at 50-50.
Technicals:
Open triangle completion may trigger further downside after the post-JHS drop. Current rally to the upside could be a relief rally, part of a potential Dead Cat Bounce (DCB).
This content is not directed to residents of the EU or UK. Any opinions, news, research, analyses, prices or other information contained on this website is provided as general market commentary and does not constitute investment advice. ThinkMarkets will not accept liability for any loss or damage including, without limitation, to any loss of profit which may arise directly or indirectly from use of or reliance on such information.

EUR/USD Could Skyrocket if They Cut 50bps!The market is certain that the Federal Reserve will cut interest rates during tomorrow's meeting, with a small chance of a 50 bps reduction priced in.
Two Fed policymakers, Chris Waller and Michelle Bowman , may be thinking of this FOMC meeting as an audition to take over the Fed Chair from Jerome Powell, which means they might push for a 50 bps cut tomorrow to impress President Trump (who thinks interest rates are 300 basis points too high at the moment).
Additionally, Trump stooge Stephen Mirin was added to the voting Fed board yesterday, just in time to push for an outsized interest rate cut.
This speculation is likely contributing to the recent rise in EUR/USD. Today’s movement has taken the pair above the prior yearly high at 1.1829, which was set in late July.
This breakout signals the potential continuation of the bullish trend, with the next possible resistance coming into focus at the double swing highs from August 2021, around 1.1900.

Euro hits four-year high on strong German investor confidence, UThe euro has posted sharp gains on Thursday. In the North American session, EUR/USD is trading at 1.1867, up 0.90% on the day. The euro has not been at these levels since September 2021.
German ZEW Economic Sentiment rose modestly in September to 37.3, up from 34.7 in August. This blew past the market estimate of 26.3 and the euro has responded with sharp gains. The survey of financial experts indicates cautious optimism, with the outlook for the export sector showing promise after a prolonged decline.
At the same time, the index monitoring the current economic situation worsened, declining to -76.4 from 68.6, below the market estimate of -75.0. It has been a bumpy road for Germany, which is the only G7 economy that has not posted growth in the past two years. Once the locomotive that drove the eurozone economy, Germany finds itself the laggard of the bloc.
US retail sales for August were stronger than expected at 0.6% m/m. This was unchanged from an upwardly revised 0.6% in July and easily beat the market estimate of 0.2%. Retail sales increased across most sub-categories, as consumers showed they were in a spending mood despite a weaker job market and higher prices due to President Trump's tariffs.
Annualized, retail sales jumped 5.0%, up from an upwardly revised 4.1% in August and above the forecast of 3.2%. At the same time, consumer sentiment has been softening, with consumers concerned about the impact of the tariffs.
All eyes are on the Federal Reserve, which is widely expected to lower interest rates on Wednesday for the first time since December 2024. The money markets have fully priced in a rate cut, with a quarter-point reduction practically a given. Investors will be looking for clues about the possiblity of additional rate cuts before the end of the year.

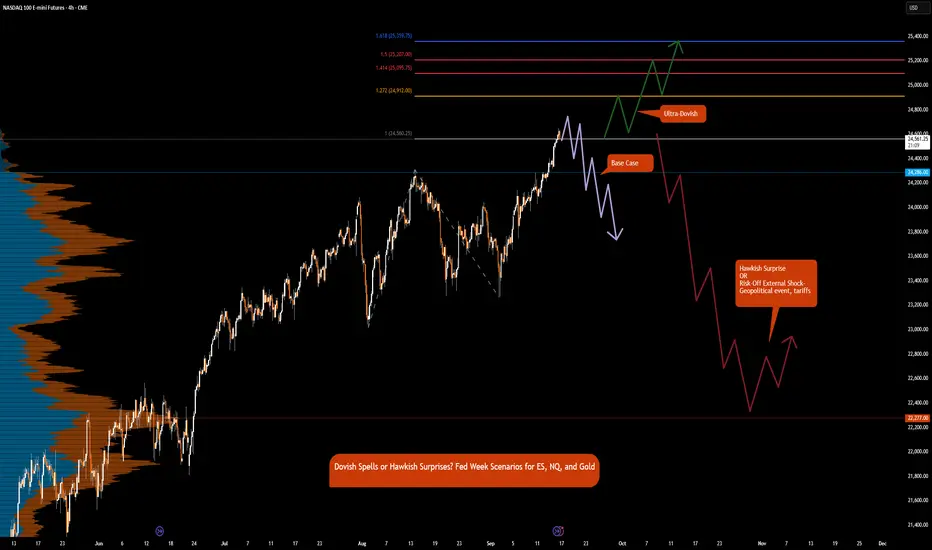
Dovish Spells or Hawkish Surprises? FOMC Prep for ES, NQ, GCLet’s start with the biggest event this week. Unless, of course, some unexpected headline swoops in and steals the spotlight — because markets love a good plot twist.
Emotions are running high, and volatility is flying around like confetti at a surprise party nobody asked for. But don’t worry, Chair Powell might just play the role of the calm voice in the chaos.
Markets are pricing in a 25 bps rate cut by the Fed this week. Interestingly, the future path of rate cut expectations has been in the doldrums. Is it a bird or a plane? No, it’s Superman. Likewise here, is it 1 cut or 2 cuts? No, it’s 3 cuts priced at this moment until the end of 2025.
Excuse the humor, but what fun is it if you cannot entertain yourself while analyzing the complexities of markets day in and day out. Execution is boring; risk management is much like dementors sucking out life force when risk is not respected. And analyzing and preparation is where the creativity and fun is.
And as Kurt Angle would say, it is “ True ”.
Index futures including ES futures and NQ futures have all climbed steadily higher since September 2 low. Markets are turning higher in anticipation of a new bull run.
Gold futures are rallying, currently trading above $3700. Since the Jackson Hole dovish pivot, gold has not looked back and has rocketed higher above major resistance.
Our focus is on the Fed meeting. All eyes will be on the forward guidance; risks to inflation, risks for the labor market and FED’s SEP (Summary of Economic Projections). This also includes GDP forecasts and the most anticipated Dot Plot.
Which of the two mandates will the Fed prioritize, labor market weakness or sticky inflation? The interesting thing to note is that despite sticky inflation, markets are anticipating 3 cuts of 25 bps for each of the meetings this year.
Thus far, as we have previously mentioned, the Fed will likely be moving away from their 2% inflation target to an average inflation target in the range of 2% to 3%.
This also implies that real rates i.e., nominal less inflation are going to fall sharply lower.
Given this, we anticipate gold to continue higher as the US Dollar's purchasing power erodes away, with mounting debt, higher inflation and falling real yields.
The real question we should be asking is:
What if the meeting outcome is hawkish with the Fed delivering just 1 cut in the September meeting and staying on hold for the remainder of the year?
What other risks are there that could pull stocks and indexes lower? And bonds higher?
Tariffs at this point seem like an old talk unless something reinvigorates and puts them on the front and center of market worries.
Based on these thoughts, here are our scenarios:
Base Case:
25 bps cuts and dovish guidance but iterates meeting by meeting approach.
ES & NQ:
Data dependent Fed, that is likely behind the curve and markets may translate this as Fed too slow to react to emerging risks, risks of recession goes higher. In this case, although stocks may push higher with rates coming down initially, in our view, much of this is priced in and this may be ‘sell the fact moment’.
Portfolio adjustment: Sell index futures, Buy Gold and Bonds.
Ultra-Dovish:
Fed’s dot plot confirms 2 additional rate cuts of 25 bps for Oct and Dec meeting and further 4 cuts till end of 2026 to bring terminal rate lower to 250-275.
USD weakens further, real rates sink, reinforcing gold bid.
Portfolio adjustment: Buy everything. Buy the dip.
Hawkish Surprise
Only 25 bps in September, then pause
ES & NQ:
• Sharp pullback as equities reprice for tighter liquidity.
• ES could retrace recent gains, downside risk toward 4,900–5,000 zone.
• NQ likely hit harder due to tech sensitivity to discount rate.
GC:
• Short-term correction as USD firms and yields spike.
• However, downside may be limited if market shifts focus back to debt & long-term inflation risks.
Risk-Off External Shock- Geopolitical event, tariffs
ES & NQ:
• Drop as risk sentiment sours; defensives outperform growth.
• Bonds rally, yields fall, curve steepens if Fed cut expectations accelerate.
GC:
• Strong safe-haven bid, spikes higher regardless of Fed stance.
Comment with your thoughts and let us know how you see the markets shaping up this week