LTCUSDT - Retest of the liquidity zone on a downtrendBINANCE:LTCUSDT.P is forming a local rally after breaking through resistance at 78.0. The market is bearish, but within the bullish run, the altcoin may test liquidity at 79.4 - 81.0.
Bitcoin looks weak, a rebound from resistance is forming, and Friday's daily bar indicates strong bearish dominance. A fall in the flagship currency could trigger a fall in LTC after a local rally...
LTC looks slightly stronger than the market. The target of such a rally may be hidden behind 79.4 - 81.0. In the current situation: global downtrend, low market liquidity, I see this as a manipulative hunt for liquidity before a decline.
Resistance levels: 79.4, 81.0
Support levels: 78.0, 77.0, 75.4
A retest of this resistance cluster could end in liquidity capture and a false breakout. Consolidation below 79.4 could trigger a reversal and a decline.
Best regards, R. Linda!
Fibonacci

Bitcoin Christmas Rally? $90K/More in SightBitcoin ( BINANCE:BTCUSDT ), as I previously expected , has risen to its initial target and has broken above the important level of $88,200, which is a positive sign for continued bullish momentum.
At the moment, Bitcoin is striving to break through the resistance zone($89,230-$87,720).
From an Elliott Wave perspective, it seems that Bitcoin is completing microwave B of the main wave Y.
I expect that after breaking the resistance zone($89,230-$87,720), Bitcoin could rise at least up to the significant level of $90,300, approaching the Cumulative Short Liquidation Leverage and the 50_SMA(Daily). If BTC breaks above the 50_SMA(Daily), we can anticipate even further gains for Bitcoin.
The question is: do you think Bitcoin will hold above $90,000, or will it begin to decline again?
And finally, a little note about Christmas: I hope you enjoy a wonderful holiday season with your loved ones, and let’s see how Bitcoin performs as we head into the new year!
Cumulative Long Liquidation Leverage: $86,690-$85,990
First Target: $90,161
Second Target: $90,721
Third Target: 50_SMA(Daily)
Stop Loss(SL): $86,850
Points may shift as the market evolves
💡 Please respect each other's opinions and express agreement or disagreement politely.
📌Bitcoin Analysis (BTCUSDT), 1-hour time frame.
🛑 Always set a Stop Loss(SL) for every position you open.
✅ This is just my idea; I’d love to see your thoughts too!
🔥 If you find it helpful, please BOOST this post and share it with your friends.

BNB H1 Post-FVG Sweep and Mean Reversion Toward 828📝 Description
BNB on H1 just swept its most recent FVG, triggering a short-term liquidity run. After this sweep, price is showing signs of distribution below HTF resistance, which opens the door for a mean-reversion move lower. Given the current structure, a pullback toward 828 looks like the natural next draw on liquidity.
________________________________________
📈 Signal / Analysis
Primary Bias: Bearish pullback
Short Setup (Preferred):
• Entry (Sell): 840
• Stop Loss: Above 844
• TP1: 834
• TP2: 831
• TP3: 827–828 (liquidity target)
________________________________________
🎯 ICT & SMC Notes
• Recent FVG fully swept and imbalance resolved
• Price trading below H1 supply / premium
• BSL failed to hold and weakness confirmed
• SSL resting below current range
________________________________________
🧩 Summary
After cleaning the nearby FVG, BNB looks heavy. As long as price remains capped below the swept zone, odds favor a rotation toward 828 liquidity. Shorts after confirmation make more sense than chasing upside here.
________________________________________
🌍 Fundamental Notes / Sentiment
With broader crypto still reacting to liquidity conditions and macro headlines, continuation moves are less likely without fresh catalysts. For now, technical liquidity levels remain the best guide, manage risk and scale out near targets.
________________________________________
⚠️ Risk Disclosure
Trading involves substantial risk and may result in capital loss. This analysis is for educational purposes only and does not constitute financial advice. Always apply proper risk management, predefined stop-loss levels, and disciplined position sizing aligned with your trading plan.

Gold - Upper BoundaryThe move from late October 2025 can be viewed as the start of a correction, and so far nothing has fundamentally changed - only the type of correction has been revised.
It now appears to be an expanded flat.
The upper boundary is a break above 4,571 (+5) - at that point, this scenario would be considered invalid.
Next, according to the scenario, we should see a fast downward move - wave C - either from the current level or from the high.
Potential targets if the move starts from the high:
• 3,940
• 3,769
• possibly lower
If this scenario plays out, a rebound is expected afterward, followed by continuation in the direction of the main trend.
---
Please subscribe and leave a comment.
You’ll get new information faster than anyone else.
---

Shoooort BTCyou se my plan on the chart and short Sl
I'm mostly bearish, and you see the bullish scenario.
will post when is revese time for a short time upward

Serv pivot longServ I have followed for a while and the stock appears to be basing here. This is also exactly where the golden fib is, my favorite trading strategy. I note a meaningful rise in volume and BBWP is strengthening with lots of room to run. My plan would be a swing to 14.17.

NIFTY: Key Levels to Watch for the Next Move.This is the daily timeframe chart of NIFTY.
NIFTY is trading within a well-defined structure, with higher-low (HL) support levels placed at 25,800 and 25,550.
On the lower timeframe, the index is showing a trendline breakout near 25,950, indicating short-term strength.
Based on Fibonacci retracement, the key reversal and decision zone lies between 25,900–25,950. If this support zone breaks, the next important support is positioned near 25,800.
If these support levels hold, NIFTY may continue its upward move. According to Fibonacci extension, the potential upside targets are 26,380–26,450, while 26,600 remains a major resistance, aligned with channel resistance and extension levels.
Thank You ....

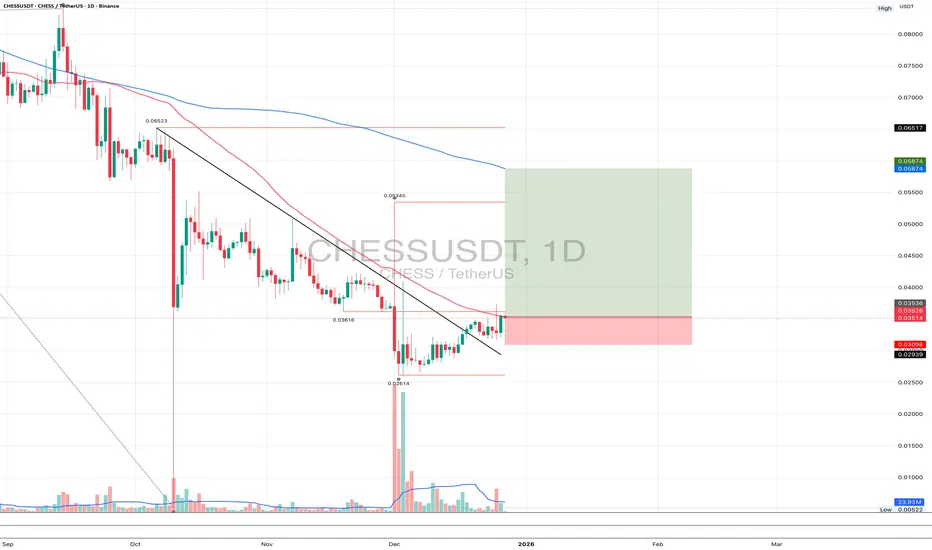
CHESSUSDT 1DShort technical update 👇
On the daily timeframe, CHESS broke its bearish structure and completed a clean retest of the breakout level. The retest held, selling pressure is fading, and higher local lows are forming. The current structure suggests a recovery phase after a prolonged decline. The base scenario is a continuation to the upside with a move toward the MA200 as the next key mid-term target.
XAUUSD: Bearish Drop to 4375?FX:XAUUSD is eyeing a bearish reversal on the 4-hour chart , with price approaching the 0.618 Fibonacci extension near an upward channel, converging with a potential entry zone that could trigger downside momentum if sellers defend against further upside. This setup suggests a pullback opportunity amid the recent rally, targeting lower support levels with strong risk-reward exceeding 1:5 .🔥
Entry between 4540–4560 for a short position. Target at 4375 . Set a stop loss at a daily close above 4570 , yielding a risk-reward ratio of more than 1:5 . Monitor for confirmation via a bearish candle close below entry with rising volume, leveraging gold's volatility near the extension.🌟
Fundamentally , gold is trading around $4,470 in late December 2025, with key US Dollar events next week potentially influencing strength through growth and sentiment indicators. On December 23 at 8:30 AM ET, the GDP Q3 Third Estimate (forecast 3.2%) could bolster USD if revised higher, signaling robust economy. Followed by Consumer Confidence at 10:00 AM ET (forecast 89), where stronger readings might support USD amid labor resilience. On December 29 at 10:00 AM ET, Pending Home Sales (Nov) could pressure USD if weaker, reflecting housing market slowdowns. Overall, positive US data surprises could strengthen the Dollar, weighing on gold prices. 💡
📝 Trade Setup
🎯 Entry (Short):
4540 – 4560
(Entry at these levels is valid with proper risk & capital management.)
🎯 Target:
• 4375
❌ Stop Loss:
• Daily close above 4570
⚖️ Risk-to-Reward:
• > 1:5
💡 Your view?
Does XAUUSD reject the 0.618 extension and slide toward 4375 — or do buyers force a breakout above the channel? 👇

USDCAD: +400 Pips Selling Opportunity!Overview🧠
The USDCAD currency pair has reversed and a potential change in trend is occurring. Confirmation is required before a sell entry can be made. The only take profit is a swing move with a potential gain of approximately 400 pips. The stop loss can be placed above the higher high. Please like and comment for more.
Team Setupsfx

Weekly Market Outlook – Nifty, BankNifty & S&P500 AnalysisNifty 50 wrapped up the week at 26042, gaining +76 points from last week’s close after hitting a high of 26236 and low of 26008. As highlighted earlier, the index continues to trade within my broader zone of 26500–25400, showing no decisive breakout yet. This week’s Gravestone Doji candle formation signals buyer exhaustion and potential weakness, with price closing near the weekly lows — never a great sign for bullish momentum.
With FII participation still muted due to holiday season and India VIX resting at a calm 9.15, volatility may stay compressed, suggesting range-bound or slow movement in the coming week unless major triggers appear.
Nifty Weekly Range Expectation: 26400–25700
A breakout beyond this range may bring sharp moves (“fireworks”) in either direction.
For upside continuation, Nifty must close above 26200 for two consecutive sessions, which could open targets toward 26277 / 26325 / 26400.
BankNifty Outlook
BankNifty ended at 59011, down just -50 points, but importantly closed near the weekly low, hinting at possible sell pressure ahead. If weakness persists, we may see tests of key supports:
Support Levels: 58700 / 58300 / 57600
Break of these zones can drag Nifty along with it.
For bulls to reclaim control, we need a sustained close above 59300, which may drive a move toward 59755 / 60000.
Expected Range: 59900–58200
Global Cue – S&P 500 Breaks Out to New All-Time Highs
S&P500 delivered a powerful move this week, breaking above the 6882 resistance and closing at an all-time high of 6930. The chart structure suggests a march toward the next Fibonacci level at 7026. However — monthly timeframe RSI is nearing the overbought zone, which historically calls for caution, trailing stop-losses, or partial profit booking for US equity investors.
Historical Reminder for Long-Term Investors
Nifty’s yearly RSI previously hit 91 only once before — Jan 2008.
Within months, the market corrected over 60% from the highs.
Today again, RSI on yearly frame is heating up. Coincidence or caution?
History doesn’t repeat, but it often rhymes.
Key levels to watch in 2026 based on price behaviour around yearly candle:
🔻 Break below December low → a deeper correction could unfold
🔼 Break above December high → Nifty may climb toward 27824/29156 before any major decline
Markets reward those who prepare – not predict.
Final Take
Nifty & BankNifty locked in range → wait for break + confirmation
Volatility low = breakout moves may be strong when they come
S&P500 bullish but nearing overbought territory
Keep risk management tight, trail profits & prepare for both outcomes
Is history about to repeat?
We’ll know soon — until then, stay alert, stay hedged, and stay disciplined.

NIFTY Analysis 29th Dec '25: IntraSwing Spot levelsCompare GIFTNIFTY levels While taking Trade Decision
💥Level Interpretation / description:
L#1: If the candle crossed & stays above the “Buy Gen”, it is treated / considered as Bullish bias.
L#2: Possibility / Probability of REVERSAL near RLB#1 & UBTgt
L#3: If the candle stays above “Sell Gen” but below “Buy Gen”, it is treated / considered as Sidewise. Aggressive Traders can take Long position near “Sell Gen” either retesting or crossed from Below & vice-versa i.e. can take Short position near “Buy Gen” either retesting or crossed downward from Above.
L#4: If the candle crossed & stays below the “Sell Gen”, it is treated / considered a Bearish bias.
L#5: Possibility / Probability of REVERSAL near RLS#1 & USTgt
HZB (Buy side) & HZS (Sell side) => Hurdle Zone,
*** Specialty of “HZB#1, HZB#2 HZS#1 & HZS#2” is Sidewise (behaviour in Nature)
Rest Plotted and Mentioned on Chart
Color code Used:
Green =. Positive bias.
Red =. Negative bias.
RED in Between Green means Trend Finder / Momentum Change
/ CYCLE Change and Vice Versa.
Notice One thing: HOW LEVELS are Working.
Use any Momentum Indicator / Oscillator or as you "USED to" to Take entry.
⚠️ DISCLAIMER:
The information, views, and ideas shared here are purely for educational and informational purposes only. They are not intended as investment advice or a recommendation to buy, sell, or hold any financial instruments. I am not a SEBI-registered financial adviser.
Trading and investing in the stock market involves risk, and you should do your own research and analysis. You are solely responsible for any decisions made based on this research.
"As HARD EARNED MONEY IS YOUR's, So DECISION SHOULD HAVE TO BE YOUR's".
Do comment if Helpful .
Do Comment for In depth Analysis.
❇️ Follow notification about periodical View

BTCUSDThis BTCUSD chart highlights a higher-timeframe supply zone, defined by a strong bearish displacement and multiple prior rejections, indicating the presence of active sell-side interest at these levels. The zone aligns with a previous distribution area, where price failed to sustain acceptance above value before expanding lower.
From a market structure perspective, price remains below the supply zone, suggesting that bullish attempts are currently corrective rather than impulsive. The most recent upside move appears to be a retracement into premium, rather than a trend reversal, which keeps the broader bearish narrative intact unless the zone is decisively reclaimed.
Confluences supporting the zone:
Previous high-volume rejection from the same price region, suggesting institutional participation
Unmitigated supply left behind after an impulsive downside move
Premium pricing relative to the recent range, favoring sell-side risk/reward
Range high alignment with prior failed breakout attempts
HTF structure bias remains intact unless acceptance occurs above the zone
The highlighted paths illustrate possible reaction scenarios, not predictions. Execution should always be based on lower-timeframe confirmation, such as rejection wicks, displacement, or a shift in internal structure.
This analysis is shared strictly for educational and technical insight, emphasizing structure, liquidity, and supply–demand mechanics rather than directional certainty. Risk management and personal trade criteria should always take priority.

ETHUSD Sell Pressure Current Price Goes up and hits the Sell Order Block for a Bearish and also have a Resistance Point, after these Done Price Come Back to Sell at Consolidation 2935.66 to 2917.91 point . When Price will Close the 2916.61 Price Then Price Should be Clear and Quickly Goes Down at 2773.21 Near About. Now Lets see what they Does.

NIFTY Weekly Analysis 29/12/''25 - 02/01/'26: Swing Spot levelsNIFTY Weekly Analysis 29/12/''25 - 02/01/'26
💥Level Interpretation / description:
L#1: If the candle crossed & stays above the “Buy Gen”, it is treated / considered as Bullish bias.
L#2: Possibility / Probability of REVERSAL near RLB#1 & UBTgt
L#3: If the candle stays above “Sell Gen” but below “Buy Gen”, it is treated / considered as Sidewise. Aggressive Traders can take Long position near “Sell Gen” either retesting or crossed from Below & vice-versa i.e. can take Short position near “Buy Gen” either retesting or crossed downward from Above.
L#4: If the candle crossed & stays below the “Sell Gen”, it is treated / considered a Bearish bias.
L#5: Possibility / Probability of REVERSAL near RLS#1 & USTgt
HZB (Buy side) & HZS (Sell side) => Hurdle Zone,
*** Specialty of “HZB#1, HZB#2 HZS#1 & HZS#2” is Sidewise (behaviour in Nature)
Rest Plotted and Mentioned on Chart
Color code Used:
Green =. Positive bias.
Red =. Negative bias.
RED in Between Green means Trend Finder / Momentum Change
/ CYCLE Change and Vice Versa.
Notice One thing: HOW LEVELS are Working.
Use any Momentum Indicator / Oscillator or as you "USED to" to Take entry.
⚠️ DISCLAIMER:
The information, views, and ideas shared here are purely for educational and informational purposes only. They are not intended as investment advice or a recommendation to buy, sell, or hold any financial instruments. I am not a SEBI-registered financial adviser.
Trading and investing in the stock market involves risk, and you should do your own research and analysis. You are solely responsible for any decisions made based on this research.
"As HARD EARNED MONEY IS YOUR's, So DECISION SHOULD HAVE TO BE YOUR's".
Do comment if Helpful .
Do Comment for In depth Analysis.
❇️ Follow notification about periodical View

Gold Struggling at Higher Volume Area For Bullish SideFriday Night Gold Closed at High Volume Area as per (Fixed Volume Range) Price Hit the Order Block Point at 4510.000 and its Come Back to Up Side, also 3rd Conformation is Touch the trend-Line and Most important is Normal Volume is Goes to Down-Side its Mean Price Move to Buying Side ,But One More Conformation Need Price Closing required Above at 4535.033 Area. Now lets see What Gold does.

Silver.. Enough Momentum Left for Upward MoveSilver has given good returns over the past One year. over and above 100%+. Is there any fuel left for upward move and chances of reaching 100$.
Further analyzing on Monthly Chart, momentum is very bullish. Though short term correction is expected (my personal view), overall momentum is bullish.
Looking at the consolidation of Few Fibonacci ratios, and based on previous experiences, expecting silver futures to reach one of the above levels highlighted and rally beyond.
This is completely my personal point of view.

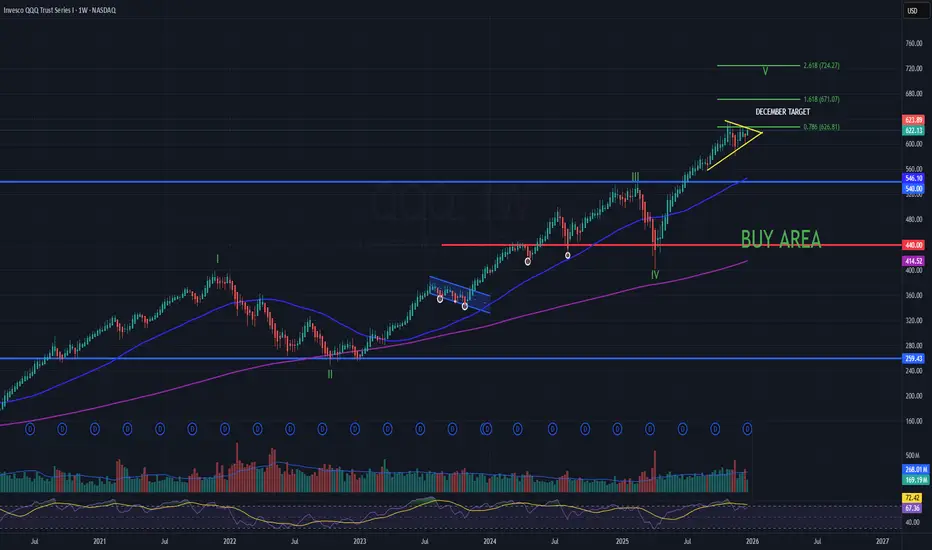
QQQ – Weekly Structure OverviewThesis
Weekly uptrend intact. Price is extended; next decision is breakout vs. consolidation near highs. We are next to the end of the long term bull trend.
Context
200WMA is rising and aligns with major support near 440 (long-term mean reversion / reset zone).
What I see
- Prior stress phases reverted toward the 200WMA (2022 and early 2025).
- Current structure is a rising consolidation near highs (compression).
What matters now
- Continuation remains favored while price holds above key trend support ($600 on chart).
- A clean weekly expansion above the consolidation keeps upside structure intact.
Buy / Accumulation zone
- Long-term accumulation zone: $440 area (200WMA + horizontal support confluence).
Targets
- Extension reference: 2.618 Fib $720s (measured upside within current structure).
INET watch for support before 2Jan26 Right IssueINET 28DEC25 before right issue
1. Regresi support at 725
2. Support reguler 650-665
www.tradingview.com

Tesla - Move BeginsThe move is starting according to the previously outlined plan.
The local reversal has likely occurred, and one of the sub-waves of C , specifically a downward impulsive wave, is being formed.
Let’s mark the initial targets:
473 -> 466 -> 458
The speed and strength of this downward move will provide insight into the overall market picture.
---
Please subscribe and leave a comment.
You’ll get new information faster than anyone else.
---

TCS | 4 hr chart | Almost gap fill ?TCS | 4 hr chart | Almost gap fill ?.
Continue to grind around closer to gap fill / break down retest zone combined with short term extension, what happens at next pullback ?

Silver - Next StopSilver has moved sharply higher, and the explosive upward trend is still ongoing.
The move from March to August 2020 can be considered wave 1 and the start of this bullish phase.
The question now is: where will we stop and potentially reverse? In other words, where might the next corrective phase begin.
Fibonacci levels drawn from the first wave and from the last significant corrective wave point to several key areas:
77 - the nearest level, which we have already passed without stopping
89 - the next most probable target
96 - applicable only to the current wave
Time will tell where the next stop occurs.
---
Please subscribe and leave a comment.
You’ll get new information faster than anyone else.
---

PLTR: potential mid-term top formation Price have reached key mid-term resistance zone outlined in May idea:
As long as price remains below the Nov 3 highs, I’ll be operating under the main assumption that the mid-term top is in, anticipating more downside in the coming weeks and months.
A 1–3 day bounce to potentially close the gap could provide a good delayed-reaction short setup.
Chart:
Macro support ideal for this correction: 120–85.
Macro view:
