AAOI on WatchLooking for a breakout above previous high.
Why:
Selling was high in the past (June 12th) at this point. This time, the price was able to say in this zone.
Target is 1.618 fib level.
Fibonacci

AMD: Mapping Cycle via 3 FibsWaveform
High To High cycle Fib interconnection
Extension to the right matches recent bottom.
Expanding and anchoring the structure on L2L cycle
Levels around 3 intersections expose highest probability density.

ELLIOTT WAVE XAUUUSD H4 update
EW Trade Set Up H4
minuette wave (iv) running?
The upside move from 3120a of 150525 to 3439a of 130625 does not seem a motive (sure not impulsive/leading diagonal maybe) wave , so a sideways (flat) correction of the minuette wave (iv) is more likely
key levels (area)
3462
3402
3317 POC
3270
3238

ISSC on WatchWhy:
Bounce off demand zone
High volume breakout, low volume on the way down.
MACD looking ready to turn bullish
If entered, looking for a retes tof previous high or a run to the 1.618 fib level.

BKE on WatchLooking for a pullback to .5 fib level
Why:
High volume green days
Uptrend on daily chart
Green line is 1.618 fib on weekly daily chart.

FINV on WatchLooking for a pullback to close the gap.
Why:
Rejected at 1.618 fib extension
Gap to close
High green volume
Bullish MACD

Upon reaching PDL price
Previous Day rejected the previous day's low.
When price reaches PDL if price shows a bullish CHOCH to the upside
there could be a bullish orderflow change @ near previous day low's
Could be a good long entry towards previous day high

AU-longas of now structure has broken to the upside and given us a equal high. we should wait for more data before we enter for a buy .

German 40 Index – Sentiment Facing a Sterm TestSince hitting its most recent all time high of 24469 on June 5th the Germany 40 index has experienced some downside pressure as traders have moved to lock in profits on a very strong start to the year. This move has the potential to turn June into the worst monthly performance of 2025 so far, although there is still another 8 trading days to go.
This short-term shift in sentiment has been related to a combination of factors. The new all time high of 24469 hit on June 5th coincided with the latest ECB interest rate cut. However, at that meeting Madame Lagarde indicated in the press conference that more data on the path of inflation, trade tariffs with the US and Eurozone growth would be required before the ECB would consider cutting interest rates again.
This was followed by comments and headlines which suggested that progress on a trade deal between the US and EU was slow and would potentially continue past the original July 9th pause deadline set by President Trump.
Then in the last week sentiment has been rocked further by the spike in Oil prices driven by an escalating conflict between Israel and Iran that has seen them trade missile attacks for 7 straight days, alongside a growing concern that the US may also be seriously considering entering a direct conflict with Iran after Bloomberg reported yesterday that senior US officials are preparing for a possible strike in the coming days.
At the time of writing (0700 BST) this leaves the Germany 40 trading at 1 month lows around 23142 and suggests a consideration of the technical outlook, including potential support and resistance levels could be useful.
Technical Update: Watching 23235 Last Correction Low
Having posted a new all-time high on June 5th at 24469, a more extended price correction has developed in the Germany 40 index. Interestingly, as the chart below shows, this phase of weakness has seen closing breaks under what some might have anticipated would be support, marked by the Bollinger mid-average (currently 23862).
In previous reports, we have suggested that traders may use the Bollinger mid-average as an indicator of the possible direction of the current price trend. If the mid-average is rising with prices above it, the trend may be classed as an uptrend, while if the mid-average is falling with price activity below it, a downtrend might be in place.
As the chart shows, following the latest breaks below the mid-average, this has now turned lower, and traders might now be focusing on the possibilities for an extended phase of price weakness.
Let's consider the possible support or resistance levels that could be worthwhile for traders to focus on.
Potential Support Levels:
With Thursday’s initial price activity so far seeing further selling pressure, as the chart below shows, it might be suggested the next relevant support is already currently being tested with moves below 23235. This level is equal to the last correction low posted on May 23rd at 23235.
Traders might now be watching how this 23235 low support is defended on a closing basis over coming sessions, as confirmed breaks lower, while no guarantee of deeper price declines, might skew risks towards tests of the next potential support at 22303, which is equal to the 38.2% retracement of April 7th to June 5th strength.
Potential Resistance Levels:
Since the June 5th all-time high, an extended decline in price has already been seen, so a reactive recovery might be a possibility. However, having recently seen the mid-average turn lower, closing breaks back above its current 23862 level might now be required to trigger a phase of price recovery.
While much will depend on future price trends and market sentiment, if successful upside breaks above the 23862 mid-average are seen, it might lead to tests of 24469 which is the June 5th all-time high.
The material provided here has not been prepared accordance with legal requirements designed to promote the independence of investment research and as such is considered to be a marketing communication. Whilst it is not subject to any prohibition on dealing ahead of the dissemination of investment research, we will not seek to take any advantage before providing it to our clients.
Pepperstone doesn’t represent that the material provided here is accurate, current or complete, and therefore shouldn’t be relied upon as such. The information, whether from a third party or not, isn’t to be considered as a recommendation; or an offer to buy or sell; or the solicitation of an offer to buy or sell any security, financial product or instrument; or to participate in any particular trading strategy. It does not take into account readers’ financial situation or investment objectives. We advise any readers of this content to seek their own advice. Without the approval of Pepperstone, reproduction or redistribution of this information isn’t permitted.

Gold's Next Move Up: Why I'm Waiting for This 1H Order Block.Hello, traders! 👋 Let's take a look at the current price action on Gold (XAU/USD).
📉 Current Situation: Correction Phase
After a strong impulse that swept the Buy Side Liquidity (BSL), Gold has entered a correction. This corrective move has a clear target below: a key 1-hour order block that aligns with the 61.8% daily Fibonacci level. This area acts as strong support and a potential reversal zone for the continuation of the uptrend.
⚠️ Patience is Key
Price has not yet reached a safe discount zone for considering long positions. This is where the "whale's" Point of Interest (POI) lies. It's highly probable that large players will deliver the price to this zone to "refuel" (mitigate their positions) before continuing the move up, or at least to test the manipulation that swept the initial BSL.
My Trading Plan
🎯 The Long Setup
The primary condition for considering a long setup from the $3356 - $3365 area is:
Mitigation of the 1-hour order block.
The 61.8% Fib level must hold with a clear reversal reaction on at least the 4-hour timeframe.
I don't expect this to happen today. It's likely that price will first build liquidity above our POI before dropping into it. Only from that zone, and with LTF confirmation, can we consider safer long positions.
This is not financial advice. My analysis is for educational purposes only.

INDU - Long trade - Stop loss hunted by smart playerINDUS Motors stoploss hunted by some very very smart player yesterday :)
Brought down to 1685 level and then brought it up to just over its Fib 0.786 level.
It is taking support from its SMA20 level and a golden cross is about to happen next month.
This is the best time to hold onto it (my personal opinion, not a buy / sell call).
It requires patience though. This stock is not for impatient. As per my last analysis of INDU, its targets are minimum 3200 to 3500 (May go further upwards).
Moreover, it is a very good dividend stock. Ideal for long term investment.
Liquidity sweep can also be observed in last two days ;)

BTC Approaching Key Confluence Zone: Pivot + PRZ + LiquidationsBitcoin ( BINANCE:BTCUSDT ) appears to have broken the Support lines and is currently declining .
In terms of Elliott Wave theory , Bitcoin appears to be completing a corrective wave C . The corrective wave structure is a Zigzag Correction(ABC/5-3-5) .
I expect Bitcoin to start rising again from the Support zone($104,380-$103,660) , Potential Reversal Zone(PRZ) , Cumulative Long Liquidation Leverage($104,471-$103,124) , Monthly Pivot Point , Support line , and 50_SMA(Daily) , and the small CME Gap($106,190-$106,150) will also fill.
Note: Stop Loss: $102,520
Please respect each other's ideas and express them politely if you agree or disagree.
Bitcoin Analyze (BTCUSDT), 1-hour time frame.
Be sure to follow the updated ideas.
Do not forget to put a Stop loss for your positions (For every position you want to open).
Please follow your strategy and updates; this is just my Idea, and I will gladly see your ideas in this post.
Please do not forget the ✅' like '✅ button 🙏😊 & Share it with your friends; thanks, and Trade safe.

Solana SOL price analysis📞 Rumor has it that as soon as the global geopolitics reach a “temporary lull”, the following ETFs will be launched
Solana ETF is the most likely to be the next one (but there are at least 2 coins more on the list, which we will talk about in the coming days)
🪙 So, are you ready to buy CRYPTOCAP:SOL in your investment portfolio? For example, in the range of $117-123
🤖 Maybe we need to launch a long trading bot OKX:SOLUSDT so that it can buy in micro portions on the current possible price correction to get a “tasty price” as a result
◆ Would you like to join such a trading bot and copy them?
◆ And then compare the results with all “ETF candidates”
_____________________
Did you like our analysis? Leave a comment, like, and follow to get more

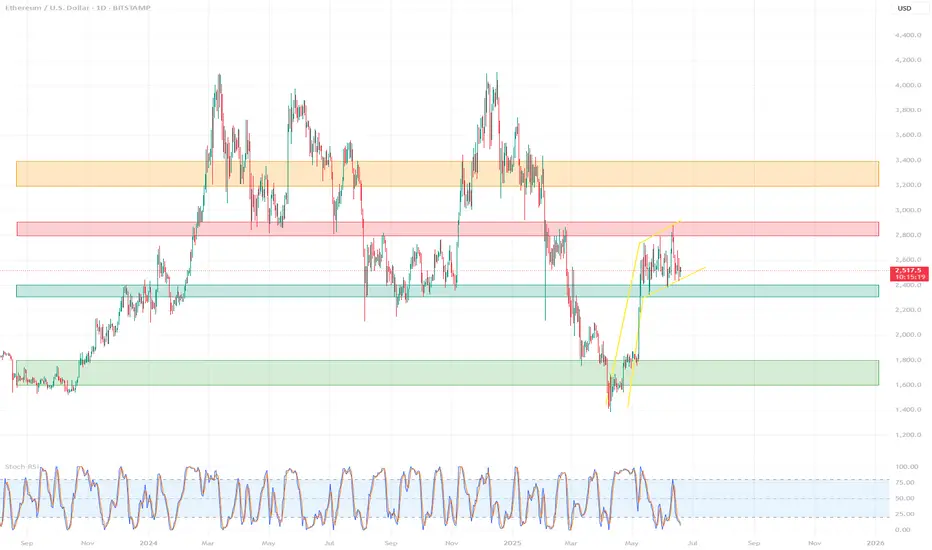
Detailed technical analysis of the ETH/USD chart🧭 General Context (1D, Long-Term):
The chart covers the period from approximately September 2023 to June 2025.
ETH/USD has gone through a complete cycle: growth → decline → correction → potential consolidation/accumulation.
🔹 Market Structure (Price Action)
🔸 Trends:
November 2023 – March 2024: strong uptrend, ETH reaches highs around $4,000+
March 2024 – February 2025: clear downtrend ending with a local low around $1,600
February 2025 – May 2025: dynamic rebound – probable trend change (new higher low + higher high)
May – June 2025: currently consolidating between ~$2,400–2,800
📉 Key Support and Resistance Levels
Type Level Notes
🔴 Resistance ~2,800 – 2,900 Local high, many candles with shadows rejected from above
🟡 Resistance ~3,200 – 3,400 Beginning of strong declines from 2024
🟢 Support ~2,300 – 2,400 Local lows in June 2025
🟢 Strong support ~1,600 – 1,800 Final market low of March 2025 (possible accumulation phase)
📊 Technical indicators
✅ Stochastic RSI (at the bottom of the chart):
Currently in the oversold zone (~0–20) → may signal a potential bottom / buying opportunity
Red-blue lines are starting to wrap upwards → possible rebound
Recent crossovers of the indicator corresponded to local price movements
🔍 Technical formations
⚠️ Possible formations:
Double Bottom: February–March 2025 → classic trend reversal formation
Rising Channel: from March 2025 to present – prices are moving in a slightly rising channel
Current consolidation may be a bull flag (continuation after the increase)
📌 Summary – scenarios
🟢 Bullish scenario:
Breakout of resistance ~2,800 → possible test of levels 3,200 – 3,400 USD
Confirmation of a higher low → continuation of the uptrend
Stochastic RSI in the oversold zone → potential for an uptrend
🔴 Bearish scenario:
Drop below 2,300 USD → possible return to the area of 1,800–1,600 USD
Breakout of the structure of higher lows
Confirmation that the increase was only a correction
🧠 Final conclusions
Currently, ETH/USD is in a key decision zone: after a strong rebound, the market is resting.
Stochastic RSI suggests a potential upside impulse, but requires confirmation by a breakout of resistance.
For traders: 2,800 (resistance) and 2,300 (support) are worth watching.
For investors: 1,600–1,800 could be considered a long-term accumulation zone.
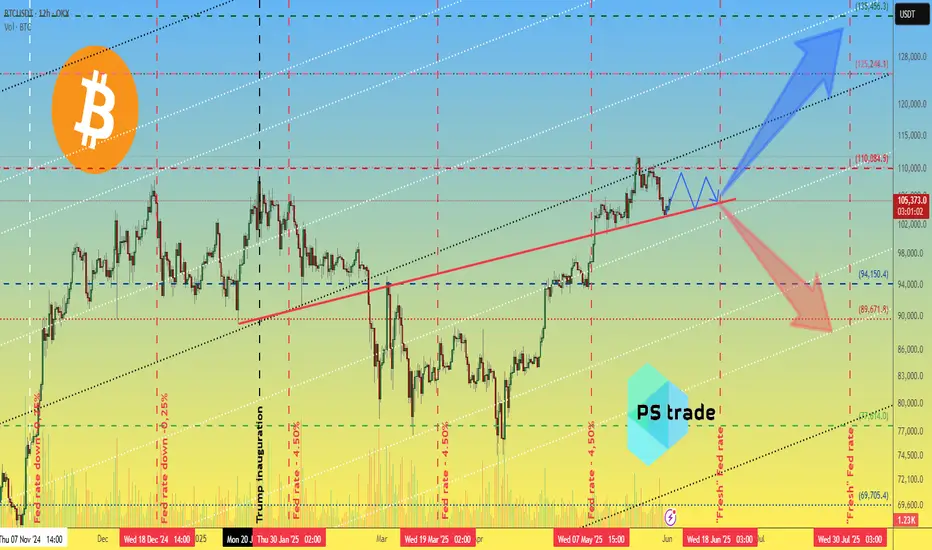
Bitcoin BTC price analysis🍿 At the OKX:BTCUSDT chart, we show one of the scenarios that could play out in the first half of June.
Much will be decided today with the opening of the US market. It is very likely that there will be a downward movement at the opening in response to the new tariffs announced by Trump on Friday after the markets closed.
🕯 Well, then we'll have to “keep our fingers crossed” that market players show their strength and hold on and buy back the drop — like say: we're tired of shaking with every crazy statement from Trump.
💰 If the price of CRYPTOCAP:BTC stays above $103k, there is a chance that it will be “stuck” in the $103-110k consolidation. The market needs to digest and redistribute the results of two months of #BTCUSD price growth from $75k to $112k.
And considering the position of the BTC.D and USDT.D indices, there is a chance that the “little bit” of capital will pass to the altcoins, and they will shoot up a little.
⁉️ Probably, the safest thing to do would be to watch the altcoins and buy only those that have started a significant upward movement with volume.
What do you think?
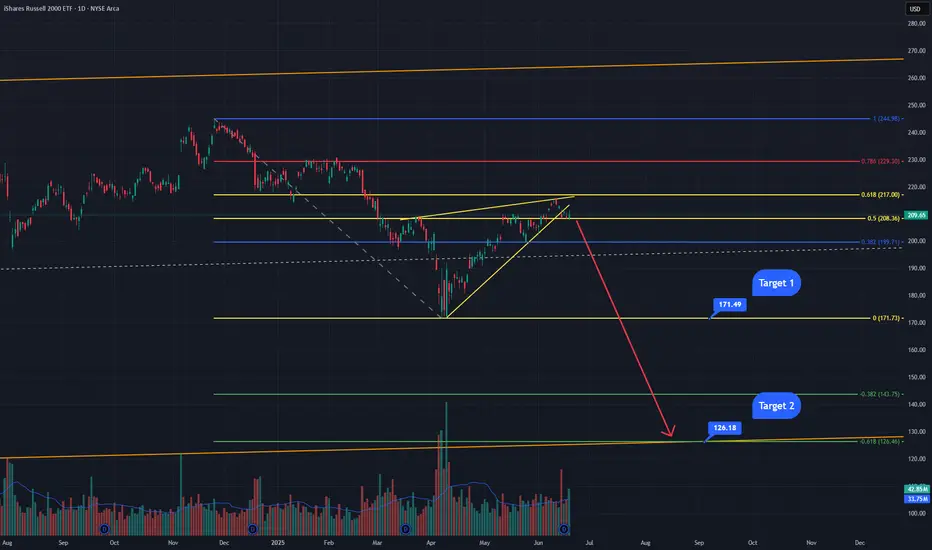
Small Caps about to get SlammedThe IWM has been trading inside this upward sloping wedge/bear flag for a few months. It just broke the bear flag this week and then tested the underside of it as resistance before getting rejected. This area also happens to be a golden pocket retracement zone from a Fibonacci I have drawn from the all-time highs made in November of last year to the lows made 2 months ago in April. The next probable move is back down to target 1 at the bottom of the Fibonacci retracement at $171. These golden pocket retracements have a very high probability of moving back down to the bottom of the retracement, sometimes breaking lower. This area at $171 has a lot of support but if it breaks, I expect it to come down to the orange line which is an upward sloping paralell channel that the IWM has been trading in since the financial crisis of 2008. The bottom of said channel connects the 2009 lows through the covid lows of 2020. This area also happens to be the -0.618 Fibonacci retracement area, it would be the 3rd hit of the bottom this major weekly channel and would very likely contain the lows for the current bear market.
NZDUSD - Expecting Bearish Continuation In The Short TermH1 - Clean bearish trend with the price creating series of lower highs, lower lows.
No opposite signs.
Expecting further continuation lower until the two Fibonacci resistance zones hold.
If you enjoy this idea, don’t forget to LIKE 👍, FOLLOW ✅, SHARE 🙌, and COMMENT ✍! Drop your thoughts and charts below to keep the discussion going. Your support helps keep this content free and reach more people! 🚀
--------------------------------------------------------------------------------------------------------------------

#ASCM - Egyptian stock - great opportunity, high financial risk#ASCM time frame 1 DAY
Note : before technical analysis the financial position of the company isn't in the best condition , there isn't any cash flows from operations activity , in anther hand the company work in MINING so that may cost the company lot of expenses and time before achieving any Mining discovery .
We have here a great Gartley Bullish pattern with 2 positive diversions at MACD and RSI in addition the prices in critical point ( stop loss of the pattern ) so :
Entry level at 34.00 ( price now is 32.85 ) so we can wait to close daily over 34.00 or start from this point ( consult your account manager )
Stop loss 32.70 ( estimated loss -4% ) or estimated loss from this point is 0.50 %
First target at 37.50 ( estimated profit around 14% )
Second target 40.70 ( estimated profit around 23% )
Third target 42.70 ( estimated profit 30% )
NOTE : this data according to time frame I DAY , it`s may take period up to 3 months to achieve targets , you must study well the Alternative opportunities before invest in this stock .
Its not an advice for investing only my vision according to the data on chart
Please consult your account manager before investing
Thanks and good luck

ICDI - save your profits and capital#ICDI timeframe 4 hours and also 2 hours
Created a bearish Gartley pattern
Sell point around 3.72 ( prices now is 3.74 )
Stop loss / reentry 3.80 (estimated loss -2.00%)
First target at 3.53 (estimated profit 4.87%)
Second target 3.80 (estimated profit up to 9.24%)
Third target 3.20 (estimated profit up to 13.90%)
NOTE: this data according to timeframe 4 hours and also 2 hours.
It's not an advice for investing, only my vision according to the data on chart.
Please consult your account manager before investing.
Thanks and good luck.

ADRI - Egyptian stock market - good for medium term investing #ADRI timeframe 1 DAY
Created Gartley Bullish pattern.
Entry level at 1.08 ( price now 1.07)
Stop loss 1.02 ( loss may go to up -5.50% ) - support 1.05
First target at 1.24 ( with profit around 14.49% ) resistance 1.15
Second target 1.37 ( with profit around 26.60% ) resistance 1.28
Third target 1.52 ( with profit around 40.84% ) resistance 1.45
NOTE : this data according to time frame I DAY , so its may take time up to 3 months .
Its not an advice for investing only my vision according to the data on chart
Please consult your account manager before investing
Thanks and good luck

#EAST - great fundamental - positive long term #EAST timeframe 1 hour
Created Bullish Gartley pattern, so we can see action price in this point .
Entry level around 30.20
Stop loss 29.70
First target at 31.65
Second target 32.50
Third target 33.20
NOTE : this data according to timeframe 1 hour.
Also MACD show positive diversion that may support our idea.
Its not an advice for investing only my vision according to the data on chart
Please consult your account manager before investing
Thanks and good luck

$ETH / USDT – 4H Time Frame Analysis 3,000 INCOMING?? CRYPTOCAP:ETH / USDT – 4H Time Frame Analysis
Structure: Bullish Flag | Outlook: Neutral-Bullish | Target: $3000?
🔹 Chart Overview
-Pattern: Bullish Flag (continuation structure)
Current Range:
- Supply Zone: $2,680.00 – $2,786.21
- Demand Zone: $2,319.79 – $2,417.61
Price Action:
- Tight consolidation between higher lows and lower highs, forming a symmetrical triangle within a flag structure.
Trend:
- Consolidation, but within a macro uptrend (prior strong rally).
Volume Profile:
- Anchored Volume shows high participation around $2,540–$2,600.
OBV:
- Flattening, signaling indecision and potential energy buildup.
Key Psychological Levels:
$2,860: Minor resistance from past S/R flips.
$3,000: Major round-number psychological resistance.
📐 Technical Confluences
Fibonacci Retracement:
- The 0.618 golden pocket aligns with the support trendline, reinforcing this as a critical zone.
Fair Value Gaps (FVG):
- Above Price: Acts as a magnet in bullish continuation.
- Below Price: Risk zone if price drops; aligns with liquidity and trendline support.
- Liquidity Zone: Aligned with 0.5–0.618 retracement; strong reaction expected.
📈 Bullish Scenari o
Breakout of Pennant Resistance:
- A clean break above $2,786 (supply zone & swing high) with volume.
Close above Upper FVG and Liquidity Zone:
- Confirms bullish intent. Targets psychological level at $2,860, then $3,000.
Volume Confirmation:
- OBV uptick and high breakout volume would validate the move.
Bullish Target Zones:
TP1: $2,860 (psych level + previous resistance)
TP2: $3,000 (major psychological level)
TP3: $3,120–$3,180 (1.618 Fib extension)
📉 Bearish Scenario
Rejection from Current Supply or Liquidity Zone:
- Fails to break above supply; rolls over from the upper pennant line.
Break Below Support Trendline:
- Break below golden pocket and $2,417.61 demand zone.
Invalidation of Bullish Flag:
- A breakdown below $2,319.79 (swing low) invalidates the bullish flag and may signal a trend reversal.
Bearish Target Zones:
TP1: $2,200 (local volume gap + structure support)
TP2: $2,060–$2,120 (previous accumulation zone)
TP3: $1,950 (macro support & last strong demand)
✅ Summary
Structure:
- Price is compressing within a bullish continuation pattern, awaiting breakout confirmation.
Bias: Slightly bullish unless the swing low at $2,319 is broken.
Confirmation Needed:
- Break above or below pennant boundaries with volume.

OP / USDT 4hr PUMP INCOMING? OP/USDT – 4H Chart Summary
Market Structure:
4H Timeframe:
- Price consolidating within a descending triangle/wedge pattern, indicating potential buildup before a breakout.
- Lower Timeframes (1H and below): Bearish trend structure with lower highs and lows.
- OBV (On-Balance Volume): Forming a wedge—suggesting accumulation or distribution phase nearing a breakout.
Key Zones:
Demand Zone (Support):
- 0.5483 – 0.6351
This area has provided strong support historically. A clean break below could signal continuation of the larger downtrend.
Supply Zone (Resistance):
- 0.9068 – 1.0414
-Historically rejected price; high probability of reversal or consolidation if revisited.
Fair Value Gaps (FVG):
- FVG 1: 0.6659 – 0.6838
- FVG 2: 0.7024 – 0.7308
These inefficiency zones are likely to attract price if bullish momentum builds. Watch for potential short-term rejection or continuation setups here.
Volume Profile:
Strongest volume node (high liquidity zone) sits between 0.7470 – 0.8000
Suggests this area has been heavily traded and may act as magnet/resistance if approached again.
Fibonacci Confluence:
Previous swing high at 0.8232 aligns with the 0.618–0.65 golden pocket
A critical zone for potential take-profit or trend reversal on a breakout.
Scenarios:
Bullish Case:
If price holds above 0.6351 and bounces, look for:
- Retest of FVG 1, followed by FVG 2.
- Breakthrough of 0.7308 could target the golden pocket and swing high at 0.8232.
- Sustained bullish move may reach the supply zone above 0.9068.
Bearish Case:
- Breakdown below 0.6351 and especially below 0.5483 would:
- Invalidate the wedge support.
- Confirm continuation of the macro downtrend.
-Open room for new lows and bearish expansion.
Conclusion:
Price is at a key decision point inside a wedge.
Reaction at 0.6351 is critical—support bounce targets higher inefficiencies; breakdown signals deeper bearish continuation.
OBV and volume structure suggest an imminent volatility spike—prepare for a breakout.

TRBUSDT Long with good RRTRBUSDT with bullish pivots, follows with divergence on smaller time frames, possible reversal with FakeBO, a good Risk Reward. First 85 daily target on fibonacci levels.
