USDCAD ShortWe have recent fair value gaps, which the market has to close; we anticipate it closing that gap before creating a new high. We have a low resistance created on the upwards side.
Fibonacci

Bitcoin: Blood in the Streets – Now is the Time!Once again, there’s blood in the streets—and from this point on I start scaling into spot positions again, slowly but deliberately.
All of these are spot entries with soft stop-losses—not hard exits, but areas I’ll react to if needed.
So why now? For one, we’re sitting right above the 38,2% Fibonacci level for the ending of the wave A. At the same time, we’re about to tap into a daily Fair Value Gap, while trying to hold the range support—two important technical levels lining up on the higher time frame.
Below that, we have an untapped VWAP at $65.5K, which could act as a magnet, as it often does. And yeah—if we go under $62K or even $60K, the classic “time to work at McDonald’s” joke comes back. But seriously: in markets like this, you need to stay calm, have some humor, and most of all, know what’s possible.
So I’m cautiously watching the S&P 500 closely, which plays a big role in this setup for me.
That’s where I stand on BTC right now—careful optimism, grounded in context and reasoning for me.

Hexatronic - why I bought the stockHexatronic seems to be in an uptrend in my opinion and it has retraced very deep every single time it made new all-time highs.
In EWT wave 2s are the ones that retrace very deep and if we take into account that there might be several wave degrees with 1-2 setups it means the stock might rise to new highs again.
Considering the retracement from the very bottom of the price history is already approaching the 88.7% fib level The risk is fairly low in comparison to the upside.
Based on the assumption of several 1-2 setups that need to unfold as 5 wave cycles the company has a bright future ahead and as far as I´m aware this is shared by the fundamental analysts as well.
Please, comment if you have questions and support my idea if you like it.

Golden stage low area: 3285-3275!Fundamentals:
1. Focus on Trump's dynamics and tariff-related issues;
2. Pay attention to whether geopolitical conflicts will escalate, including the situation between India and Pakistan, Russia and Ukraine, and the situation between the United States and Iran, etc.
The current expectation of interest rate cuts has declined, and the tariff storm has cooled down. At the same time, the market is betting on a further trend correction, which may cause capital outflows from the market, which will further hit gold bulls!
Technical aspects:
As I expected in my previous article, gold is expected to fall below 3300. Sure enough, gold has shown signs of falling below 3300. In the current structure, gold may further extend to the 3280-3270 area, which is also an important support area of primary concern in the short term; and as gold fell sharply, the market was bearish, and short-term resistance also moved down to the 3315-3325 area.
Trading strategy:
1. Consider the shorting opportunity after gold rebounds to the 3315-3325 area, TP: 3300-3290
2. Consider the longing opportunity after gold falls to the 3285-3275 area, TP: 3300-3310

CME eyes on $225: Major front with only scattered clouds above CME has been struggling up against a major resistance zone.
Golden Genesis plus Golden Cofid fibs in a tight confluence.
Break should run given only minor fibs for some distance above.
$ 225.53 - 226.56 is the immediate zone of interest.
$ 218.47 below is first support for SL protection.
$ 239.66 is first hurdle and should be easy target.
========================================================

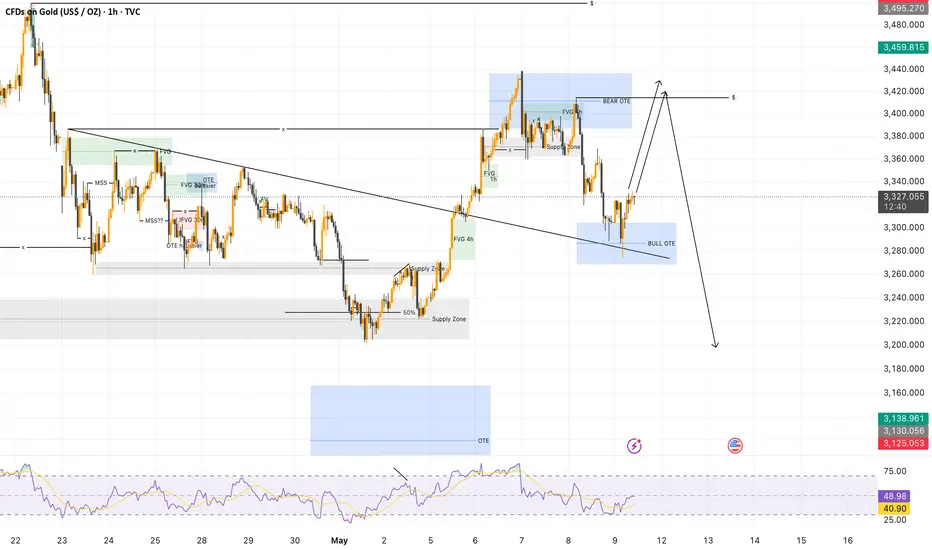
Gold (XAU/USD) Analysis – 1H🏛 1. Current Market Structure
📈 After a strong upward impulse, gold has now pulled back into a Bull OTE zone, aligned with a key trendline acting as a dynamic support.
📐 This setup could indicate a potential bullish rebound, especially if the market views this pullback as a healthy retracement before a larger continuation.
🌍 2. Bigger Picture Outlook
🔍 The recent rejection at the Bear OTE highlights the presence of strong supply at higher levels.
⚠️ However, the current bounce from the Bull OTE could either be the start of a larger bullish leg targeting the Bear OTE again – or just a technical bounce before a deeper correction, especially if the FED hints at rate cuts in June or July.
🔍 3. Key Technical Observations
🟦 Bear OTE: Clear rejection, confirming this as a key resistance for now.
🟦 Bull OTE: Providing initial support, coupled with a trendline bounce, adding confluence for a potential move up.
📐 Trendline Support: Critical for maintaining the current bullish structure, a break here could signal a deeper retracement.
🎯 4. Short-Term Expectations
📉 Bearish Scenario:
Rejection from the Bull OTE
Break below the trendline
Deeper pullback towards the Supply Zone or even the 50% retracement level
📈 Bullish Scenario:
Clean break above the Bull OTE
Retest of the Bear OTE (~$3,500)
Possible breakout if volume supports the move
🔥 5. Upcoming Catalysts
🕰 FED rate decision in June/July – potential rate cuts could shift sentiment.
💰 Inflation and economic data: Key drivers for gold’s short-term direction.
🔎 Volume and order flow: Crucial to confirm any true breakout.
✅ Conclusion
👉 Gold is at a critical junction, testing a Bull OTE with a supporting trendline – a key moment for determining the next major leg.
📍 Key levels to watch:
Bear OTE (~$3,500)
Bull OTE (~$3,300 - $3,320)
Trendline support – a break here could invalidate the bullish thesis
⏳ As always, stay alert for fakeouts and liquidity grabs around these levels.
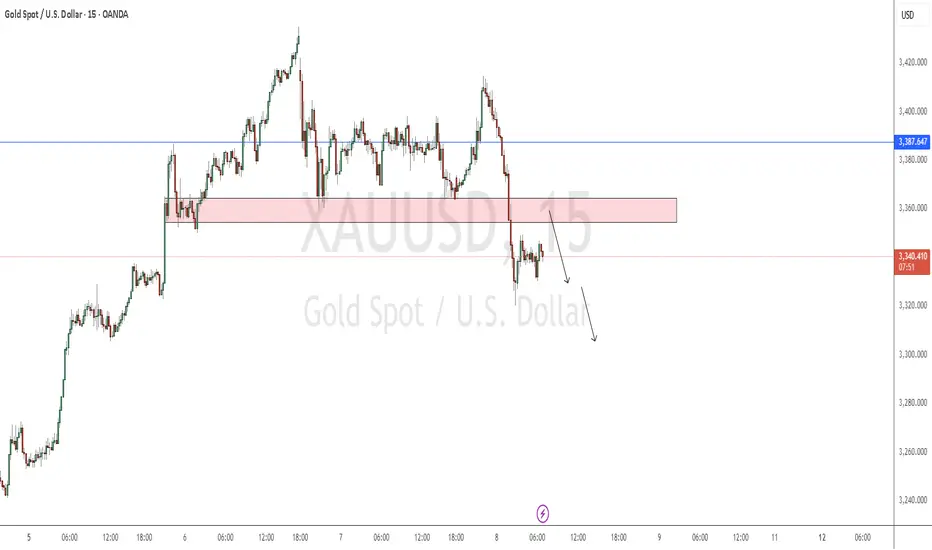
Gold Bearish againThe chart is clear to me, folks!
Wait for the pullback to the resistance level and enter.
The support level is broken and has formed resistance.
Good Luck
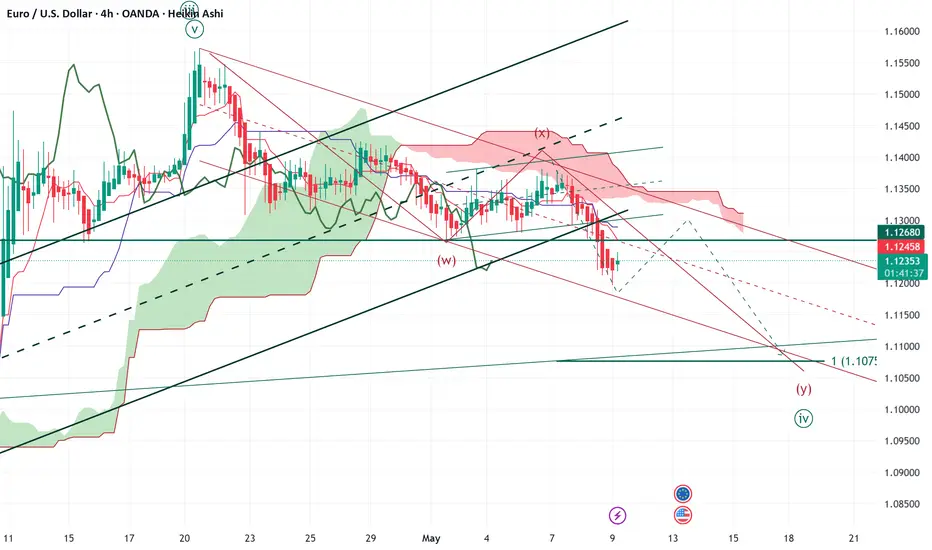
EWTSU EURUSD H4 minute wave ((4)) update
Elliott Wave Trade Set Up H4 EURUSD
minute wave ((4)) developping in a complex zigzag (double)
minuette (y) running in 3 waves to 1.1070 area - (w)=(y)
invalidation: price break steadly over 1.1370 area
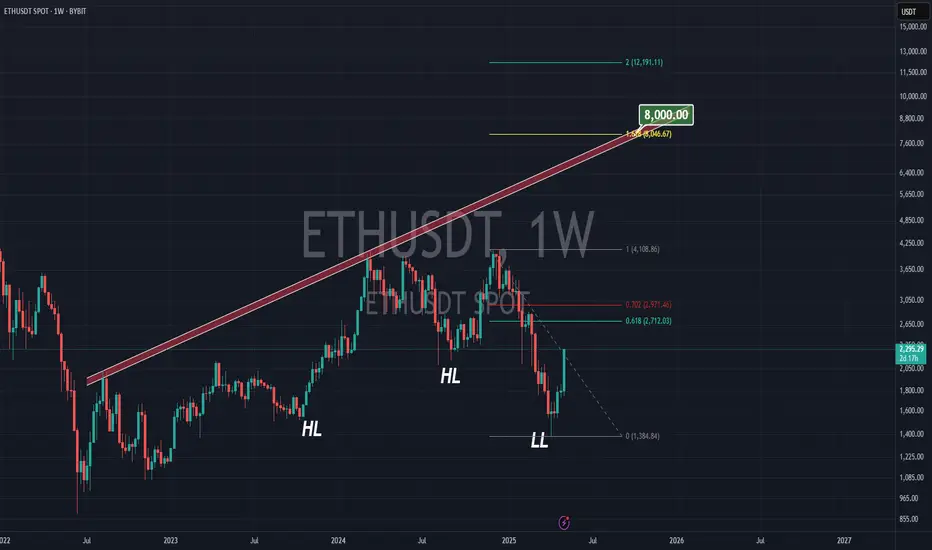
ETHEREUM TO $8000According to the previous tops we have for Ethereum on big time frames, we have a strong & long-term trend-line which gives us $7000 in summer and $8000 in October time.
On the other hand the 161.8% Fibonacci from the previous top the bottom we just saw (about $1500 ) is at $8000 .
Is this a coincident?! I don't think so
NQ Power Range Report with FIB Ext - 5/9/2025 SessionCME_MINI:NQM2025
- PR High: 20182.50
- PR Low: 20137.00
- NZ Spread: 101.5
No key scheduled economic events
Auction maintaining week range, holding in the highs
Session Open Stats (As of 12:55 AM 5/9)
- Session Open ATR: 555.12
- Volume: 33K
- Open Int: 260K
- Trend Grade: Bear
- From BA ATH: -10.9% (Rounded)
Key Levels (Rounded - Think of these as ranges)
- Long: 20954
- Mid: 19246
- Short: 16963
Keep in mind this is not speculation or a prediction. Only a report of the Power Range with Fib extensions for target hunting. Do your DD! You determine your risk tolerance. You are fully capable of making your own decisions.
BA: Back Adjusted
BuZ/BeZ: Bull Zone / Bear Zone
NZ: Neutral Zone

104.2k was BTC top for a REASON: Golden Covid fib calling itHere we are again testing the ATH levels.
This time we got an EXACT hit on the fib.
Golden Fibs are always strong as proven.
$104,235 (Coinbase) is the exact level
$ 95,176 is a possible retrace target.
$120,295 is next target if we break out.
It is PROBABLE that we Orbit this fib for a while.
It is POSSIBLE that we break and run to next fib.
It is PLAUSIBLE to be a Lower-High TOP for a while.
Please hit the BOOST to encourage more posts.
=========================================
Previous Plots below
=========================================
$105k top call:
75k Retrace targeted EXACTLY
97.8k Breakout Call
===========================================
.

$GRAB Long Term Trade IdeaTaxi and delivery service stocks all look bullish at the moment. Lyft and Grab are both a couple of my favorite longer term swing trade/investment plays just based off risk/reward and how beaten down both the stocks are.
If shown patience this trade could work wonders. I like it a lot because it gets me a little exposure to assets outside the U.S. and from a chart perspective its hard not to love a setup like this.
1. The buy side volume shown here is the highest its ever been for the stock by a long shot.
2. Price has been in a descending wedge type formation for several months now and is attempting to make a breakout, though this month's candle still has a lot of time left.
3. That hammer candle, especially considering it being printed on the 1M timeframe, is incredibly bullish in my eyes.
This chart reminds me a lot of NYSE:BABA but a bit earlier in its breakout stages. To me it is clear that accumulation has been taking place for over 2 years now and a big markup is upon us.
I have 3 take profit areas marked based off a few different Fibonacci levels I like that also have confluence with supply/demand dynamics present on the chart.
multiple daily/weekly candles below $4 could be a a good stop loss area as that would invalidate a lot of the bullish structure. Based off the current price this provides you with a minimum 2.75x RR trade and a maximum of 7x RR.
My average price is $4.25. Any pullbacks below $4.50 I will be looking at as great buying opportunities.
Will do my best to update this idea periodically over the next year or so.

OSK eyes on $88.82-89.24: Key Resistance to Tariff Relief bounceOSK bounced into a key resistance after Tariff pivot.
Mostly US based company so almost immune to tariffs.
Currently testing first fib support so maybe ready to go.
$ 88.82-89.24 is the exact resistance zone of interest.
$ 86.66 is first (minor) fib support for bulls to hold.
================================================
.

DIS watch $84.19-84.56: Key support might say "Bottom Is In"DIS struggling to maintain any altitude at all.
Lost all of the tariff relief bump, looking weak.
See if bulls hold key support zone $84.19-84.56

COIN watch $207-210: Major Resistance to Recovery may cause dip COIN getting a boost along with Bitcoin surge.
Just hit a major resistance zone $207.72-210.70
Looking for a dip or Break-n-Retest for next move.

Helix Energy Stock Chart Fibonacci Analysis 050825Trading Idea
1) Find a FIBO slingshot
2) Check FIBO 61.80% level
3) Entry Point > 6.0/61.80%
Chart time frame: D
A) 15 min(1W-3M)
B) 1 hr(3M-6M)
C) 4 hr(6M-1year)
D) 1 day(1-3years)
Stock progress: A
A) Keep rising over 61.80% resistance
B) 61.80% resistance
C) 61.80% support
D) Hit the bottom
E) Hit the top
Stocks rise as they rise from support and fall from resistance. Our goal is to find a low support point and enter. It can be referred to as buying at the pullback point. The pullback point can be found with a Fibonacci extension of 61.80%. This is a step to find entry level. 1) Find a triangle (Fibonacci Speed Fan Line) that connects the high (resistance) and low (support) points of the stock in progress, where it is continuously expressed as a Slingshot, 2) and create a Fibonacci extension level for the first rising wave from the start point of slingshot pattern.
When the current price goes over 61.80% level , that can be a good entry point, especially if the SMA 100 and 200 curves are gathered together at 61.80%, it is a very good entry point.
As a great help, tradingview provides these Fibonacci speed fan lines and extension levels with ease. So if you use the Fibonacci fan line, the extension level, and the SMA 100/200 curve well, you can find an entry point for the stock market. At least you have to enter at this low point to avoid trading failure, and if you are skilled at entering this low point, with fibonacci6180 technique, your reading skill to chart will be greatly improved.
If you want to do day trading, please set the time frame to 5 minutes or 15 minutes, and you will see many of the low point of rising stocks.
If want to prefer long term range trading, you can set the time frame to 1 hr or 1 day.

Upwork Stock Chart Fibonacci Analysis 050825Trading Idea
1) Find a FIBO slingshot
2) Check FIBO 61.80% level
3) Entry Point > 14.6/61.80%
Chart time frame: D
A) 15 min(1W-3M)
B) 1 hr(3M-6M)
C) 4 hr(6M-1year)
D) 1 day(1-3years)
Stock progress: A
A) Keep rising over 61.80% resistance
B) 61.80% resistance
C) 61.80% support
D) Hit the bottom
E) Hit the top
Stocks rise as they rise from support and fall from resistance. Our goal is to find a low support point and enter. It can be referred to as buying at the pullback point. The pullback point can be found with a Fibonacci extension of 61.80%. This is a step to find entry level. 1) Find a triangle (Fibonacci Speed Fan Line) that connects the high (resistance) and low (support) points of the stock in progress, where it is continuously expressed as a Slingshot, 2) and create a Fibonacci extension level for the first rising wave from the start point of slingshot pattern.
When the current price goes over 61.80% level , that can be a good entry point, especially if the SMA 100 and 200 curves are gathered together at 61.80%, it is a very good entry point.
As a great help, tradingview provides these Fibonacci speed fan lines and extension levels with ease. So if you use the Fibonacci fan line, the extension level, and the SMA 100/200 curve well, you can find an entry point for the stock market. At least you have to enter at this low point to avoid trading failure, and if you are skilled at entering this low point, with fibonacci6180 technique, your reading skill to chart will be greatly improved.
If you want to do day trading, please set the time frame to 5 minutes or 15 minutes, and you will see many of the low point of rising stocks.
If want to prefer long term range trading, you can set the time frame to 1 hr or 1 day.

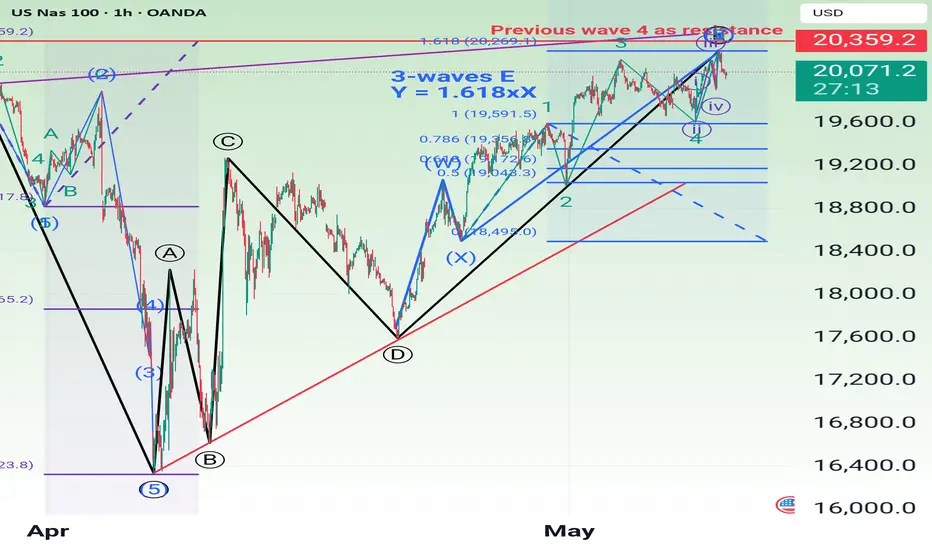
Nasdaq Short: completion of wave structureA few days back, on the weekend, I posted an idea about pending short but price went down first to create a 4th wave before going back up to complete the price target last night. So, this is the updated wave count. Wait for retracement to short. Stop above the high.
$TOTAL Crypto Market Cap - Banana Zone or Bull Trap!?Massive day for CRYPTOCAP:TOTAL Crypto Market Cap with 9% move UP, breaking above the 200DMA and last cycle’s ATH.
Got rejected at the .618 Fib ~$3.19T, so work still needs to be done to confirm this region.
Expect a retest at $3T to decide if the market goes to $3.2T or back down to $2.85T
As I've been saying this past month, this is either the biggest bull trap all cycle, or it's the start of the PARABOLA 🍌

$ETH 20% Move With 20/50DMA CrossoverHOLY MOLY!
Over 20% gain for CRYPTOCAP:ETH on the day
20DMA making a bullish crossover the 50.
Next target at the .382 Fib ~$2400
Did Pectra actually work?
And is Ethereum back from the dead !?

EURUSD Wave Analysis – 8 May 2025
- EURUSD broke support zone
- Likely to fall to support level 1.1130
EURUSD currency pair recently broke the support area between the support level 1.1300 (which has been reversing the pair from the start of April), support trendline of the daily up channel from March and the 38.2% Fibonacci correction of the upward impulse from March.
The breakout of this support area accelerated the active short-term ABC correction ii from the start of April.
EURUSD currency pair can be expected to fall to the next support level 1.1130 (former strong resistance from the start of April).

$EURUSD Short IdeaAnother day and yet another interesting euro trade. Today, EURUSD broke its uptrend line with a convincing daily candle. The broken level near 1.1270 offers a compelling short with stop above the hourly swing high. I usually prefer taking an entry near the swing 0.382 fib, but the 0.5 offers a better proposition in this configuration. My entry is GTD for 12 hours and thereafter actively managed on the H1.

URNM eyes on $36.07: Golden Genesis to Mark Bottom or End BounceURNM trying to recover from a strong downtrend.
Currently testing a Golden Genesis fib at $36.07
Look for a Break-and-Retest to mark the Bottom.
.
Last Plot that called the TOP:
Also a Golden Genesis that marked the top.
============================================
.

FILUSDT Potential UpsidesHey Traders, in today's trading session we are monitoring FILUSDT for a buying opportunity around 2.60 zone, FILUSDT is trading in an uptrend and currently is in a correction phase in which it is approaching the trend at 2.60 support and resistance area.
Trade safe, Joe.
