FCCL LongGolden cross on weekly time frame. RSI has cooled down and is ready to take off again.
Possible target is 77.
Fibonacci

USDCAD offers good R:R opportunityAs the price corrected, its forming a falling wedges pattern. And the best thing is all the new lower low was appear alongside the higher low on MACD, it's such a strong BULLISH DIVERGENCE signal.
I believe in the next 2-3 trading days, 100-150 pips upward movement is very likely to happen.

Oil (WTI) – Preparing for Potential Fresh VolatilityThe price of Oil (WTI) fell dramatically last week, from a high of 78.88 on Monday June 23rd to a low of 65.21 on Tuesday June 24th, as a ceasefire was first agreed and then held between Israel and Iran. This shifted the focus for traders back to US trade talks and looming tariffs, the direction of US economic growth and the potential for another OPEC+ production increase. Although, it must be said that nervousness about the sustainability of the ceasefire is still drawing the focus of traders this week and may continue to do so.
In terms of trade, Oil prices jumped higher yesterday as a trade deal between the US and Vietnam was announced, but the question remains, could this rally be short lived?
President Trump stated on Tuesday that he doesn’t expect to delay his July 9th tariff deadline, which could see higher import penalties reimposed on key trading partners, such as Japan and the EU. While it seems that traders may still be unsure whether he really means this, any potential impact on Oil prices could increase the closer we move to the deadline.
Today’s data releases could provide some key insights into the health of the US economy, with Non-farm payrolls released at 1330 BST and the US ISM Services PMI due at 1500 BST. Traders expect jobs growth to continue to moderate, so any bigger downside surprises could increase Oil price volatility, and the direction of service activity (bars, restaurants etc), the main driver of US growth for many months, may also be crucial for sentiment. Traders may be watching for whether there has been any major deterioration in this services PMI reading, back towards, or below 50, which is the dividing line between economic contraction and expansion.
Then, Sunday’s (July 6th) OPEC+ meeting, where the group is expected to agree to an August supply increase for a fourth month in a row, moves into focus. Depending on this OPEC+ decision and any tariff or geo-political developments over the weekend, Oil prices could potentially open up at very different levels on Monday morning.
Technical Update: Breaking Higher From Range?
Following the aggressive sell-off in the price of Oil from the 78.88 June 22nd high into the 65.21 June 24th low, a period of stability materialised as traders assessed the developing geo-political backdrop.
This saw price activity held by support offered by the 65.21 price low and resistance by the 67.54 June 26th high. However, as the 4 hourly chart above shows, the latest activity has now seen prices move out of this range, with a closing break above the previous 67.54 high.
While a break higher from such a sideways range in price is not a guarantee of continued upside, traders may now be viewing this type of activity as reflecting potential for a more extended phase of price strength.
Next Possible Resistance Levels.
If further price strength is to emerge, it might now suggest possibilities to test the 70.48 level, which is equal to the 38.2% Fibonacci retracement of the June 22nd to June 24th decline.
Closing breaks above this resistance may then lead to further attempts at price strength towards 72.08, which is the higher 50% retracement level.
Next Possible Support Levels
While some traders might view a move back into the old sideways price range, which would be represented by closes back under the 67.54 recent high, as marking the possibility of increasing downside pressure again, it might in fact be breaks under the 66.98 level, which is equal to half latest strength, that indicates the potential of further price declines.
Such downside closing breaks may well suggest potential to retest the 65.21 June 24th low trade, possibly further if this in turn gives way.
The material provided here has not been prepared accordance with legal requirements designed to promote the independence of investment research and as such is considered to be a marketing communication. Whilst it is not subject to any prohibition on dealing ahead of the dissemination of investment research, we will not seek to take any advantage before providing it to our clients.
Pepperstone doesn’t represent that the material provided here is accurate, current or complete, and therefore shouldn’t be relied upon as such. The information, whether from a third party or not, isn’t to be considered as a recommendation; or an offer to buy or sell; or the solicitation of an offer to buy or sell any security, financial product or instrument; or to participate in any particular trading strategy. It does not take into account readers’ financial situation or investment objectives. We advise any readers of this content to seek their own advice. Without the approval of Pepperstone, reproduction or redistribution of this information isn’t permitted.

SOLUSDT → Countertrend correction and hunt for liquidityBINANCE:SOLUSDT looks quite promising on the bullish side. The price is testing one of the key resistance levels within the local trend rally. A correction is forming. Is it beneficial for us?
On the higher timeframe, we see a change in character, a breakout of the trend resistance, and the formation of an upward trend support line. Bitcoin is still bullish (locally) at this time, but it is consolidating, which generally provokes a correction in SOL as well. Focus on the 150-149 area. If the bulls are able to keep the price above this zone after the retest, followed by the formation of momentum, this can be considered a positive medium-term sign.
Locally, the price within the trading range of 149.36 - 158 is heading towards the area of interest and liquidity (eql) at 149.36. The current sell-off is most likely triggered by a large player seeking a more favorable entry into the market.
Resistance levels: 154.75, 156.8
Support levels: 149.36, 147.93
In the current situation, it makes the most sense to consider an intraday trading strategy. A countertrend correction and a retest of support could attract buyers...
Best regards, R. Linda!

BTC Breakdown Escalates Bearish MomentumBitcoin has officially broken below the critical 104K support level, invalidating the recent short-term bullish structure. The price action reflects a clear shift in market sentiment, confirmed by the bearish EMA/SMA crossover and a firm rejection from the strong supply zone between 110K–111.8K.
This rejection formed a clean lower high around 110K, followed by a decisive drop below the weak supply area and failure to hold 104K a key level previously acting as a demand floor. The current structure now favors downside continuation, with the 98K zone as immediate focus.
If bearish momentum persists, attention will shift toward the Weak Potential Reversal Zone and eventually the Recommended Buy Back Zone around the 84K–86K area. This zone aligns with a historical support range and may offer high-probability entries for medium-term accumulation.
Until price reclaims the 104K–105.5K region, rallies are likely to be sold off within the supply zones. Short-term traders may look to trade the breakdown toward the highlighted support levels, while long-term investors should monitor price reaction within the buyback region.

AUDCHF AUDCHF is preparing to break through support and fallWeak market structure. Gradually declining lows and no reaction to support at 0.5211. Buyers are trying to keep the price above 0.5211, but under market pressure their strength is weakening.
Relative to 0.5211, we see the formation of consolidation, which is of a “pre-breakdown” nature.
Accordingly, a break below the 0.5211 support level could trigger the activation of buyers' SL orders, leading to liquidation and a downward price distribution.
Potential targets include 0.518 and 0.5164.

Pudgy Penguins PENGU price analysis🪙 It seems that #PENGU is being sold off, and the price of OKX:PENGUUSDT has been stuck in consolidation at conditional highs for several days now, where positions are likely being redistributed.
Nevertheless, if at the beginning of the year, after listing, the price of the #PudgyPenguins token was released into not even “free float,” but simply into “free fall,” now, for several months, it has been “held” in a controlled manner.
🐻 If our assumption is correct, then the price of #PENGUUSDT should adjust to $0.01 or, in the worst case, to $0.0065-0.0070
📈 And if we are wrong, then the price of #PENGU has every chance of breaking out through to $0.02 in the coming days. With a global target of $0.03
⁉️ What is your opinion
Is this a fundamental project that is doomed to grow, or just a manipulative memecoin toy?
_____________________
Did you like our analysis? Leave a comment, like, and follow to get more

Analysis on circle using tpo and regular chart longs and shortMust watch video giving 2 really nice Risk reward entries on the Newley listed stock Circle
In this video I highlight a region using limited data of where to get filled if you missed the IPO and want to buy some circle .
We are currently in a no trade zone for buyers as I anticipate that price will gravitate down to the .786/.886 level over time .
In this video I also use the TPO chart "Time price opportunity" and demonstrate what i am looking for from using this type of chart to add to my confluences for a high probability trade .
Also identified in the chart is a short trade off of the weekly pivots and the value area high of the range .
Thankyou for watching and i welcome any questions

$10 is looking realistic... if Mr. T doesn't mess it up lolWe have a lot of $10 call options on every expiration date for the next few months, meaning this move might take a while to play out. Unsure of exact date if its earnings call or news but $10 seems to be where the focus is.
If tariffs begin or effect Brazil negatively then this stock could plunge on low growth anticipation.
Watch very very closely on how price reacts to $9 IF we even go down there.

BTC with potential for $115,000/$120,000🔍 Market structure (Price Action)
📈 Trend:
The market previously formed higher highs (HH) and higher lows (HL) – a classic uptrend.
Then there was a correction and a lower high (LH) and lower low (LL) appeared – a potential change in the trend to a downtrend.
The last two lows are again HL (Higher Lows) – suggesting an attempt to return to the uptrend.
🔄 Key support and resistance levels
✅ Resistance (green horizontal lines):
117.469 – local resistance and potential breakout target from the current range.
115.802 – confirmed resistance from previous consolidations.
111.814 – strong local resistance (LH – Lower High formed there).
109.341 – current resistance, the price is currently testing it.
🛑 Support (red horizontal lines):
105.370 – local support, price reacted at this level in recent days.
102.650 – important support, level of previous HL.
100.095 – consolidation level before breaking out upwards.
98.213 – last LL – very important level in the context of defending the structure.
🧭 Structure of peaks and troughs
HH: Higher High – confirmed the previous uptrend.
LH: Lower High – first warning about changing the structure to down.
LL: Lower Low – confirmed a potential change to downside.
HL (x2): two more higher lows – suggest a possible return to growth.
📊 Stochastic RSI (at the bottom of the chart)
The oscillator is currently in the overbought zone (>80), approaching a downward crossover.
It suggests a possible short-term halt in growth or correction.
But in strong trends it may "stick" to the upper range.
📌 Potential scenarios:
🟢 Bullish:
If the price breaks above 109.341, it may test 111.814 and then 115.802.
Continuation of the HL → HH formation will confirm a trend reversal and further growth.
🔴 Bearish:
If the price does not stay above 109k and breaks below 105.370, there is a risk of a test of 102.650 and lower.
A break of 100.095 and especially 98.213 will negate the growth structure.
🧠 Conclusions:
The market is at a key decision point - HL formation vs. resistance zone.
Buyers' strength will be confirmed only after breaking 111-112k.
Stochastic RSI warns of potential pullback or consolidation.

I have shorted gold as expected and held on patientlyEven under the influence of the ADP data, which is bullish for the gold market, gold has not effectively broken through 3350, and even showed signs of falling back after rising several times. The resistance above is becoming more and more obvious, which may further weaken the market's bullish sentiment and confidence, thereby strengthening the dominance of the bears.
Although gold has not effectively fallen yet, from the perspective of the gold structure, even if gold wants to rise, it still needs to be backtested and support confirmed before rising, and the current retracement is far from enough, so gold still has a need for structural retracement; and before the NFP market, gold rose slowly but was far from enough to break upward, and there was no volume support, so the illusion of gold rising may be to lure and capture more bulls;
Therefore, out of caution, I try to avoid chasing gold at high levels; and I believe that shorting gold is still the first choice for short-term trading at present. And I have executed short trades in the 3340-3350 area according to the trading plan, and held it patiently. I hope that gold can retreat to the 3320-3310-3300 area as expected.

AERO Long Swing Setup – Strong Pullback into Fibonacci SupportAERO has shown notable strength in recent months and is now retracing into a key support zone, aligning with the 38.2% Fibonacci level. The $0.75–$0.80 area offers a solid long swing opportunity.
📌 Trade Setup:
• Entry Zone: $0.75 – $0.80
• Take Profit Targets:
o 🥇 $1.04 – $1.32
o 🥈 $1.60 – $2.05
• Stop Loss: Daily close below $0.70

BTC shorting opportunity comes againBTC climbed above 108000 again, and the short-term bullish power was slightly stronger. According to the current strength, BTC still has room for growth, but it is still under pressure in the 109000-110000 area in the short term; if there is no major positive news, BTC may find it difficult to break through the resistance area in the short term under the current conditions, and may even experience stagflation and retreat again after approaching the resistance area.
Therefore, I think shorting BTC with the help of the resistance area is still the first choice for short-term trading. We can boldly short BTC in the 108500-109500 area and look towards the target area around 106000 again.

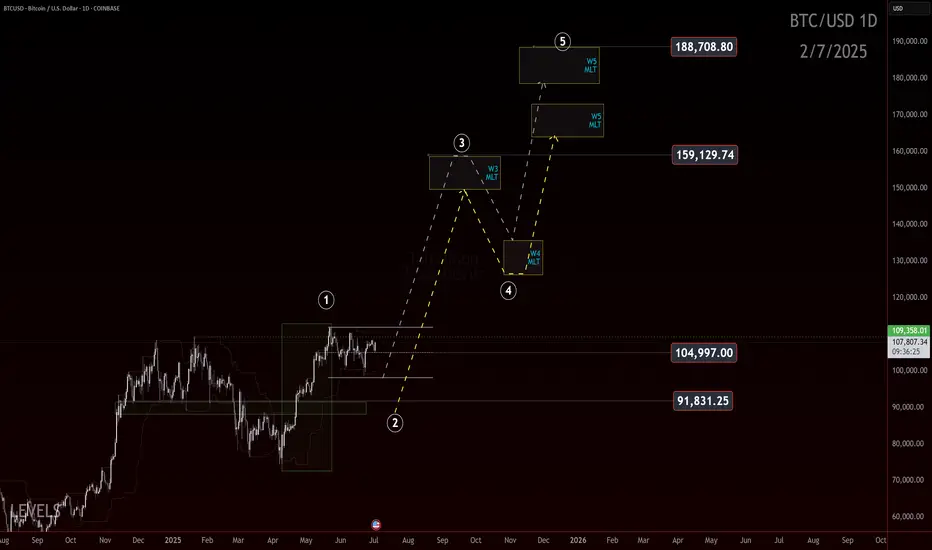
Bitcoin: 170k–180k?If you find this information inspiring/helpful, please consider a boost and follow! Any questions or comments, please leave a comment!
Bitcoin: 170k to 180k?
Let’s talk bias.
We’ve seen a powerful move off the 75k low, and it’s hitting some markers of a potential wave 1 impulse. If that structure holds and price doesn’t come back to wipe out the lows in a wave 2 retracement, then this is what we’d be looking at.
The idea? This is a conservative roadmap built off Elliott Wave Fibonacci projections and it targets the 170k to 180k zone.
Now, let’s be clear. This is a conservative projection. We’re not talking hopium fueled 250k moon targets here. We have no proof of that yet. We're anchoring the wave count and saying: if this is a 1, we’re due a 2, and then a 3 takes us to the upper levels.
But there’s a catch. Always is.
If price starts to fade back through the 91.8k area in a deep aggressive retrace, this roadmap gets less likely. Breaking the 75k pivot means the impulse structure failed or was misread, and we shift the count.
Until then, the 170k–180k level is a possible destination based on this roadmap.
Trade Safe!
Trade Clarity!
ada usdt scalp tradeshort term pullback expected from ada, cardano so take it with small amount, trade entry based on 5m, so don't expect bigger targets. must use sl.

Quick BB updates - Minor MovementAs we've observed, it appears we're currently in a Minor Cycle at the end of the 4th wave, aligning closely with the Fibonacci target for this wave.
The last financial quarter delivered strong results, and I genuinely like the direction the company is heading. In my view, this could represent the most significant core business shift in the past 30 years.
As always, please do your own research before investing, this is not financial advice.
Have a blessed week!

PARTI Setup: Key Reversal Zone Could Spark +50% RallyToday, I want to analyze the Particle Network ( BINANCE:PARTIUSDT ) project for you, which has a chance of increasing by +20% to +50% in the short term .
Let's first take a look at the fundamental state of the Particle Network (PARTI) project .
Particle Network is building a modular Layer-1 blockchain with a focus on Chain Abstraction, aiming to unify user experiences across multiple chains through:
Universal Accounts – Single account across all chains
Universal Liquidity – Access liquidity without bridging
Universal Gas – Seamless cross-chain transactions without gas token concerns
The project has:
Raised $25M+ funding from top-tier investors (Binance Labs, Animoca Brands, Spartan Group)
Integrated with 60+ blockchains and 900+ dApps
Reached over 1.3M testnet accounts and 27,100 daily transactions (Messari Q1 2025 report)
Recently launched UniversalX (a cross-chain DEX) as its flagship dApp
Summary:
Particle Network shows strong fundamentals with innovative tech, a growing ecosystem, and backing from major players in crypto. Long-term success will depend on user adoption of Universal Accounts and dApps like UniversalX.
------------------------------------------------------
Now let's take a look at the PARTI token chart on the daily time frame .
PARTI token is currently trading near Potential Reversal Zone(PRZ) , Monthly Support(2) . There is also a possibility of a Range channel forming, we should wait for the confirmation of the second bottom .
I expect the PARTI token to start rising again from the Potential Reversal Zone(PRZ) and near $0.14 .
Note: Stop Loss(SL)= $0.1177
Please respect each other's ideas and express them politely if you agree or disagree.
Particle Network Analyze (PARTIUSDT), Daily time frame.
Be sure to follow the updated ideas.
Do not forget to put a Stop loss for your positions (For every position you want to open).
Please follow your strategy and updates; this is just my Idea, and I will gladly see your ideas in this post.
Please do not forget the ✅' like '✅ button 🙏😊 & Share it with your friends; thanks, and Trade safe.

SOLUSDT Holding Long Term Trendline SupportSOLUSDT continues to show strong bullish structure, with price consistently holding above a multi-year ascending trendline a key structural element that has defined its uptrend. This dynamic support has anchored price action within a broader ascending formation, reflecting steady long-term accumulation.
Additionally, the chart reveals a well defined Cup and Handle formation, further reinforcing the bullish outlook. As long as price respects the immediate demand zone, this area remains a prime region for re-accumulation, with expectations for it to hold as a firm support level.
The projected target for this setup is clearly illustrated on the chart, aligning with the broader bullish continuation narrative.
Share your view, do you see SOLUSDT pushing higher from here, or is a deeper retest likely before the breakout?

Doge Buy / Long SetupDoge has some Bullish Momentum, Invalidation if 4hrs closes below the mentioned point, then close on entry, otherwise wick doesn't matter. If tp achieved first then Cancel the trade.

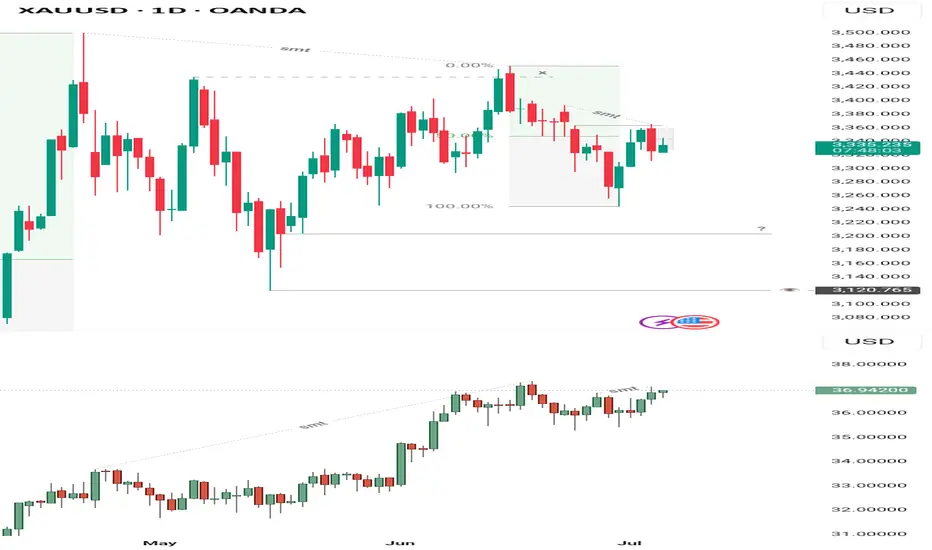
Gold-Silver Discrepancy Analysis – Reevaluation After NFP ReactiAfter taking a loss yesterday, I had to reassess my outlook on Gold. The market behavior leading into and following the NFP event revealed significant discrepancies between Gold and Silver that can’t be ignored.
Since April 24th — the day Gold printed its highest price in human history — the daily chart has shown consistent lower low formations. In contrast, Silver had been forming higher highs on the daily during this same period, showing relative strength.
However, this dynamic began to shift. On the 4-hour chart, Silver is now printing lower lows from last month’s high, aligning more closely with Gold, which has been bearish on both the daily and 4-hour timeframes since its peak.
A key moment occurred just before the NFP release: Silver made a strong run above last week’s high, while Gold failed to even trade above Wednesday’s high — which coincides with the gap fill from last week Tuesday’s open. This divergence in price behavior is crucial.
Gold closed yesterday with a full-bodied bearish engulfing candle, rejecting that same gap area. Meanwhile, Silver’s breakout above last week’s high, despite its internal weakness, is a clear discrepancy of value.
Now, with Silver beginning to shift into lower low structure on the daily and no bullish market structure shift present on the 4-hour chart, the bullish narrative weakens. This divergence between both metals—especially as Silver shows signs of internal breakdown—suggests a high-probability case that the market may be preparing for a broader downside move rather than continuation to the upside.
That said, the key level at 3225/3200, which I marked during my previous bullish outlook, remains on watch. Price reaction at this zone will be critical in determining whether the market still has a chance to reclaim bullish intent or if the short bias continues to play out. If the bearish pressure holds, 3120 becomes a likely target—and a deeper fall toward 2960 wouldn’t be surprising either, considering it aligns with a key discount zone from the weekly timeframe.
UXLINK price powerfully pumping😱 Totally manipulative asset - $UXlink
When all the altos are growing, OKX:UXLINKUSDT price is in a falling consolidation, when most altos start to “feel bad”, then #UXLINK is pummped.
Now, the MM's goal is obvious - to break the feet of shorts and organize a “short squeeze” and sell a large portion of the asset at high volumes.
Therefore:
1️⃣ Don't shorts - it's too early.
2️⃣ Move your stops at a long position or use a trigger stop.
3️⃣ Short squeeze - are close, above $1.20, it will be sharp... to $1.30 or even to $1.50, or even to $2.15... it is unknown, time will tell)
The only thing that is known is that those who like to trade such manipulative assets will get an unforgettable adrenaline rush, but afterwards the taste will be twofold...
Better watch without participating!)
P.S:
we would buy, not earlier than at $0.26-0.32
_____________________
Did you like our analysis? Leave a comment, like, and follow to get more

ENA SCALP & Intraday Setup Both Long & Short SetupWait for the entries to be filled first. If short entry achieved first then go for the short, if long entry achieved first then go for the long, in both cases must use SL, cause it's consolidating in a range, any side impulse move is expected from ena.

Let's fire it up!BTC has to break $110,217.2 for good, and then I'd say we're off to the moon and beyond.
