Wheat — moving downWe’re starting to move down.
The first target is the 15,200–15,400 range.
The main one is 14,300. We could even drop lower, but it’s too early to say for sure.
---
Please subscribe and leave a comment.
You’ll get new information faster than anyone else.
Together, we’ll grow and become wealthier.
---
Fibonacci

NVDA Wave Analysis – 4 December 2025- NVDA reversed from support zone
- Likely to rise to resistance level 194.30
NVDA recently reversed with the daily Hammer from the support zone between the multi-month support level 170.00 (which has been reversing the price from August), lower daily Bollinger Band and the support trendline of the daily down channel from October.
NVDA just broke the aforementioned down channel from October – which is lily to strengthen the bullish pressure on NVDA .
Given the clear daily uptrend, NVDA can be expected to rise to the next resistance level 194.30 (which reversed the price at the end of November).

TSLA — [2D] WEEK 49 TREND REPORT | 12/04/2025TSLA — WEEK 49 TREND REPORT | 12/04/2025
Ticker: NASDAQ:TSLA
Timeframe: 2D
This is a reactive structural classification of TSLA based on the weekly chart as of this timestamp. Price conditions are evaluated as they stand — nothing here is predictive or forward-assumptive.
⸻
1) Current Trend Condition [ Numbers to Watch ]
Current Price @ 447.66$
• Trend Duration : +7 Days (Bullish)
• Trend Reversal Level ( Bearish ): 418.70$
• Trend Reversal Level ( Bearish Confirmation ): 428.42$
• Pullback Support : 413.70$
• Correction Support : 354.94$
⸻
2) Structure Health
• Retracement Phase:
Uptrend (operating above 78.6%)
• Position Status:
Healthy (price above both structural layers)
⸻
3) Temperature :
Warming Phase
⸻
4) Momentum :
Bullish
⸻
Author’s Note
UPWARD STRUCTURAL ALIGNMENT
This mark reflects a point where market behavior supported the continuation of the existing upward direction. It does not imply forecasting or targets — it simply notes where strength became observable within the current trend. Its meaning holds only while price continues to respect the broader structural levels that define the trend.
⸻
Methodology Overview
This classification framework evaluates directional conditions using internal trend-interpretation logic that references price behavior relative to its structural layers. These relationships are used to identify when price movement aligns with the framework’s criteria for directional phases, transition points, or regime shifts. Visual elements or structural labels reflect these internal interpretations, rather than explicit trading signals or preset indicator crossovers. This framework is observational only and does not imply future outcomes.

#ETHUSDT: Price is yet to drop around $1780 area before bullsETHUSDT is likely to fall further to around $1900 or $1800. This area appears more promising and has strong bullish volume. We should wait for price confirmation before entering.
If you like our idea, please like and comment. Also, use accurate risk management.
Team Setupsfx_

AMD — [2D] WEEK 49 TREND REPORT | 12/04/2025AMD — WEEK 49 TREND REPORT | 12/04/2025
Ticker: NASDAQ:AMD
Timeframe: 2D
This is a reactive structural classification of AMD based on the weekly chart as of this timestamp. Price conditions are evaluated as they stand — nothing here is predictive or forward-assumptive.
⸻
1) Current Trend Condition [ Numbers to Watch ]
Current Price @ 217.20$
• Trend Duration : +27 Days (Bearish)
• Trend Reversal Level ( Bullish ): 226.29$
• Trend Reversal Level ( Bearish Confirmation ): 210.93$
• Pullback Support : 226.29$
• Correction Support : 194.27$
• Structural Support : 149.29$
⸻
2) Structure Health
• Retracement Phase:
Correction (approaching 61.8%)
• Position Status:
Caution (interacting with structural layers)
⸻
3) Temperature :
Neutral Phase
⸻
4) Momentum :
Coiling
⸻
Methodology Overview
This classification framework evaluates directional conditions using internal trend-interpretation logic that references price behavior relative to its structural layers. These relationships are used to identify when price movement aligns with the framework’s criteria for directional phases, transition points, or regime shifts. Visual elements or structural labels reflect these internal interpretations, rather than explicit trading signals or preset indicator crossovers. This framework is observational only and does not imply future outcomes.

DKNG eyes on $34.74: Golden Genesis break could mark the BOTTOMDKNG trying to recover from its downtrend.
Now testing a Golden Genesis fib at $34.74
Look for a Break-n-Retest for long entries.

SilverDivergence, Double top then Triple Top, Rising wedge, Resistance played its role now, trend line is at breakup point. I guess its a retracement of silver till Fib 0.382

ACN watch $277-280: Double Golden fibs may give a DIP to buyACN has been trying to recover from its downtrend.
Now testing a Double Golden zone at $277.52-280.31
Look for a Dip-to-Fib to go long, or a Break-n-Retest

YETI watch $43.63 above, 41.20 below: Double Goldens may CAPTUREYETI has been trying to paint a bottom to its downtrend.
Trying to break out of a Double Golden zone at $41.20-43.63
Look for some consolidation within the zone then re-launch.

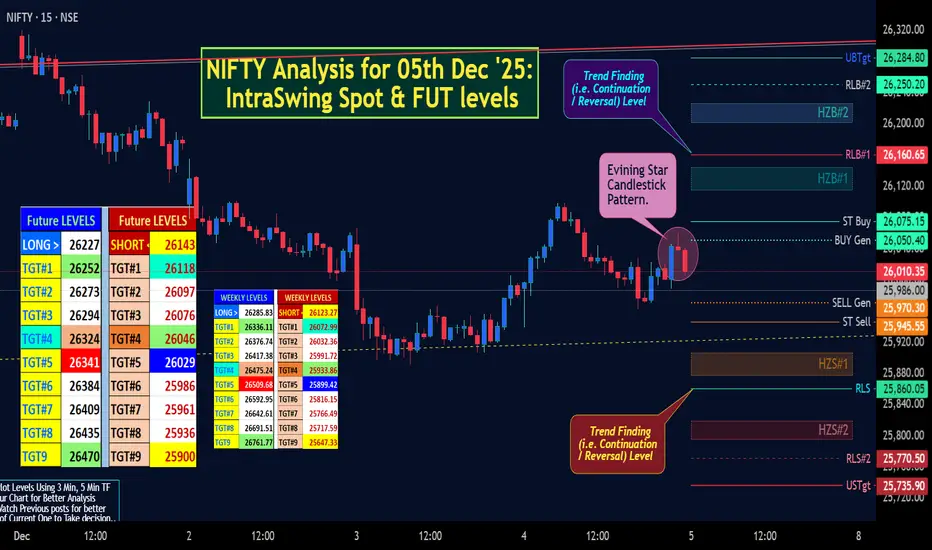
NIFTY Analysis for 05th Dec '25: IntraSwing Spot & FUT levelsStructured outlook, breaking down the key factors:
1. The Prevailing Market Context (Likely Scenario in Dec 2025)
While cannot predict exact levels, can infer the probable economic setting:
Inflation Trajectory: By late 2025, headline CPI inflation is likely to be closer to the RBI's 4% target, but the focus will be on its sustainability and food price volatility.
Growth Dynamics: The Indian economy should be in a steady growth phase, but the RBI's stance will depend on global demand and domestic investment cycles.
Global Cues: The stance of the US Federal Reserve (likely in a rate-cutting cycle or on hold by then) and global risk sentiment will be crucial.
Domestic Liquidity: The banking system's liquidity conditions will be a key factor the RBI addresses.
2. Market Expectations from RBI (The Core Catalyst)
The price action will be driven by whether the outcome is Hawkish, Dovish, or Neutral relative to these expectations.
Consensus Expectation (Baseline): The most likely scenario is the RBI maintaining the Repo Rate unchanged with a stance of "withdrawal of accommodation" or a shift to "neutral." The focus will be on:
Growth-Inflation Forecasts: Revisions to FY26 GDP and CPI projections.
Liquidity Management: Comments on permanent vs. temporary liquidity tools.
Governor's Commentary: Tone on food inflation, global spillovers, and future guidance.
3. Key Sectors to Watch
Rate Sensitives: Banks (HDFC Bank, ICICI Bank, SBI), NBFCs (Bajaj Finance), Auto, Real Estate. Maximum volatility.
Domestic Cyclicals: Infrastructure, Capital Goods. Reaction to RBI's growth outlook.
Defensives: IT, Pharma, FMCG. Could see safe-haven flows if the tone is hawkish.
[ Level Interpretation / description:
L#1: If the candle crossed & stays above the “Buy Gen”, it is treated / considered as Bullish bias.
L#2: Possibility / Probability of REVERSAL near RLB#1 & UBTgt
L#3: If the candle stays above “Sell Gen” but below “Buy Gen”, it is treated / considered as Sidewise. Aggressive Traders can take Long position near “Sell Gen” either retesting or crossed from Below & vice-versa i.e. can take Short position near “Buy Gen” either retesting or crossed downward from Above.
L#4: If the candle crossed & stays below the “Sell Gen”, it is treated / considered a Bearish bias.
L#5: Possibility / Probability of REVERSAL near RLS#1 & USTgt
HZB (Buy side) & HZS (Sell side) => Hurdle Zone,
*** Specialty of “HZB#1, HZB#2 HZS#1 & HZS#2” is Sidewise (behaviour in Nature)
Rest Plotted and Mentioned on Chart
Color code Used:
Green =. Positive bias.
Red =. Negative bias.
RED in Between Green means Trend Finder / Momentum Change
/ CYCLE Change and Vice Versa.
Notice One thing: HOW LEVELS are Working.
Use any Momentum Indicator / Oscillator or as you "USED to" to Take entry.
⚠️ DISCLAIMER:
The information, views, and ideas shared here are purely for educational and informational purposes only. They are not intended as investment advice or a recommendation to buy, sell, or hold any financial instruments. I am not a SEBI-registered financial adviser.
Trading and investing in the stock market involves risk, and you should do your own research and analysis. You are solely responsible for any decisions made based on this research.
"As HARD EARNED MONEY IS YOUR's, So DECISION SHOULD HAVE TO BE YOUR's".
Do comment if Helpful .
Follow notification about periodical View
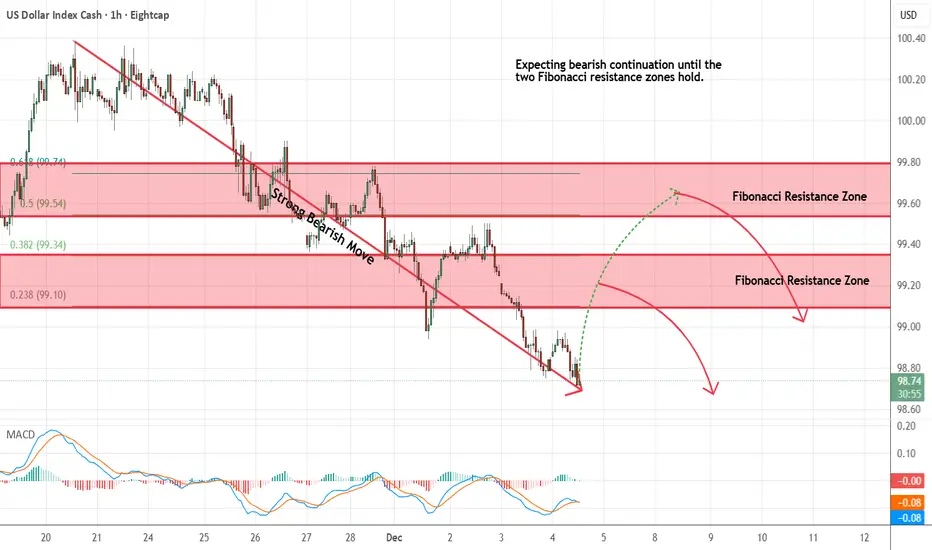
US Dollar Index - Looking To Sell Pullbacks In The Short TermH1 - Strong bearish move.
No opposite signs.
Expecting bearish continuation until the two Fibonacci resistance zones hold.
If you enjoy this idea, don’t forget to LIKE 👍, FOLLOW ✅, SHARE 🙌, and COMMENT ✍! Drop your thoughts and charts below to keep the discussion going. Your support helps keep this content free and reach more people! 🚀
-------------------------------------------------------------------------------------------------------------------
GIFTNIFTY IntraSwing Levels for 04th Dec '25
Macro Cues: RBI commentary hints at steady rates amid inflation (CPI at 5.5% YoY); Putin-Modi summit (Dec 4-5) eyed for defense/energy boosts, but no major announcements yet. Sectoral: IT resilient (+0.5%), banks drag (-0.8%) on rupee pressure.
[ Level Interpretation / description:
L#1: If the candle crossed & stays above the “Buy Gen”, it is treated / considered as Bullish bias.
L#2: Possibility / Probability of REVERSAL near RLB#1 & UBTgt
L#3: If the candle stays above “Sell Gen” but below “Buy Gen”, it is treated / considered as Sidewise. Aggressive Traders can take Long position near “Sell Gen” either retesting or crossed from Below & vice-versa i.e. can take Short position near “Buy Gen” either retesting or crossed downward from Above.
L#4: If the candle crossed & stays below the “Sell Gen”, it is treated / considered a Bearish bias.
L#5: Possibility / Probability of REVERSAL near RLS#1 & USTgt
HZB (Buy side) & HZS (Sell side) => Hurdle Zone,
*** Specialty of “HZB#1, HZB#2 HZS#1 & HZS#2” is Sidewise (behaviour in Nature)
Rest Plotted and Mentioned on Chart
Color code Used:
Green =. Positive bias.
Red =. Negative bias.
RED in Between Green means Trend Finder / Momentum Change
/ CYCLE Change and Vice Versa.
Notice One thing: HOW LEVELS are Working.
Use any Momentum Indicator / Oscillator or as you "USED to" to Take entry.
⚠️ DISCLAIMER:
The information, views, and ideas shared here are purely for educational and informational purposes only. They are not intended as investment advice or a recommendation to buy, sell, or hold any financial instruments. I am not a SEBI-registered financial adviser.
Trading and investing in the stock market involves risk, and you should do your own research and analysis. You are solely responsible for any decisions made based on this research.
"As HARD EARNED MONEY IS YOUR's, So DECISION SHOULD HAVE TO BE YOUR's".
Do comment if Helpful .
Follow notification about periodical View
In depth Analysis will be added later (If time Permits)

Silver – Can the Break to Record Highs Be Maintained?Silver’s impressive upside run so far this week, which has seen it trade from a low of 56.165 on Monday to register a new record high at 58.96 yesterday, seems to be taking a pause in early trading on Thursday morning, with the price currently trading down around 1.8% at 57.44 at time of writing (0700 GMT).
With liquidity in the Silver market nowhere near as deep as in its bigger parent Gold, these types of exaggerated moves can happen more frequently, especially when trading at new extremes such as the record high that was reached a mere 24 hours ago. Where Silver moves next into the weekend may be determined by a combination of factors, such as positioning, performance of the US dollar and technical factors.
From a positioning standpoint, the debasement trade which has been underpinning much of Silver’s rally over the last 3-6 months still remains in place but can at times be subject to pullbacks as the trade can get crowded and this may be part of the reason for the drop this morning. There could be potential for further profit taking into Friday’s close, especially with the pivotal Federal Reserve interest rate decision now less 7 days away (December 10th).
From the US dollar point of view, as mentioned above, with the Fed rate decision now around the corner, traders may be more sensitive to the release of any available US labour market data. Today’s scheduled release of the Challenger Job Cuts at 1230 GMT and Weekly Jobless Claims at 1330 GMT could lead to further US dollar volatility, which may impact Silver prices. As a general rule a higher dollar makes Silver more expensive for foreign investors and vice versa.
Finally, interlinked with these two drivers are the technicals. Whether key support or resistance levels hold or a broken on a closing basis could lead to bigger directional moves into the weekend or early next week. So being apprised of these levels in advance can be prudent from a risk management approach.
Technical Update: Can New All-Time Highs Maintain The Push Higher?
Silver has enjoyed a positive late‑November to early‑December period, advancing more than 21% from the November 21st low of 48.62 to Wednesday’s 58.96 high. This move has produced new all‑time highs, with fresh upside acceleration following the closing break above the previous 54.45 October 17th record high.
While it might be argued that this type of price activity remains constructive with the potential for further gains, some traders may view the latest upside moves as becoming over‑extended, raising the risk of future price weakness.
In this environment, staying aware of relevant support and resistance levels may prove valuable in gauging Silver’s next directional themes.
Possible Resistance Levels: .
New all‑time highs place price activity into uncharted territory, making it difficult to establish valid resistance levels. In such cases, Fibonacci extensions can provide valuable guidance, highlighting potential areas where fresh selling pressure may emerge once more.
For Silver, Fibonacci extension calculations based on the last significant correction seen between October 17th and October 28th suggest that current price strength may be approaching a potential resistance at 59.79, which is the 61.8% extension level.
A closing break above 59.79 might now be required to open scope for a push to higher levels like the 100% extension level which sits at 63.15.
Possible Support Levels:
It is often difficult to determine with certainty when upside conditions have become over‑extended and of course this alone doesn’t guarantee price weakness. As such, closing breaks below support may be required to trigger a corrective phase in price. In the case of Silver, traders may view Monday’s session low of 56.16 as the first support.
Closing breaks below the 56.16 level, if seen, could reinforce the possibility of over‑extended upside conditions leading to continued price weakness. Such moves could open the way for tests of 54.95, which is the 38.2% Fibonacci retracement, and possibly even extend toward 53.75, the deeper 50% retracement level.
The material provided here has not been prepared accordance with legal requirements designed to promote the independence of investment research and as such is considered to be a marketing communication. Whilst it is not subject to any prohibition on dealing ahead of the dissemination of investment research, we will not seek to take any advantage before providing it to our clients.
Pepperstone doesn’t represent that the material provided here is accurate, current or complete, and therefore shouldn’t be relied upon as such. The information, whether from a third party or not, isn’t to be considered as a recommendation; or an offer to buy or sell; or the solicitation of an offer to buy or sell any security, financial product or instrument; or to participate in any particular trading strategy. It does not take into account readers’ financial situation or investment objectives. We advise any readers of this content to seek their own advice. Without the approval of Pepperstone, reproduction or redistribution of this information isn’t permitted.

EURGBP 1HA structured approach to market analysis combining Fibonacci retracement levels with key Support & Resistance zones.
Price action is monitored to identify reaction points, liquidity zones, and potential reversal or continuation setups.
The analysis focuses on high-probability confluence areas where Fibonacci ratios align with historical structure levels, helping traders spot optimal entry points, stop-loss zones, and profit-taking targets.

USDCAD 1H A structured approach to market analysis combining Fibonacci retracement levels with key Support & Resistance zones.
Price action is monitored to identify reaction points, liquidity zones, and potential reversal or continuation setups.
The analysis focuses on high-probability confluence areas where Fibonacci ratios align with historical structure levels, helping traders spot optimal entry points, stop-loss zones, and profit-taking targets.

XAU/USD: Buy Gold on Support Retest, Bullish StructureGold continues to fluctuate within a compression model + ascending support, indicating that selling pressure is weakening and the market wants to accumulate before bouncing to the upper supply zones.
Recent data shows USD cooling as the market increases expectations that the FED will be more dovish → creating a support base for XAU/USD's short-term rise.
📊 Technical Analysis – H1 Frame (MMF Flow)
1️⃣ Key Support:
4,187 – 4,188: BUY zone + lower trendline + strong price reaction.
Price just retested and bounced → confirming active buying remains.
2️⃣ Near Resistance:
4,211 – 4,212: mid-liquidity zone → expected to create HL before breaking the downtrend line.
3️⃣ Main Target Zone:
4,236 → strong resistance, confluence multiple times from the market.
Further: 4,254 → large supply zone, is an extended target if price breaks out.
🧭 Trading Scenario According to MMF
Main Scenario – BUY with Trend
BUY again when price retests 4,187 – 4,188 or
BUY when price breaks 4,212 then retests.
TP Targets:
TP1: 4,212
TP2: 4,236
TP3: 4,254
SL: below 4,182.
Idea: price creates an absorption model + HL on trendline → potential to pull up to the upper liquidity zones.
Secondary Scenario – SELL Reaction
Only for scalp traders:
SELL reaction at 4,236 – 4,238
TP: 4,212
SL: 4,243
🎯 Daily Bias Summary
Bias: Bullish on H1 when price holds 4,187.
Priority: BUY at the bottom – SELL at the top only for scalp.
Wait for the downtrend line to break to extend the target to 4,254.

XAU/USD – Recovery structure testing 4,239 – 4,2611. Market Context
On the M30 timeframe, the previous downtrend has started to weaken. The price has formed a series of Equal Lows patterns, indicating that the short-term bottom is protected, followed by a Change of Character (ChoCH) and a slight Break of Structure (BOS). This reflects that the selling pressure has decreased in intensity and the market is transitioning into an accumulation phase, preparing for a recovery.
The downtrend line is still valid, but the price is approaching the breakout area. Closing candles above this line will confirm a phase transition.
2. Key Price Areas
Upper Supply Zone
4,239 – 4,240: the nearest strong reaction area, acting as the main resistance.
4,261: coincides with the 1.272 Fibonacci of the correction wave, a notable liquidity area.
4,282 – 4,283: expansion target, corresponding to Fibonacci 1.618.
These areas will be points where the market may show counter-reactions during the uptrend.
Lower Demand Zone
4,168 – 4,154: the Demand Zone formed from the previous strong reversal. This is the area where the market effectively absorbed selling pressure and may continue to act as support during corrections.
3. Fibo and Price Action
The current uptrend is following a standard pullback structure: from the 4,168 bottom, the price recovers to Fibonacci levels like 0.236 – 0.382, then forms a small correction before approaching the downtrend line again.
If the price surpasses the trendline, the next targets will be:
4,213 (Fibo 0.618),
then the main supply zone 4,239 – 4,240.
Closing candles above this area will pave the way for the next targets at 4,261 and 4,282.
4. Trading Plan
Buy Scenario – prioritize during correction
Early buy position: 4,188 – 4,195
(retest small structure and trendline)
Optimal buy zone: 4,168 – 4,154
(Demand Zone + deep Fibo correction)
Stop loss: below 4,150
Targets:
4,213
4,239 – 4,240
4,261
expanding to 4,282
Short-term Sell Scalp Scenario
Reaction zone: 4,227 – 4,230
(near resistance + 0.786 Fibo)
Stop loss: 4,236
Target: 4,205 – 4,195
Note: This is only a short-term strategy, not the main trend.
5. Summary
• The market structure is transitioning from a downtrend to an accumulation – recovery phase.
• If the price surpasses and holds above the trendline, the nearest target will be 4,239 – 4,240.
• The supply zones 4,239 – 4,261 – 4,282 will play a decisive role in the next uptrend.
• The most effective trading strategy remains to wait for a buy during corrections to the strong support zone 4,168 – 4,154.

Gold Breakout Confirmed — New Cycle Targets Ahead(ATH Possible)Today, I analyze Gold( OANDA:XAUUSD ) on the 4-hour timeframe, building on the previous idea shared. The scenario remains unchanged.
In this analysis, I take a cyclical approach to gold on the 4-hour chart. It appears that gold is completing three similar cycles. For the third cycle to be completed, gold needs to increase.
Another point is that gold previously formed a bull trap when it tested the Resistance zone/Support zone($4,186– $4,133), but now it has successfully confirmed a breakout above that zone. This suggests that the bull trap is no longer a concern, and gold is likely resuming its uptrend.
Additionally, gold could form a bullish channel, but we currently have only one confirmed top and are waiting for a second top to validate the channel.
Moreover, today we’ll see the release of two important U.S. economic indicators, which can significantly impact gold’s movement, especially if the actual figures deviate significantly from expectations:
ADP Non-Farm Employment Change
ISM Services PMI
Considering all of the above, we can set an initial target of around $4,267 for gold. If the cycle completes fully, gold might even reach a Potential Reversal Zone(PRZ) and possibly set a new All-Time High(ATH).
Finally, geopolitical tensions, like those between the U.S. and Venezuela, often lead to higher gold prices since gold is considered a safe haven.
First Target: $4,267
Second Target: Potential Reversal Zone(PRZ)
Stop Loss(SL): $4,147
💡 Please respect each other's opinions and express agreement or disagreement politely.
📌 Gold Analyze (XAUUSD), 4-hour time frame.
🛑 Always set a Stop Loss(SL) for every position you open.
✅ This is just my idea; I’d love to see your thoughts too!
🔥 If you find it helpful, please BOOST this post and share it with your friends.

XAU/USD – Gold Retests Bullish OB, Preparing for a Major Recover📊 Market Structure
After the Liquidity Sweep around the 4,26x highs, Gold shifted into a short-term distribution phase and formed a series of bearish ChoCHs.
However, the entire current decline remains a corrective move, as price is now approaching the Bullish Order Block at 4,155 – 4,158 USD, which is also the primary support of the prevailing trend.
The ascending trendline has not been fully broken → buyers still have structure support.
The main scenario: price may continue sweeping deeper into the Bullish OB, or even tag the Deep OB at 4,129 – 4,130 USD, before initiating a strong bullish recovery.
💎 Key Technical Zones
Bullish OB: 4,155 – 4,158 USD → primary BUY zone
Deep OB: 4,129 – 4,130 USD → safer BUY zone (deep retest)
Bearish OB: 4,211 – 4,213 USD → short-term SELL reaction
Liquidity Above: 4,239 – 4,240 USD
🎯 Trading Plan – Two Clear Scenarios
1️⃣ BUY Setup – Trend-Following Priority
When price taps the Bullish OB 4,155 – 4,158 and prints a clear rejection candle:
Entry: 4,155 – 4,158
SL: 4,128
TP1: 4,188
TP2: 4,211
TP3: 4,239
TP4: 4,260+
→ A trend-aligned setup: low risk – high reward.
→ If price does not react at the Bullish OB, wait for a deeper BUY at the Deep OB (safer).
2️⃣ SELL Scalp – For Intraday Traders Only
If price retraces into the Bearish OB 4,211 – 4,213 and shows rejection:
Entry: 4,211 – 4,213
SL: 4,225
Short TP: 4,188 → 4,175
→ This is only a reaction play. Do NOT hold long-term since the main trend remains bullish.
🧠 Vincent’s View
Gold is likely in its final corrective phase before starting a new bullish leg.
As long as 4,129 remains intact, buyers maintain full control.
Smart money is likely accumulating around the Bullish OB before pushing price back toward 4,239 – 4,260.
⚡ “Smart money always returns to where strength began — buy where the market was born.”
⏰ Timeframe: H1
📅 Updated: 04/12/2025
✍️ Analysis by: Captain Vincent

NQ Power Range Report with FIB Ext - 12/4/2025 SessionCME_MINI:NQZ2025
- PR High: 25658.75
- PR Low: 25633.75
- NZ Spread: 56.0
Key scheduled economic events:
08:30 | Initial Jobless Claims
Session Open Stats (As of 12:45 AM)
- Session Open ATR: 450.27
- Volume: 19K
- Open Int: 304K
- Trend Grade: Long
- From BA ATH: -2.7% (Rounded)
Key Levels (Rounded - Think of these as ranges)
- Long: 26636
- Mid: 25410
- Short: 23426
Keep in mind this is not speculation or a prediction. Only a report of the Power Range with Fib extensions for target hunting. Do your DD! You determine your risk tolerance. You are fully capable of making your own decisions.
BA: Back Adjusted
BuZ/BeZ: Bull Zone / Bear Zone
NZ: Neutral Zone

eth still dumping we are grinding down not being able to break resistance .in the smaller time it looks as if we will be seeing a 30% drop from current price especially if we dont break resistance line . the next major support sitting at 2200 this will give us 30% more to the down side . all im waiting for is conformation on smaller time to see a rejection from resistance.if this happens we will get a smack down. to invalidate this we would need a break of structure and see us go up to 4200 and only then will i go bullish . as of now this is looking ugly.

EME heads up at $800 then 838: Double Golden fibs to make a TOP?EME has been flying high on AI infrastructure spending.
It is about to hit Dual Golden fibs at $800.61 then 838.71
Look for a stall of the uptrend or a retrace from these fibs.
See "Related Publications" for other examples of Golden fibs in action ------>>>>>

BTCBTC is forming a double bottom right at the 0.786 Fibonacci level, an area that tends to be very strongly respected. At the same time, the upper boundary of the current distribution range can act as a technical magnet. The influx of heavy volume and the strength patterns on the daily chart significantly increase the odds of a move up to $100,000.
