DOGE in the local downtrend. Lots of energy on 1D.Hello everyone, let's take a look at the 1D DOGE to USDT chart as you can see the price has dropped below the local uptrend line.
Let's start by setting goals for the near future that we can consider:
T1 = $ 0.06843
T2 = $ 0.07035
T3 = $ 0.07241
T4 = $ 0.07513
and
T5 = $ 0.07849
Now let's move on to the stop loss in case of further market declines:
SL1 = $ 0.06040
SL2 = $ 0.05544
and
SL3 = $ 0.04919
Looking at the CHOP indicator, we can see that in the 1D range we have a lot of energy and the MACD indicator shows that we have entered a local downward trend.
Fibonaccianalysis

SOL / USDT - 1daychart, trend change?Hello everyone, let's take a look at the 1D SOL to USDT chart as you can see the price is based on the local uptrend line.
Let's start by setting goals for the near future that we can consider:
T1 - $ 35.74
T2 - $ 36.51
T3 - $ 37.15
T4 - $ 37.78
and
T5 - $ 38.63
Now let's move on to the stop loss in case of further market declines:
SL1 - $ 34.23
SL2 - $ 32.71
and
SL3 - $ 30.83
Looking at the CHOP indicator, we can see that we have a lot of energy in the 1-day interval, while the MACD indicator shows that the blue line is approaching the red line if it crosses it from the top, it may confirm that the trend has changed into a downward trend.

BTC / USDT - 1DayChartHello everyone, let's take a look at the BTC to USDT chart on a 1 day timeframe. As you can see, the price is moving above the local downtrend line.
Let's start with the designation of the support line and as you can see the first support in the near future is $ 20094 if the support breaks, the next support is $ 19,489, $ 18,677 and $ 17,639.
Now let's move from the resistance line as you can see the first resistance is $ 21,080, if you can break it the next resistance will be $ 23,260 and $ 25025.
Looking at the CHOP indicator, we can see a lot of energy in the 1-day interval and the MACD indicator shows a local upward trend.

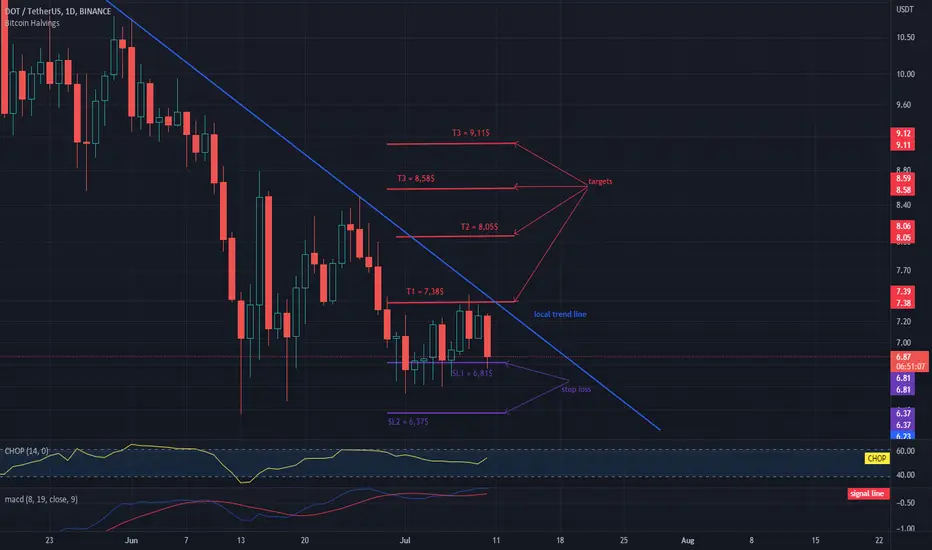
DOT / USDT 1DAY CHARTHello everyone, let's take a look at the 1D DOT to USDT chart as you can see the price is moving below the local downtrend line.
Let's start by setting goals for the near future that we can consider:
T1 = $ 7.38
T2 = $ 8.05
T3 = $ 8.58
and
T3 = $ 9.11
Now let's move on to the stop loss in case of further market declines:
SL1 = $ 6.81
and
SL2 = $ 6.37
Looking at the CHOP indicator, we can see that in the 1D range we are gaining more and more energy, and the MACD indicator shows a local upward trend.
BTC a lot of energy in the 1D interval Hello everyone, let's take a look at the BTC to USDT chart on a 1 day timeframe. As you can see, the price is moving above the downtrend line.
Let's start with the designation of the support line and as you can see the first support in the near future is $ 20,669, if the support breaks down, the next support is $ 20,020, $ 19,450 and $ 18,696.
Now let's move from the resistance line as you can see the first resistance is $ 20,954, if you can break it the next resistance will be $ 22,990, $ 24,581 and $ 26,361.
Looking at the CHOP indicator, we can see that we have a lot of energy in the 1-day interval and the MACD indicator shows that we are in a local upward trend.

Support Level for long-term, $14831On weekly chart
Look back to the past, BITSTAMP:BTCUSD dropped in range 72 - 84% at least 56% in 2020 (Covid).
Right now, BTC's dropped over 74% from ATH and it goes on downing.
I figured out a Fibo Cluster around 14800 with FiboExtension, FiboRetracement and previous ATH in 2020 acts as a support. You can see these in chart.
What next, wait and see

BNB / USDT 1D INTERVAL, STOPLOSS AND TARGETSHello everyone, let's take a look at the 1day BNB to USDT chart as you can see the price is moving above the local uptrend line.
Let's start by setting goals for the near future that we can consider:
T1 - $ 242 which price is currently struggling with,
T2 - $ 260,
T3 - $ 278,
T4 - $ 304,
and
T5 - $ 337.
Now let's move on to the stop loss in case of further market declines:
SL1 - $ 232,
SL2 - $ 223,
SL3 - $ 215,
SL4 - $ 208,
SL5 - $ 196,
and
SL6 - $ 183.
Looking at the CHOP indicator, we can see that we still have a lot of energy in the 1-day range, and the MACD indicator shows that we are in the local uptrend. Please remember that this is not an investment advice.

ETH IN A LOCAL DOWNTREND Hello everyone, let's take a look at the ETH to USDT chart over the 4 hour timeframe. As you can see, price is moving above the local uptrend line.
Let's start with the designation of the support line and as you can see the first support in the near future is $ 1211, if the support breaks down, the next support is $ 1170 and $ 1137.
Now let's move from the resistance line as you can see the first resistance is $ 1225, if you can break it the next resistance will be $ 1235, $ 1245, $ 1259 and $ 1277.
Looking at the CHOP indicator, we can see that in the 4-hour interval we are recovering energy, while the MACD indicator shows a local downward trend.

BTC SHORT 4H INTERVALHello everyone, let's take a look at the BTC to USDT chart over the 4 hour timeframe. As you can see, price is moving above the local uptrend line.
Let's start with the designation of the support line and as you can see the first support in the near future is $ 21,558, if the support breaks down, the next support is $ 21,397 and $ 21,187.
Now let's move from the resistance line as you can see the first resistance is $ 21853, if you can break it the next resistance will be $ 22,018, $ 22,018 and $ 22,244.
Looking at the CHOP indicator, we can see that in the 4-hour interval we have a lot of energy and the MACD indicator shows that we are in a local upward trend.

2022_07_09 Mr. $SPXThat's all i have to say
:)
-CharterX
// Personal ideas and knowledge i have gathered after thousands of hours of study. I share this for free but should not be considered as Financial Advice. Use at your own Risk //

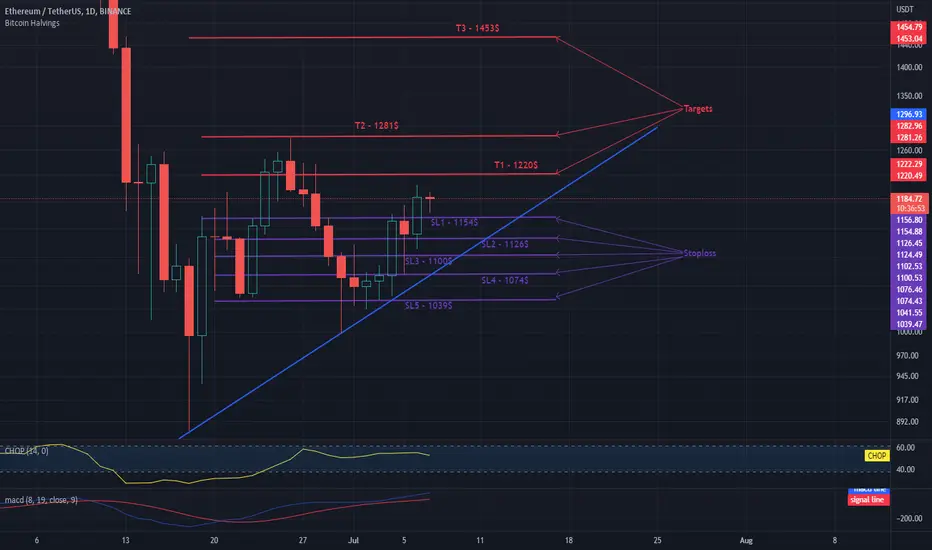
ETH 1DChart - Targets And StopLossHello everyone, let's take a look at the 1D ETH to USDT chart as you can see the price is moving below the local downtrend line.
Let's start by setting goals for the near future that we can consider:
T1 - $ 1,220
T2 - $ 1,281
and
T3 - $ 1,453
Now let's move on to the stop loss in case of further market declines:
SL1 - $ 1154
SL2 - $ 1126
SL3 - $ 1,100
SL4 - $ 1074
and
SL5 - $ 1039
Looking at the CHOP indicator, we can see that we have a lot of energy in the 1D interval and the MACD indicator shows a local upward trend.
BTC on local uptrend / 1daycahrtHello everyone, let's take a look at the BTC to USDT chart on a 1 day interval as you can see the price is moving above the local uptrend line.
Let's start with the designation of the support line and as you can see the first support in the near future is $ 20,297, if the support breaks down, the next support is $ 19,973 and $ 19,738.
Now let's move from the resistance line as you can see the first resistance is $ 20,634, if you can break it the next resistance will be $ 21,170 and $ 21,861.
Looking at the CHOP indicator, we can see that we have a lot of energy in the 1-day interval, and the MACD indicator shows that the local upward trend is maintained.

MATIC / USDT 1D chartHello everyone, let's take a look at the 1D MATIC to USDT chart as you can see the price is moving above the local uptrend line.
Let's start by setting goals for the near future that we can consider:
T1 - $ 0.5245
T2 - $ 0.5490
T3 - $ 0.5853
and
T4 - $ 0.6616
Now let's move on to the stop loss in case of further market declines:
SL1 - $ 0.5103
SL2 - $ 0.4923
SL3 - $ 0.4773
SL4 - $ 0.4634
and
SL5 - $ 0.4436
Looking at the CHOP indicator, we can see that in the 1D range we have a lot of energy, and the MACD indicator indicates the beginning of a local uptrend.

BTC maintains its bullish uptrendHello everyone, let's take a look at the BTC to USDT chart on a 1 day time frame. As you can see, the price is moving above the local uptrend line.
Let's start with the designation of the support line and as you can see the first support in the near future is $ 20,044, if the support breaks down, the next support is $ 19,768, $ 19504 and $ 19,114.
Now let's move from the resistance line as you can see, the first resistance is $ 20,643, if you can break it the next resistance will be $ 21,180 and $ 55,213,868.
Looking at the CHOP indicator, we can see that we have quite a lot of energy in the 1-day interval, while the MACD indicator shows a local upward trend.

Dollar index and negative correlation with goldHi everyone
Today, due to the fall of the eurusd and the rise of the dollar - the possibility that the dollar will rise again could have a negative impact on gold and lower the price of gold.
this is my Elliott waves analysis

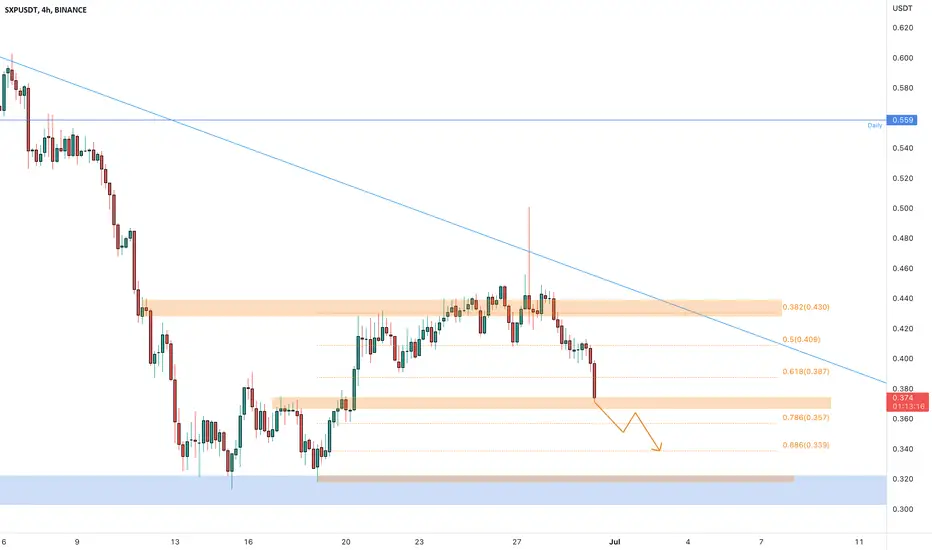
SXPUSDT wants the 0.886 Fibonacci levelThe price got a rejection from the 4h resistance at 0.44$, the the price had the dynamic daily resistance as well.
Now the price is testing the previous resistance as new support above the 0.786 Fibonacci level.
How to approach it?
IF the price is going to lose the support and retest it as new resistance, we could see a bearish impulse until 0.886 Fibonacci level, so According to Plancton's strategy , we can set a nice order
–––––
Keep in mind.
🟣 Purple structure -> Monthly structure.
🔴 Red structure -> Weekly structure.
🔵 Blue structure -> Daily structure.
🟡 Yellow structure -> 4h structure.
–––––
Follow the Shrimp 🦐
BTC/USDT Perpetual ContractDear valued Investors and Traders,
I reckon you guys to entry at my sign 'entry', and take profit at my sign 'Potential Target 1 and 2'
Practice makes perfect! Always!
Share your analysis as well sounds better!
Comments and inputs are super appreciated!
Thanks
Cheers,
PS: Please DYOR before entry the market

SAND/USDT Perpetual ContractDear Sir or Madam,
I was just made a simple draft about to short ing SAND/USDT
I saw SAND just made a spike today and I decide to doing short
I reckon you guys to entry at my sign "in entry"
And take profit at my sign "Potential Target 1 and 2".
I am here just wanna share my analysis.
How about yours? share to me
Enjoy your profit! Good luck!
Regards,

Balancer USDT trading and levels update-Long breakout today?BINANCE:BALUSDT
My trade update - I took a short and then a long on Balancer yesterday.
I update you on how I'll be trading it today.
Not Financial advice. DYOR. Papertrade before using real money.
Safe trading!
Shawn

BTC in a local downtrendHello everyone, let's take a look at the BTC to USDT chart over the 4 hour timeframe. As you can see, price is moving above the local uptrend line.
Let's start with the designation of the support line and as you can see the first support in the near future is $ 19,639, if the support breaks down, the next support is $ 19,441 and $ 19,150.
Now let's move from the resistance line as you can see the first resistance is $ 19,755, if you can break it the next resistance will be $ 19,886, $ 20,022 and $ 20,230.
Looking at the CHOP indicator, we can see that in the 4-hour interval the energy is slowly increasing and the MACD indicator indicates entering a local downward trend.

XRP - USDT on 1H interval shortHello everyone, let's take a look at the 1H XRP to USDT chart as you can see the price is moving below the local downtrend line.
Let's start by setting goals for the near future that we can consider:
T1 - $ 0.3171
T2 - $ 0.3199
T3 - $ 0.3220
T4 - $ 0.3243
and
T5 - $ 0.3275
Now let's move on to the stop loss in case of further market declines:
SL1 - $ 0.3142
SL2 - $ 0.3097
and
SL3 - $ 0.3052
Looking at the CHOP indicator, we can see that in the 1H range, energy has been used, and the MACD indicator shows that the blue line is approaching the intersection of the red one from below, which would confirm a local uptrend.

ADA/USDT 1D INTERVALHello everyone, let's take a look at the 1D ADA to USDT chart as you can see the price is moving below the local downtrend line.
Let's start by setting goals for the near future that we can consider:
T1 - $ 0.4563
T2 - $ 0.4698
T3 - $ 0.4807
and
T4 - $ 0.4909
Now let's move on to the stop loss in case of further market declines:
SL1 - $ 0.4437
and
SL2 - $ 0.4213
Looking at the CHOP indicator, we can see that in the 1D range we have a lot of energy and the MACD indicator shows that we can enter an upward trend locally.

KAVAUSDT is testing the 0.618 Fibonacci levelThe price is testing the 0.618 Fibonacci level on the 4h timeframe after a bounce from the 1.4$ support where the market created a double bottom. The price lost the 4h support at 1.9$ and retest it as new resistance.
how to approach it?
IF the price is going to lose the local 4h support at 1.7$ (on 0.618 Fibonacci level) and retest it as new resistance, According to Plancton's strategy , we can set a nice order
–––––
Keep in mind.
🟣 Purple structure -> Monthly structure.
🔴 Red structure -> Weekly structure.
🔵 Blue structure -> Daily structure.
🟡 Yellow structure -> 4h structure.
–––––
Follow the Shrimp 🦐
