XRP Pullback Play — 0.786 Fib Meets Sell-Side LiquidityXRP is currently in a pullback phase. The next high-probability long setup is at the 0.786 Fibonacci retracement, aligning with a Sell-Side Liquidity (SSL) zone.
🟢 Long Trade Setup
Entry Zone: 0.786 retracement
Stop-Loss: Below $2.80
Take-Profit 1: $3.00 (mOpen)
💡 Educational Insight
Sell-Side Liquidity (SSL) represents the pool of stop-losses and pending buy orders resting below recent swing lows. Price often seeks these liquidity pockets before reversing.
The 0.786 retracement aligns with this SSL zone, creating a high-probability setup.
However, confirmation should come from order flow → monitoring absorption, delta shifts, or footprint imbalances at this level will validate whether buyers are stepping in before entering.
🔍 Indicators used:
DriftLine — Pivot Open Zones → For identifying key yearly/monthly/weekly/daily opens that act as major S/R reference points
➡️ Available for free. You can find it on my profile under “Scripts” and apply it directly to your charts for extra confluence when planning your trades.
_________________________________
💬 If you found this helpful, drop a like and comment!
Fibonacci Retracement

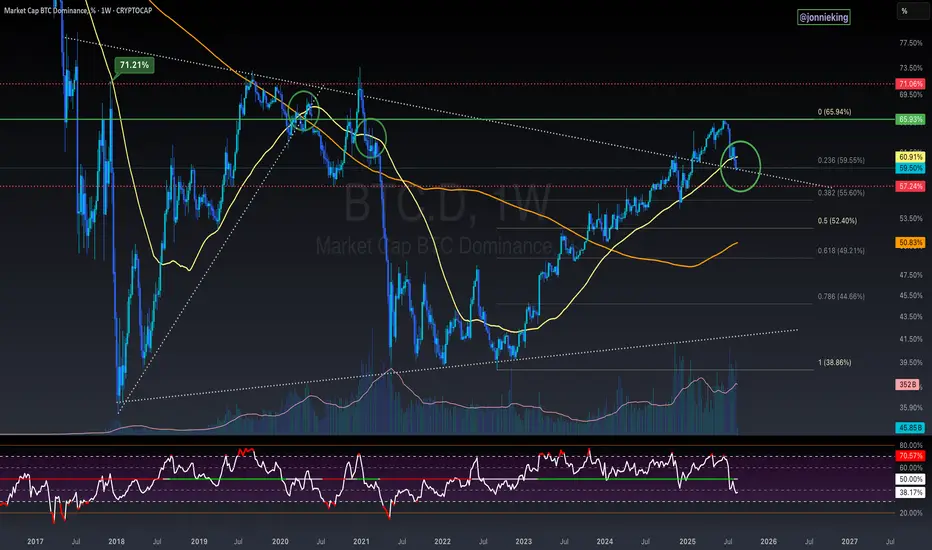
$BTC.D On the Cusp Of Breaking Down - What to WatchNothing too exciting to write home about for the Weekly Closes today, but ₿itcoin Dominance shows continued signs of breaking down, now closing the past 2 weeks below the 50WMA.
If we get one more decisive Weekly close beneath it, I’d feel very comfortable calling Alt Season.
BTC.D is also on the verge of breaking below the 8-year trendline, as well as the 0.236 Fib which would add confluence.
Breaking below 57% should seal the deal.
This will be a big week to watch.
XRPUSDT 4h chart📊 key levels
• Resistance:
• 3,3847 USDT (closest to strong resistance - earlier peaks).
• 3,2337 USDT (local resistance, now supply zone).
• Support:
• 3,1374 USDT (next support, currently tested).
• 2,9812 USDT (strong support, defense of buyers).
• 2,7390 USDT (key support below, loss = Possible strong descent).
⸻
📈 market structure
• The price is currently 3,0937 USDT, consolidates between 3,1374 and 2,9812.
• You can see a few attempts to break up, but each ends with a quick withdrawal → the market in consolidation.
• The medium -term trend (looking from the beginning of August) was upward, but we currently have a correction lateral phase.
⸻
🔎 What to observe
• Bulling: If the course breaks and persists above 3,1374, the goal will be 3.23 → Then the resistance test 3.38.
• Bears Breaking: If the course drops below 2,9812, then a possible descent around 2.74.
⸻
⚡ Fast rating
• The market is now in neutral consolidation.
• Short -term players should observe the reaction to 3,1374 and 2.9812.
• Only breaking out this range will give a bright direction.

XLMUSDT → Consolidation before rally to 0.4700BINANCE:XLMUSDT is recovering after a fairly aggressive decline, the purpose of which was to consolidate potential and retest trend support. The chart shows signs of a bullish movement...
The growth of BTC and ETH and the decline in Bitcoin's dominance index give altcoins a chance. The market is generally bullish, and in the second half of this week, we encountered a correction that has most likely come to an end. XLM has a fairly strong support line, above which the bulls are aggressively holding the price.
XLM is rebounding from the upward support line. The price returned to the trading range of 0.4274 - 0.4685, but encountered strong resistance at 0.4331, a break of which will confirm the bullish market structure. An ascending triangle is forming with a trigger at 0.4331.
Support levels: 0.4273, 0.4194, 0.4114
Resistance levels: 0.4331, 0.4596, 0.4685
Within the local “ascending triangle” structure, the price may continue to consolidate. A retest of local support zones is possible. However, a smooth compression of the price towards resistance may lead to a breakout, which in turn, due to consolidation, may provoke a strong upward momentum.
Best regards, R. Linda!

ETH/USDT 4H chart review1. Trend
• Direction: a downward trend, confirmed by a series of lower peaks and lower holes.
• The black line is a downward trendline - a course from a few candles reflects it down.
• The increase in volume in declines suggests that the seller is still dominating.
⸻
2. Key levels
• Resistance:
• 4 634 USDT - the last strong resistance from which the price has reflected.
• 4,527 USDT - local resistance, coincides with Trendline.
• Support:
• 4,415 USDT - the current level of support tested, the price consolidates here.
• 4,300 USDT - another strong level of support; Breaking can accelerate the inheritance.
⸻
3. Current situation
• The price has fallen below 4,527 and is currently supporting 4 415.
• The candle formation on support is mixed - small green candles after a large red impulse suggest a temporary pause or a correction attempt.
• The volume on inheritance candles is higher than on growth → Seller still stronger.
⸻
4. Scenarios
🔴 Negative (more likely if the sales volume persists)
• If 4,415 is pierced with an increased volume, the purpose of the inheritance is 4,300 USDT, and in case of further pressure even 4,200.
• The downward trend is maintained.
🟢 positive (less likely at the moment)
• If the course reflects from 4 415 and breaks Trendline + Level 4 527, then possible movement in the direction of 4 630.
• This requires an increased volume of buyers.

GOLD → Gold is consolidating. What will C.Retail Sales show?FX:XAUUSD is consolidating due to uncertainty caused by economic data from the US, interest rate decisions, and negotiations between the presidents of Russia and the US.
Gold has not had an easy time lately, with the price in a rather difficult zone both technically and fundamentally. Low-potential, restrained movements occurring within the consolidation are waiting for a strong driver to appear. Potentially, this could happen today, as we have retail sales data ahead of us, as well as a fairly important event - a meeting and negotiations between the presidents of Russia and the US.
Technically, the focus is on the boundaries of the current consolidation: 3331 - 3349 - 3366. Thursday's weak close (close to the trigger) hints at a possible attempt to break through 3331 with the aim of falling to 3300. However, a sharp approach and seizure of liquidity from 3331 could provoke a rebound to local resistance (3350 - 3366).
Support levels: 3331, 3300.
Resistance levels: 3350, 3366.
Markets are waiting for hints on interest rates. Weaker data on Core Retail Sales and Retail Sales could bring us closer to a reduction in interest rates, against which backdrop gold could strengthen. And vice versa, respectively...
Best regards, R. Linda!
GBPUSD → Breakout of resistance after consolidationFX:GBPUSD is rebounding from strong daily resistance with the aim of consolidating its pre-breakout potential. The fundamental background for the pound is positive...
GBPUSD has a strong market structure. A false breakout of resistance at 1.3589 is forming. The level could not be broken on the first attempt, MM may form a correction or consolidation for a retest of resistance with the aim of a breakout and further growth. Focus on the liquidity zone at 1.35, 1.3488. The dollar is in a downward movement within the global bearish trend. Despite conflicting news, the index continues to decline, giving the pound a chance...
Resistance levels: 1.3589
Support levels: 1.3521, 1.3488
The market needs consolidation in order to break through this barrier. Against the backdrop of a bullish trend, which is already supporting the market, we can expect a rebound from support with the aim of continuing growth.
Best regards, R. Linda!

HYPEUSDT → Correction for consolidation before ATH breakoutBINANCE:HYPEUSDT.P looks quite strong and is just a few cents away from reaching its ATH. The coin needs to build up its potential to reach its target and break through a strong resistance level...
The cryptocurrency market feels quite confident. Bitcoin's growth is having a positive effect on altcoins. HYPE almost tested its ATH as part of an upward movement, but encountered pressure. The price did not reach its target (ATH) and entered a correction phase. Most likely, this is an MM maneuver to collect liquidity...
As part of the correction, the market may test the consolidation located below. Focus on the support area 0.5F - 45.85
Resistance levels: 49.88
Support levels: 45.85, 44.27
The most likely scenario is a retest of the support and interest zone. A false breakdown and the bulls holding the price above the level, i.e. in the zone of interest, could attract active buying, which in turn could trigger a continuation of the growth within the global bullish trend.
Best regards, R. Linda!

GBPAUD → Attempt to break through resistance. Rally?FX:GBPAUD is preparing to accelerate its growth within the global bullish trend. A breakout of the local channel resistance is forming...
Against the backdrop of the falling dollar, GBP is taking advantage of the opportunity and entering a phase of active growth. GBPAUD is emerging from local consolidation. The movement is accompanied by bullish momentum and a breakout of the upward channel resistance. Technically, after retesting (forming) the upper channel boundary at point 2, consolidation is forming. There is no decline, which indicates the bullish potential of the market. The breakout of the overall figure's resistance confirms the buyer's intentions...
Resistance levels: 2.0698, 2.0756, 2.085
Support levels: 2.06658, 2.06537, 2.0593
If the bulls keep the price above the specified zone after the breakout, then in the short and medium term, the price may continue to rise to the resistance of the trading range...
Best regards, R. Linda!

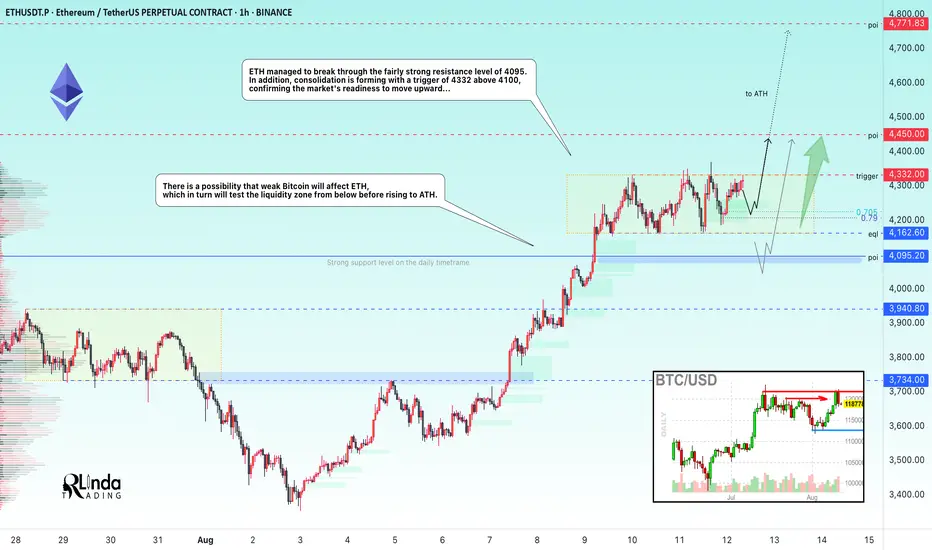
ETHUSDT → A new range has been opened. Onward to ATH!BINANCE:ETHUSDT is breaking through strong resistance formed in the 4090-4100 area on D1-W1. Consolidation is forming after strong growth, which can be seen as a positive sign.
Bitcoin has been looking quite weak recently against ETH, which continues to rally despite Monday's red market. ETH managed to break through the fairly strong resistance level of 4095, and after a strong 25% rally, the price moved into consolidation (trading range 4325-4160, with resistance at 4325 as the trigger). Technically, we see that the market has stopped updating local lows, and a fourth retest of resistance is forming with reduced volatility, which in general could lead to a breakout attempt. Consolidation of the price above the consolidation resistance could trigger further growth. A channel to the ATH is open...
Resistance levels: 4325, 4450, 4800
Support levels: 4220, 4162, 4095
ETH is quite strong and the market may not allow the price to fall too low, as there is a lot of excitement. However, I do not rule out the possibility that weak Bitcoin will affect ETH, which in turn will test the liquidity zone (4162 - 4095) from below before rising to ATH.
Best regards, R. Linda!
EURCAD → Consolidation above the mirror level...FX:EURCAD continues its global bullish trend. Locally, within the upward movement, we see a pause, but the nature of this pause is not aimed at a reversal, but at consolidation before growth.
EURCAD, within the upward trend, is pausing before local resistance at 1.6052. A pre-breakout base is forming with fairly active and dynamic buyers. A breakout and consolidation of prices above resistance will trigger further growth.
Focus on consolidation at 1.6052 - 1.5977. The market is not updating local lows, volatility is decreasing (consolidation pattern) and the assault on resistance continues. Strong prerequisites for the movement to continue
Support levels: 1.6011, 1.5977
Resistance levels: 1.6052, 1.6118
A smooth approach to resistance, a breakout and consolidation above the key level (trigger) could trigger further growth within the global and local bullish trend.
Best regards, R. Linda!

Tesla possible LongTesla’s recent breakout above the long-term descending trendline is a positive technical signal, suggesting that market sentiment may be shifting toward a bullish phase. However, the breakout lacks strong volume confirmation, leaving the possibility of a false breakout on the table.
The key battle zone now lies between USD 349.29 and 367.40 — if bulls can push and sustain the price above this range, the door opens for a larger rally toward the USD 400+ area. On the other hand, failure to hold above USD 331 would put the breakout at risk, potentially sending the price back into the USD 308–290 support zone.
In short, Tesla stands at a technical crossroads: momentum favors buyers, but confirmation through sustained price action and volume is essential before a strong uptrend can be confirmed.

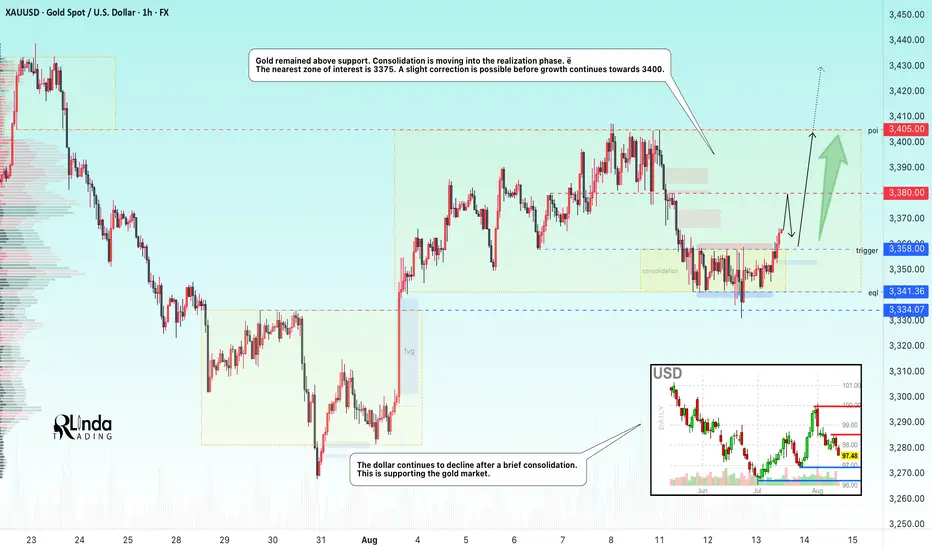
GOLD → Consolidation ahead of potential growth. PPI ahead...FX:XAUUSD is still consolidating, with the range expanding. The price has confirmed the formation of an upward price channel, which bulls are defending quite aggressively...
Gold remains in positive territory for the third day in a row and is consolidating above $3,350 in Asian trading, awaiting PPI data and jobless claims in the US. Moderate CPI and weak labor market statistics have reinforced expectations of a Fed rate cut in September, with some experts forecasting -50 bps. The dollar remains at a two-week low amid dovish comments and rumors of a possible change in the Fed chair, which supports demand for gold. Weak PPI data could accelerate the rise in metal prices, although market attention is gradually shifting to the meeting between Trump and Putin on Ukraine.
Technically, the focus is on the 3366-3340 range. A small correction may form from resistance before breaking the 3366 level and continuing to rise within the trend...
Resistance levels: 3366, 3381, 3400
Support levels: 3341, 3334
Before rising, the market may test the trend support or form a false breakdown. But there is a possibility that the price will immediately start storming 3366 for further growth. But, again, further developments depend on economic data, which will most likely be controlled by Trump after the NFP mistake...
Best regards, R. Linda!

$BTC New Reaches ATH - Next Target $131kBANG!
CRYPTOCAP:BTC REACHES NEW ATH AT ~$124K 🥳
Next target $131k
Told ya this 3 days ago.
Can't believe some of ya'll are still fading me 🤗

BNB/USDT 1DTrend and market structure
• The price moves in an upward trend from the hole around 730 USDT, maintaining support on the trend line (orange line).
• Current price: ~ 840 USDT, close to important resistance at ~ 862 USDT.
• Another strong resistance is located at 940–950 USDT.
• The next support is 809 USDT (local horizontal level) and 758 USDT (earlier hole).
⸻
Medium walking (SMA)
• SMA #1 (red) is below the price - this is a growth signal.
• SMA #2 (green, long -term) is also below and inclined up - confirms the upward trend.
• SMA #5 (blue, very long) is far below - the market is still in the growth phase.
⸻
Indicators
• MacD - MacD line pierces the signal line from below, which is a buy signal. The histogram is slightly positive.
• RSI - ~ 66 points, grows towards the purchase zone (70). There is no extreme yet, but it is approaching - the risk of correction after breaking the resistance.
⸻
• (more likely with current dynamics): breaking the level of 862 USDT and continuation in the direction of 940 USDT. There are more profit realizations possible here.
• Bear: rejection from resistance and decrease in the direction of 809 USDT or even a trend line test and level 758 USDT.

GOLD → From consolidation to distribution. Target 3400FX:XAUUSD is entering a distribution phase after the end of consolidation. The market is strong, bulls managed to keep prices from falling and formed an intermediate bottom in the 3340 zone.
The price increase was supported by expectations of a soft Fed policy after moderate July CPI data (2.7% y/y, 0.2% m/m, core 0.3%), which led to a decline in bond yields and a weakening of the dollar. However, demand for safe assets is declining amid optimism in global markets, fueled by the US-China trade truce, a possible meeting between Trump and Putin, and bets on a Fed rate cut in September. In the long term, gold could be supported by purchases by the Chinese central bank and a recovery in jewelry demand in India.
Technically, the focus is on the zone of interest ahead at 3370-3373, with a possible rebound before growth, as well as on the support zone at 3359. I do not rule out that the market may test the liquidity zone...
Resistance levels: 3370, 3380, 3400
Support levels: 3358, 3341, 3334
There is considerable potential within the consolidation, and the rally may be directed towards the resistance range of 3400. However, pullbacks are possible before growth, which could give us a good entry point.
Best regards, R. Linda!
ETC/USDT 1D Chart1. Trend and price structure
• The price is currently 23.71 USDT (+6.75% on the day).
• After an earlier inheritance trend (yellow dotted line - trend line), you can see an attempt to break up and maintain above SMA 1 (approx. 22.30 USDT).
• The next resistance is 24.50 and 26.00 USDT - you can see that the supply of supply was already 24.50.
• The next support is 22.30 and stronger at 21.02 USDT.
2. Medium walking (SMA)
• SMA #1 (red) - short -term, the price is above, which is a bull signal.
• SMA #2 (green) - medium -term, also below the current price, which supports the upward scenario.
• SMA #5 (blue) - long -term, is lower (approx. 18.85), so the main trend is not completely inverted yet, but the momentum is growing.
3. MacD
• The MacD line pierced the signal line from the bottom - buy signal.
• The histogram has gone down in positive values - the growing pressure of buyers.
4. RSI
• RSI around 55–60 - far from the purchase zone (70+), so theoretically there is still space for growth.
• RSI has pierced its average, which is confirmed by bull's sentiment.
5. Scenarios
• Bull: Maintenance of a price above 22.30 and a possible retest 24.50 with an attempt to break in the direction of 26.00. At 26.00 - road to 27.00–28.00.
• Bear: a decrease below 22.30 opens the road to 21.02, and a deeper descent - around 19.80 or 18.85.
6. Applications
• Short -term - advantage of buyers, but strong resistance at 24.50.
• A good moment for swing traders to watch the reaction at 24.50.
• For long -term positions - full confirmation of the trend reversal only after 26.00.

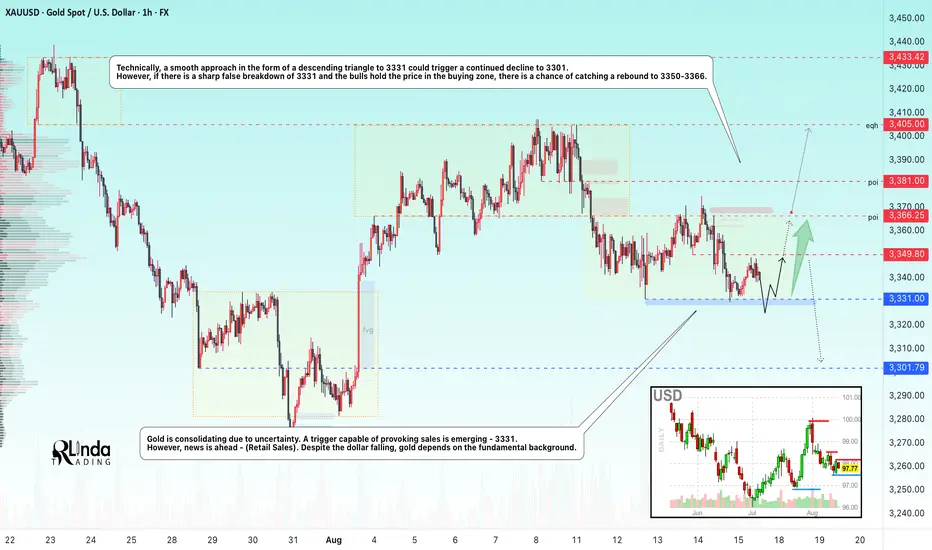
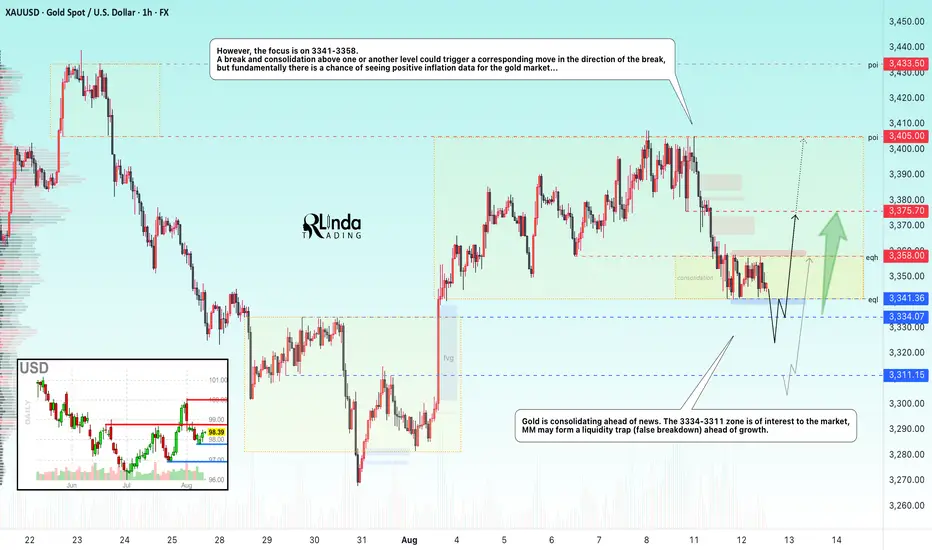
GOLD → Consolidation ahead of CPI data...FX:XAUUSD is consolidating ahead of news. Inflation is on the horizon, and further developments for the dollar and gold will depend on the data. Globally, gold is in a bullish trend, but locally we are seeing a correction...
Gold is rebounding slightly from $3,341 ahead of US CPI data for July and against the backdrop of the extension of the US-China trade truce until November. Investors are assessing the prospects for a Fed rate cut, expecting inflation to remain within 2.8% (core inflation is 3%). Weaker-than-expected data could cause the dollar to fall and support gold, while stronger data could resume the downward trend.
Technically, on D1-H4, gold is consolidating in a symmetrical triangle pattern and the price is in the support zone. There is a possibility that Trump may not make a mistake with inflation data, as he did with employment data...
Support levels: 3341, 3334, 3311
Resistance levels: 3358, 3375, 3405
The 3335-3310 zone attracts MM with an open FVG, which the market may partially close, forming a liquidity trap before continuing growth. However, it is also worth watching the boundaries of the current local consolidation, as a breakout of one or the other boundary could trigger a strong impulse.
Best regards, R. Linda!
USDZAR. The USDZAR is ready to rally but the daily equal lows are suspect. It would be great to see them swept before it rallies, but that will depend on how they use the news.

Ethereum Struggles to Complete above the 0.786 Bearish 5-0 ZoneWhile on the intra-bar price action on ETH has gotten pretty excited above the 0.786 it is still worth considering that ETH has not completed any bars above the 0.786 since the breakout and that at a moments noticed much of the current price action above the main 0.786 PCZ could later find itself being filtered out of the Renko charts as a whole depending on how many Average True Ranges above the 0.786 PCZ ETH possible move.
Based on the fact that the current candle is simply still in the projection phase I'd caution longs here and remain accumulative of longer dated puts. There is also a 2x leveraged ETF of ETH called ETHU which has OTM monthly call options trading at 20-40 dollar premiums. I'd consider farming off of those premiums in the form of Bear Vertical Spreads as a way to hedge off the costs of holding the long puts.
Overall, we are still trading at the PCZ of the Bearish 5-0 which seems to also be in the similar shape of a Bearish Head and Shoulders pattern; the measure move of which could take ETH down to around $355 upon the break of $1,600

BTC/USD 1D1. Price Structure and Patterns
Medium-Term Trend: Since mid-June, the price has been consolidating between ~$112,000 and ~$121,000, but with a slight upward slope.
Upward Channel: Marked with orange lines – the current candlestick is near the top of this channel.
Triangle Breakout: The white dashed line indicates an upward breakout from the converging triangle (symmetrical) formation, which could signal continued growth.
2. Support and Resistance Levels
Nearest Support:
USD 117,009 (Fib. Level 0.236 and local low)
USD 115,912 (SMA200 – red line)
USD 112,167 (lower consolidation boundary and prior support)
Nearest Resistance:
USD 121,151 (Fib. Level 0.382)
USD 123,966 (Fib. Level 0.5 – key psychological and technical resistance)
USD 126,781 (Fib. Level 0.618 – strong resistance)
USD 130,788 (Fib. Level 0.786 – breakout target)
3. Technical Indicators
MACD: The MACD line is beginning to intersect with the upside signal line – suggesting the beginning of upward momentum.
RSI: 59 – rising, but not yet in the overbought zone (above 70). This means there is room for further growth.
Moving Averages:
The SMA50 (~$114,020) and SMA200 (~$115,912) are below the price – a bullish pattern.
The price has rebounded from the SMA50, which is often a good starting point for further growth.
4. Scenarios
Bullish (more likely at this point)
If the price holds above $118,000 and breaks $121,151, a quick move to $123,966 and then $126,781 is possible.
Confirmation – the daily candle closes above $121,151 on increasing volume.
Bearish
If the price falls below $117,000, a retest of $115,912 is possible, followed by $112,167.
A break of $112,167 could signal a downtrend reversal.
5. Key Observations
Volume is increasing on bullish candles → a sign of accumulation.
The price is near strong resistance at $121,000–$122,000 – a correction is possible here.
Longer term (Fib from the March low), there is potential for a move towards $130,000–$135,000 if the trend continues.

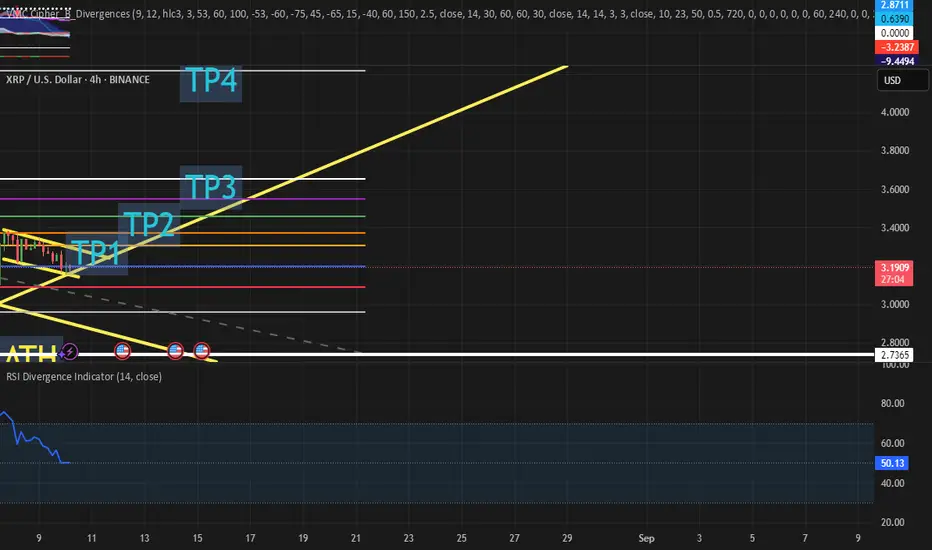
XRP long.. plan 8/10Xrp bouncing off the trend line from the most recent bounce from $2.72.. that was the 618 fib from April. strong level.. so its make it or break it from this $3.16/17 range. easy Sl under the wicks.. If it fails Id be looking for a $3.00 XRP.. would need to watch for conformations maybe a fail retest.. but well see .. Using the Fib levels as Tps.
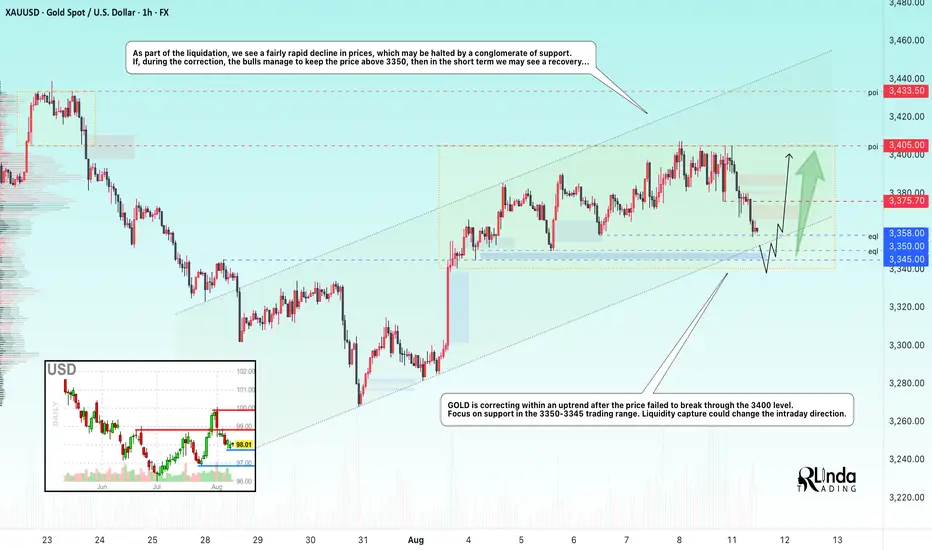
GOLD → Retest of support within an uptrendFX:XAUUSD is forming a liquidation phase as part of the previously mentioned bullish wedge pattern. Bulls were unable to break through the 3400 mark, and due to uncertainty, the price has entered a correction phase...
On Monday, gold fell to $3350, echoing the bearish sentiment in Asian trading, as $3400 remains an unattainable level. The pressure is intensified by weak data from China (PPI −3.6%), profit-taking and expectations for the US inflation report, as well as uncertainty in US-China trade negotiations and microchip policy. Optimism is being held back by expectations of Fed policy easing after negative statistics and forecasts of rate cuts, as well as possible meetings between US and Russian leaders. All this reduces demand for gold as a safe haven asset.
The focus is on the local trading range of 3400-3350. Before a possible rise, the market may test a strong support zone...
Resistance levels: 3376, 3405
Support levels: 3358, 3350, 3345
At the moment, we are seeing a retest of 3358 and a false breakdown, with a fairly weak reaction to the zone. In the short term, gold may test 3350-3345. A false breakdown and the bulls holding the price above this zone could bring the price back up...
Best regards, R. Linda!