ADAUSDT → Correction (hunt for liquidity) before the fall BINANCE:ADAUSDT is pausing in the 0.41 area and entering a correction phase, during which it may test the zone of interest in a bearish market.
Bitcoin failed to overcome resistance at 92K, with economic data intensifying bearish pressure, resulting in another decline. The market is stagnant within the trading range, and any correction could quickly turn into a sharp decline...
ADA is forming a halt in the 0.41 zone and is entering a phase of local correction. The zone of interest is 0.426 - 0.434 (the area of local trend support breakdown). A retest of resistance may end in a false breakout...
Resistance levels: 0.421, 0.426, 0.434
Support levels: 0.409, 0.392
A false breakout of the resistance zone or a retest of the previously broken support of the uptrend may end in pressure from the bears. The correction may be followed by a continuation of the downtrend and the zone of 0.421 - 0.434
Best regards, R. Linda!
Fibonacci Retracement

DOGEUSDT → Lack of bullish potential BINANCE:DOGEUSDT.P failed to break the trend. Under pressure from resistance and a global downtrend, the coin is reversing and may decline...
Bitcoin is pausing after a news rally based on rumors. The trend remains bearish. Pressure on the crypto market is present...
DOGE faced pressure in the 0.1477 - 0.155 zone. A rebound from 0.1533 is forming and the price is closing below 0.1477, forming a pre-breakout base of 0.1464. The reaction to support is weakening, confirming the weakness of the buyer. A close below 0.1464 could trigger a further decline within the range.
Resistance levels: 0.1477, 0.15337
Support levels: 0.1464, 0.1366
A breakdown of support, closing below the level, and consolidation in the short zone will once again confirm buyer weakness, which in turn may trigger a further decline.
Best regards, R. Linda!

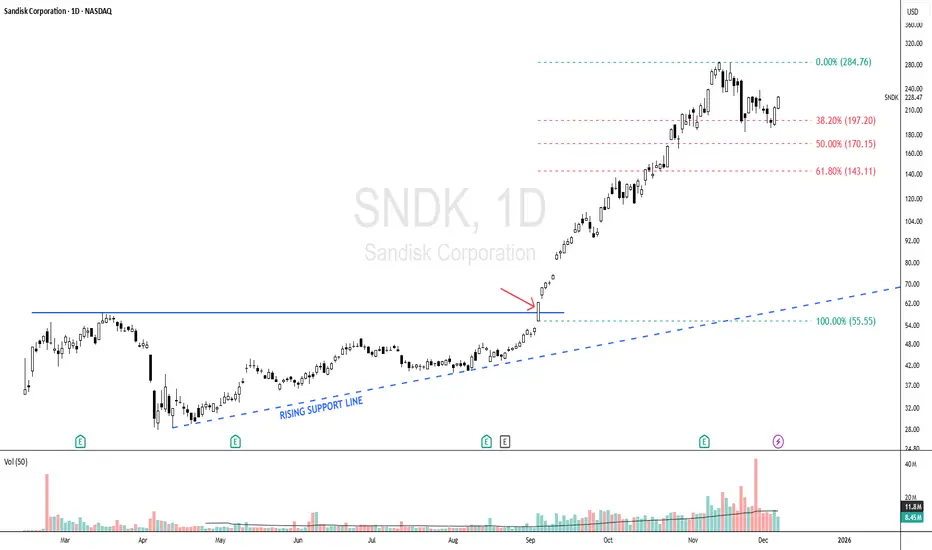
SNDK - Bullish Scenario Since 04 Sept, Momentum Still Intact!SNDK - CURRENT PRICE : 228.47
🔥 Bullish Scenario Supported by Trend Structure & Fibonacci Reactions
SNDK began showing early signs of a bullish scenario when price respected a rising support line , indicating steady accumulation and higher lows forming. The major bullish confirmation occurred on 04 September , when price broke above the 55.55 level (look at red arrow), triggering strong momentum and leading to a rapid vertical rally. As with many fast-moving stocks, a healthy retracement followed, and SNDK pulled back precisely toward the Fibonacci 38.2% golden ratio, where the stock found support and began forming a new base. This behavior suggests the prior uptrend remains intact, and the uptrend may resume as long as the stock continues to hold above this retracement zone.
Some Elliott Wave practitioners may also interpret the current structure as a developing Wave 5, suggesting the potential for another upside leg if the trend continues to follow impulsive wave behavior.
Take note that I'm using logarithmic scale chart because the share price has already risen more than 300% since the 04 September breakout, making it more suitable for analyzing large percentage moves and trend structure.
ENTRY PRICE : 228.47
FIRST TARGET : 270.00
SECOND TARGET : 324.00 (Projected based on Fibonacci extension)
SUPPORT : 183.00 (The low of 21 Nov HAMMER candle)
$META | COVERAGE INITIATED — Personal Position Update [W49]COVERAGE INITIATED — Bullish Classification (Trend Shift Identified)
META — WEEK 49 TREND REPORT | 12/05/2025
Ticker: NASDAQ:META
Timeframe: W
This is a reactive structural classification based on the weekly chart as of this timestamp. Price conditions are evaluated as they stand — nothing here is predictive or forward-assumptive.
⸻
Author’s Note — Personal Position Update
I initiated my own position on [ NASDAQ:META ] during Week [ 49 ], entering at $ [ 673.42 ].
This decision follows my personal criteria: I only participate when my system identifies a verified structural trend shift supported by both a confirmed weekly flag and a qualifying candle state. This note reflects my activity only and is not a suggestion for anyone else.
As of this update, my position is currently up ~ [ 0% ] from my entry.
My structural exit level is $ [ 670.20 ] on a weekly-close basis. This level will continue to adjust upward automatically as the structure strengthens. If price closes below that threshold, my system classifies the trend as structurally compromised, and that is where I personally exit.
This update exists solely to document my own participation and the structural levels I monitor. It is not predictive and does not imply any future outcome.
⸻
Structural Integrity
• 1) Current Trend Condition [ Numbers to Watch ]
• Current Price @ $
• Trend Duration @ +0 Weeks
( Bullish )
• Trend Reversal Level ( Bearish ) @ $
• Trend Reversal Level ( Bearish Confirmation ) @ $
• Pullback Correction Retracement @ $
• Correction Structural Support @ $
⸻
2) Structure Health
• Retracement Phase:
Uptrend (operating above 78.6%)
• Position Status:
Caution (interacting with structural layers)
⸻
3) Temperature :
Warming Phase
⸻
4) Momentum :
Neutral
⸻
Structural Alignment
NEUTRAL STRUCTURAL CONDITION
This mark represents a period where directional behavior was unclear. Market movement here reflected compression, chop, or indecision — neither trend direction was dominant. It does not signal continuation or reversal, only that price action was not showing strong alignment in either direction.
⸻
Methodology Overview
This classification framework evaluates directional conditions using internal trend-interpretation logic that references price behavior relative to its structural layers. These relationships are used to identify when price movement aligns with the framework’s criteria for directional phases, transition points, or regime shifts. Visual elements or structural labels reflect these internal interpretations, rather than explicit trading signals or preset indicator crossovers. This framework is observational only and does not imply future outcomes.

$PLTR | COVERAGE INITIATED — Personal Position Update [W49]COVERAGE INITIATED — Bullish Classification (Trend Shift Identified)
PLTR — WEEK 49 TREND REPORT | 12/05/2025
Ticker: NASDAQ:PLTR
Timeframe: W
This is a reactive structural classification based on the weekly chart as of this timestamp. Price conditions are evaluated as they stand — nothing here is predictive or forward-assumptive.
⸻
Author’s Note — Personal Position Update
I initiated my own position on [ NASDAQ:PLTR ] during Week [ 49 ], entering at $ [ 181.76 ].
This decision follows my personal criteria: I only participate when my system identifies a verified structural trend shift supported by both a confirmed weekly flag and a qualifying candle state. This note reflects my activity only and is not a suggestion for anyone else.
As of this update, my position is currently up ~ [ 0% ] from my entry.
My structural exit level is $ [ 177.54 ] on a weekly-close basis. This level will continue to adjust upward automatically as the structure strengthens. If price closes below that threshold, my system classifies the trend as structurally compromised, and that is where I personally exit.
This update exists solely to document my own participation and the structural levels I monitor. It is not predictive and does not imply any future outcome.
⸻
Structural Integrity
• 1) Current Trend Condition [ Numbers to Watch ]
• Current Price @ $
• Trend Duration @ +0 Weeks
( Bullish )
• Trend Reversal Level ( Bearish ) @ $
• Trend Reversal Level ( Bearish Confirmation ) @ $
• Pullback Retracement @ $
• Correction Support @ $
⸻
2) Structure Health
• Retracement Phase:
Uptrend (operating above 78.6%)
• Position Status:
Healthy (price above both structural layers)
⸻
3) Temperature :
Neutral Phase
⸻
4) Momentum :
Bullish
⸻
Structural Alignment
NEUTRAL STRUCTURAL CONDITION
This mark represents a period where directional behavior was unclear. Market movement here reflected compression, chop, or indecision — neither trend direction was dominant. It does not signal continuation or reversal, only that price action was not showing strong alignment in either direction.
⸻
Methodology Overview
This classification framework evaluates directional conditions using internal trend-interpretation logic that references price behavior relative to its structural layers. These relationships are used to identify when price movement aligns with the framework’s criteria for directional phases, transition points, or regime shifts. Visual elements or structural labels reflect these internal interpretations, rather than explicit trading signals or preset indicator crossovers. This framework is observational only and does not imply future outcomes.

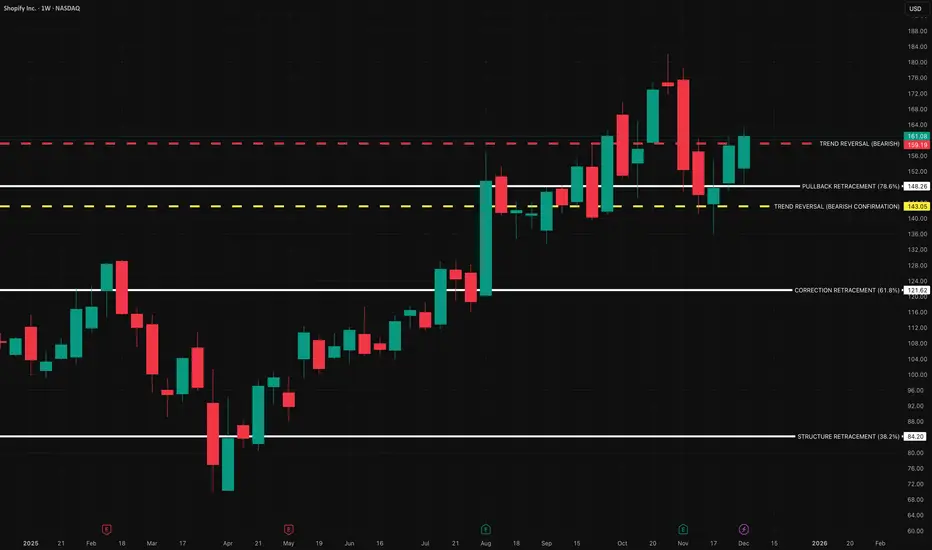
$SHOP | COVERAGE INITIATED — Personal Position Update [W49]COVERAGE INITIATED — Bullish Classification (Trend Shift Identified)
SHOP — WEEK 49 TREND REPORT | 12/05/2025
Ticker: NASDAQ:SHOP
Timeframe: W
This is a reactive structural classification of SHOP based on the weekly chart as of this timestamp. Price conditions are evaluated as they stand — nothing here is predictive or forward-assumptive.
⸻
Author’s Note — Personal Position Update
I initiated my own position on [ NASDAQ:SHOP ] during Week [ 49 ], entering at $ [ 161.08 ].
This decision follows my personal criteria: I only participate when my system identifies a verified structural trend shift supported by both a confirmed weekly flag and a qualifying candle state. This note reflects my activity only and is not a suggestion for anyone else.
As of this update, my position is currently up ~ [ 0% ] from my entry.
My structural exit level is $ [ 159.19 ] on a weekly-close basis. This level will continue to adjust upward automatically as the structure strengthens. If price closes below that threshold, my system classifies the trend as structurally compromised, and that is where I personally exit.
This update exists solely to document my own participation and the structural levels I monitor. It is not predictive and does not imply any future outcome.
⸻
Structural Integrity
1) Current Trend Condition [ Numbers to Watch ]
• Current Price @ $
• Trend Duration @ +0 Weeks
( Bullish )
• Trend Reversal Level ( Bearish ) @ $
• Trend Reversal Level ( Bearish Confirmation ) @ $
• Pullback Retracement @ $
• Correction Support @ $
⸻
2) Structure Health
• Retracement Phase:
Uptrend (operating above 78.6%)
• Position Status:
Healthy (price above both structural layers)
⸻
3) Temperature :
Neutral Phase
⸻
4) Momentum :
Bullish
⸻
Structural Alignment
UPWARD STRUCTURAL ALIGNMENT
This mark reflects a point where market behavior supported the continuation of the existing upward direction. It does not imply forecasting or targets — it simply notes where strength became observable within the current trend. Its meaning holds only while price continues to respect the broader structural levels that define the trend.
⸻
Methodology Overview
This classification framework evaluates directional conditions using internal trend-interpretation logic that references price behavior relative to its structural layers. These relationships are used to identify when price movement aligns with the framework’s criteria for directional phases, transition points, or regime shifts. Visual elements or structural labels reflect these internal interpretations, rather than explicit trading signals or preset indicator crossovers. This framework is observational only and does not imply future outcomes.
BTC/USDT 4H chart review📉 1. Market structure – short-term 4H trend
In the chart I see:
• Breaking the upward trend line (black diagonal) – a classic signal of weakening momentum.
• After the breakout, there was a quite strong downward impulse, which confirms that the intraday trend has turned bearish.
• The price is currently testing around USDT 89,500-90,000, where a reaction is emerging, but not strong yet.
👉 Conclusion: 4H is now in a bearish correction and the market looks ready to test further lower supports.
⸻
🧭 2. Support and resistance levels (from your chart)
Upcoming supports:
1. 89,500–89,000 – the current level at which the market is trying to defend itself.
2. 88 185 – clear red line, first logical support lower.
3. 86,001 – next demand level, big candle from the past.
4. 83,720 – deeper support to which the market returns when there is great fear.
The nearest resistances (which need to be recovered to return to growth):
1. 90,467 – first key resistance; now it will work as a "flip".
2. 91 923 – stronger resistance; This is where the declines began.
3. 94,223 - only breaking this level shows that the bulls are back.
👉 The market is currently sitting BELOW the key resistance of 90,467, so downward pressure is active.
⸻
📉 3. Analysis of candles and price behavior
• The last 4-6 candles are large red bodies, which shows the clear dominance of supply.
• After the breakout of the trendline, there is no strong pullback - this means that the bears do not allow for a rebound.
• The lower shadow on the last candle indicates buyer reaction, but no confirmation yet.
👉 If 89,500 is broken, a move to 88,185 is very likely.
⸻
📉 4. MACD – negative signal
MACD shows:
• Bearish cross – the blue line crossed the orange line from above.
• The histogram turns into red bars - the downward momentum is increasing.
• MACD is below zero → confirmed downward trend in the 4-H interval.
👉 MACD confirms what we see on the chart: momentum is falling and a rebound is unlikely without consolidation.

GOLD → Consolidation above 4220. Bullish structureFX:XAUUSD is trading in a narrow range around $4,200, maintaining sideways momentum ahead of US inflation data. The market confirms a bullish structure...
The probability of a Fed rate cut in December remains at ≈90%.
Mixed US employment data:
– Jobless claims fell to their lowest level since September 2022.
– Layoffs in November reached a two-year high.
The key benchmark today is the PCE index for September (data delayed due to the government shutdown).
Gold is awaiting new signals on inflation. Range trading is likely until the release of PCE data, which may set the direction of movement ahead of the Fed's decision.
Resistance levels: 4238, 4262
Support levels: 4220, 4183
If the bulls hold their ground above local support at 4220, we will have a chance to break through 4238 and retest 4262. However, a breakout of the trading range resistance could trigger a continuation of the rally towards the ATH.
Best regards, R. Linda!

GOLD → Retest of consolidation support on uptrend FX:XAUUSD is trading in a sideways range around $4,200, awaiting new labor market data to determine the Fed's policy trajectory after December's rate cut.
Weak US data (a 32K decline in ADP employment and a slight increase in ISM services to 52.6) did not change market expectations. The probability of a 25 bp Fed rate cut on December 11 is around 90%. Attention has shifted to the trajectory of policy easing in early 2026. Key factors will be data on unemployment claims and sentiment on Wall Street.
The fundamental background is relatively positive, and the dollar has entered a correction phase due to expectations of lower rates, which may support the gold price...
Resistance levels: 4238, 4262
Support levels: 4185, 4175
Gold is testing the support levels of the key trading range. If the bulls keep the price above 4185 and form a bullish reversal pattern, then in the short and medium term, we can expect growth to intermediate highs.
Best regards, R. Linda!

ETHEREUM → The emergence of a positive driver?BINANCE:ETHUSDT is soaring amid a news rally and testing resistance at 3230. The daily increase was almost 20%. If growth is expected, then after a slight correction...
Fundamental background: the market reacted to rumors of the replacement of the Fed chairman with Kevin Hassett, who is more “dovish” and loyal to cryptocurrencies. The market broke the local structure and updated the interim maximum from 3070 to 3230. A false breakout of resistance is forming relative to the key resistance level, and the market is entering a correction/stagnation phase.
Bitcoin, the main driver of the cryptocurrency market, faced strong resistance at 95K. The global market trend is downward, and a change in trend will require time and more confirmation...
There is a struggle for resistance in the market, and several scenarios are possible: consolidation and a breakout of resistance, or growth after correction...
Resistance levels: 3230, 3370
Support levels: 3172 (local), 3057
High probability: a false breakout of 3230 will trigger a correction to 3050 (before the news). If the bulls keep the price above 3050, growth may continue as part of the change in the fundamental background.
BUT! If buyers keep the price without correction, then the focus will be on 3230. Consolidation above this level could trigger growth to 3370 - 3620.
Best regards, R. Linda!

GOLD → The battle for zone 4200. Bullish trend FX:XAUUSD is forming a local trading range of 4180-4230, trying to stay above 4200 after yesterday's correction ahead of important US employment and services data.
The dollar is weakening amid expectations of a Fed rate cut on December 11. News concerning Powell, namely Fed chair candidate Kevin Hassett (a well-known “dove”), is supporting gold. Geopolitical risks (stagnation in Russia-Ukraine negotiations) are increasing demand for safe-haven assets.
• In focus today: ADP employment data and ISM Services PMI.
• Weak indicators will strengthen bets on Fed policy easing and support gold.
Gold retains its upside potential. The release of US data could either accelerate growth to $4300 or trigger a correction in the event of strong indicators.
Resistance levels: 4230, 4260
Support levels: 4185, 4175
Gold is testing 4200 for strong support. Local trading range 4180 - 4230. A false breakout of support amid a bullish trend and a weak dollar could support gold's growth.
Best regards, R. Linda!

EURUSD → Consolidation above downtrend resistance FX:EURUSD is attempting to reverse the trend amid expectations of interest rate cuts in the US. Important resistance at 1.165...
The dollar is breaking the support of the bullish trend amid expectations of interest rate cuts and news related to Powell. A decline in the index will support the euro exchange rate.
EURUSD is breaking the resistance of the downtrend, followed by bulls trying to keep the currency pair above 1.160, a psychological level. Against the backdrop of the dollar's decline, there is a chance of a breakout above 1.165 and growth
Resistance levels: 1.165 - 1.1656
Support levels: 1.159, 1.155
Before breaking through resistance, the market may consolidate or retest support. However, a breakout of 1.165 - 1.1656 and a close above this zone could trigger a distribution towards 1.173 - 1.182
Best regards, R. Linda!

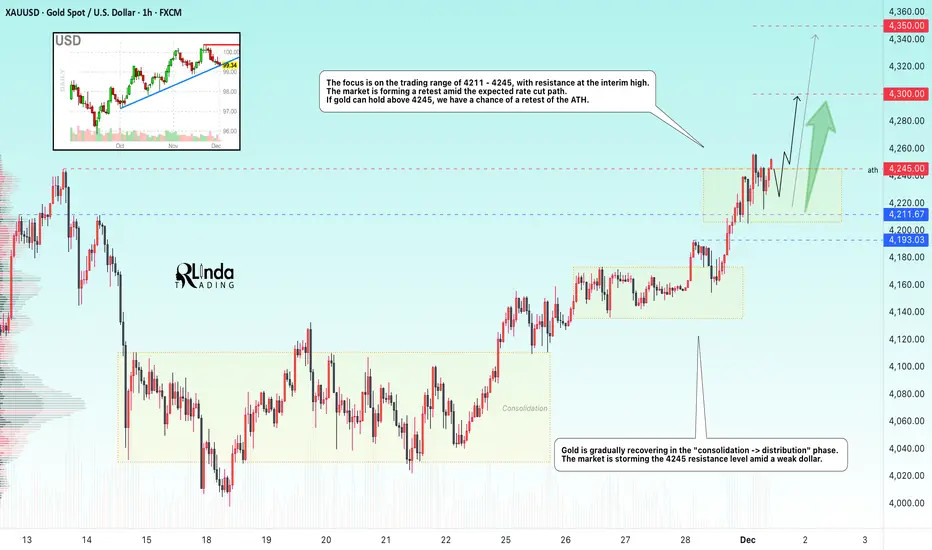
GOLD → Correction to support amid a bullish trend FX:XAUUSD retreated from the $4,245 level reached on Monday. A countertrend correction is forming ahead of the news. But buyers are not sleeping...
Weak US economic data has heightened expectations of an imminent Fed rate cut. The PMI index in the US manufacturing sector continued to contract. The market estimates the probability of the Fed easing policy next week at 87%.
However, rising US Treasury yields and fears that the Fed may send cautious signals after its December decision are limiting gold's growth.
Market attention is shifting to ADP employment data and the US services business activity index (ISM Services PMI), which will be released on Wednesday. They will provide new signals about the health of the US economy.
The correction in gold appears to be under control amid continuing macroeconomic uncertainty. The 4200, 4193-4173 level remains an important area of struggle between bulls and bears.
Resistance levels: 4211, 4245
Support levels: 4193, 4173
A false breakdown and the bulls holding the market above the above support zone could trigger growth within the trend.
Best regards, R. Linda!

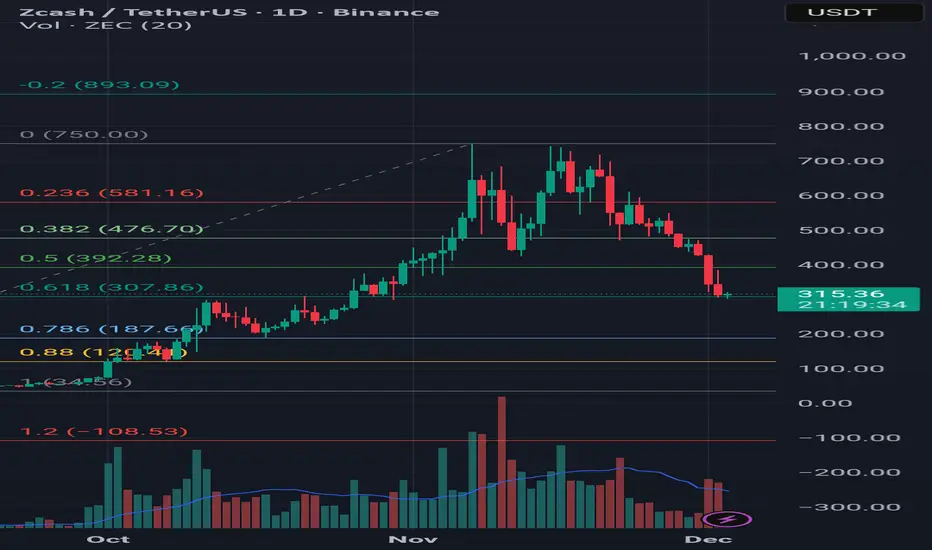
ZECUSDT – Potential Long Setup at Key Fibonacci LevelZECUSDT – Potential Long Setup at Key Fibonacci Level
After a strong rally, ZECUSDT has entered a corrective phase, dropping from the 750 zone down to 307.8 – which aligns precisely with the 0.618 Fibonacci retracement level. Historically, this area has acted as a significant resistance twice, and once broken, it led to a notable bullish continuation.
Currently, price action is testing this level again, and given its historical importance, I see potential for a long setup if bullish confirmation appears.
📌 My Targets (TP):
- TP1: 470
- TP2: 658
- TP3: 743
🛡️ Stop Loss: 299
🕒 Timeframe: Daily
📈 Perspective: Long-term
⚠️ Disclaimer: This is not financial advice or a buy/sell signal. Just sharing my personal view based on technical analysis.
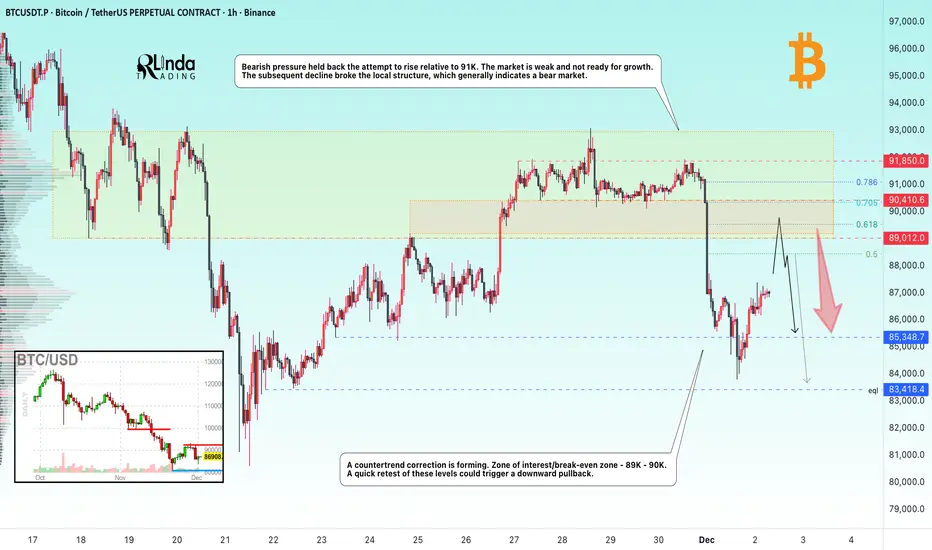
BITCOIN → The hunt for liquidity before the fallBINANCE:BTCUSDT.P continues to update lows within the global downtrend. The retest of 91K confirmed the dominance of bears...
The downtrend continues. The technical and fundamental situation for the crypto market is neutral to weak.
Bearish pressure held back the attempt to rise relative to 91K. The market is weak and not ready for growth. The subsequent decline broke the local structure, which generally indicates a bear market, but after updating the local minimum to 83700, a countertrend correction is forming. Zone of interest/break-even zone - 89K - 90K. A quick retest of these levels could trigger a downward pullback.
Resistance levels: 89K, 90K
Support levels: 85,400, 83,400
A retest of the range boundary and zone of interest could trigger a liquidity squeeze and a further decline if the bears keep the price below these boundaries.
Best regards, R. Linda!
Sobha Approaching Key Fib Support — Bounce On the Cards?This is the daily timeframe chart of Sobha Ltd.
The stock is currently holding a strong support zone near the 1400–1430
range.
If this support level is sustained, Sobha may continue to trade within a range-bound structure.
A potential bullish move could emerge towards the 1650–1700 resistance zone.
Thank you.

CL1! — Bullish Above 58 with Target at 62.22Crude oil maintains a constructive bullish structure as long as price holds above the 58.00 key support zone. This level remains the foundation of the current upward bias.
The next meaningful obstacle for buyers sits at the 60.69 resistance, which aligns with a major Fibonacci cluster and has shown strong rejection in previous attempts. A clean breakout and sustained close above 60.69 would confirm renewed bullish momentum.
Above that resistance, the path opens toward 61.71 followed by the main upside target at 62.22, which represents the completion of the current Fibonacci expansion.
As long as price trades above 58, the bullish scenario remains valid. A failure at 60.69 may trigger a temporary pullback, but the broader structure favors continuation toward 62.22 once the level is cleared.

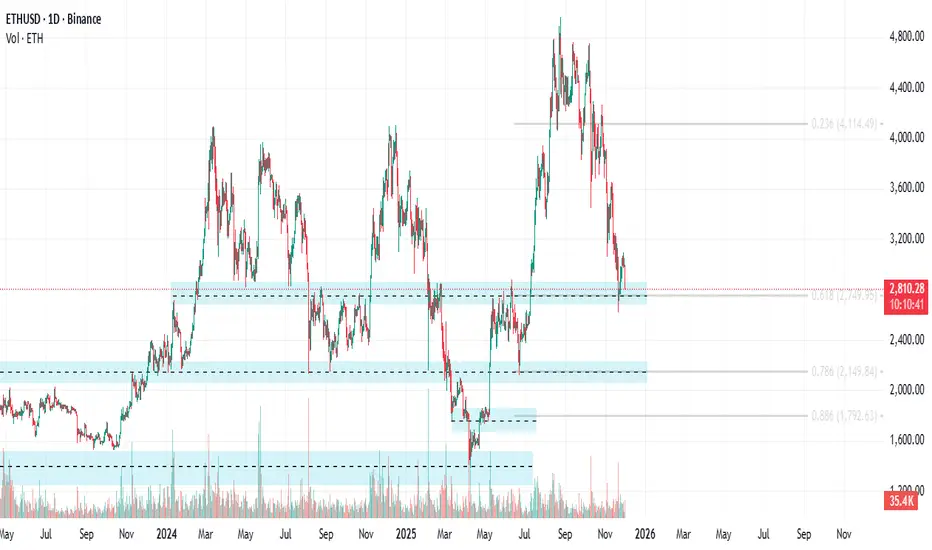
ETHSUD test area 0.618 fiboAfter breaking through resistance at $2750 in early July, Ethereum ( CRYPTOCAP:ETH ) is attempting to establish it as new support, which is also the 0.618 Fibonacci retracement area.
GOLD → The bullish trend continues. Retest of 4250FX:XAUUSD is trading at six-week highs near $4,250, supported by a weaker dollar and expectations of a Fed rate cut. The market is storming key resistance...
The probability of a December rate cut is 87%. The dollar is posting its worst week in four months after failing to consolidate above 100.0. A break in local trend support could trigger a decline in the index, which would support gold.
Today's focus is on the ISM Manufacturing PMI (forecast: 48.6). Weakness in the data could increase pressure on the dollar and support gold.
Gold maintains its upward trend, supported by loose monetary policy. Key data this week could boost momentum ahead of the Fed meeting.
Resistance levels: 4245, 4300
Support levels: 4211, 4193
A retest of 4245 could end with a pullback within the current consolidation at 4211 - 4245. Two scenarios: If the bulls hold the price above 4245, a rally to 4300 is expected. Otherwise, the market could retest 4215 - 4211 with the aim of a long squeeze before rallying. The trend is bullish, and the fundamental background is relatively positive.
Sincerely, R. Linda!
GBPUSD → Attempt to change the trendFX:GBPUSD is attempting a trend reversal. The likelihood of an interest rate cut is quite high, which could support the pound's rise.
The dollar is attacking the uptrend support level, failing to consolidate above 100.0. Ahead of the interest rate meeting, another rate cut could weaken the dollar, which in turn would support the pound sterling.
The currency pair is breaking downtrend resistance, and bulls are attempting to hold the price above 1.3191. A prolonged squeeze could shift the imbalance toward buyers, which in turn could trigger a rally.
Support levels: 1.3191, 1.3124
Resistance levels: 1.337, 1.353
The price has entered the trading range of 1.3191 - 1.3370. Consolidation is forming above key support, but the market may test this area of interest before continuing its rise at the European session's opening. A false breakdown and price holding above 1.3191 could support further growth.
Best regards, R. Linda!

SOLANA → Countertrend correction. Bear market BINANCE:SOLUSDT.P is forming a correction after retesting the intermediate bottom of 120.0. Ahead lies a fairly strong and important zone of interest, to which the market may react...
The market structure is bearish. After updating the low within the bearish trend, a countertrend correction to the liquidity zone is forming. A retest of resistance at 143-145 may end in a false breakout and a fall.
Bitcoin is also stagnating. There is no strong support from the fundamental side, and the market is also far from technical support. There is still potential for a fall...
Resistance levels: 143.35, 145.67, 150.8
Support levels: 133.12, 128.3
The coin is within the trading range of 120.0 - 144.0. Accordingly, after a retest of support, a retest of resistance is forming, but pressure on the market is being exerted by a weak fundamental background and a downward trend. A false breakout of this zone of interest could trigger a sell-off...
Best regards, R. Linda!

BITCOIN → Retest of the 94,000 zone of interest...BINANCE:BTCUSDT.P is rebounding from its interim low of 80,000. However, it is still too early to talk about a bull market, as a countertrend correction is forming under the current circumstances.
Globally, Bitcoin is in a downtrend, with the zone of interest for a countertrend correction being 94,000-95,000. The market structure is bearish, and a retest of the break-even zone could trigger a downward movement within the trend.
After a strong liquidation to 80K, the market is forming a pullback, which is a basic phenomenon. There is no confirmation of a trend reversal yet, and the fundamental background is neutral, without clear support. Various analytical services suggest that the market is in a cleansing phase and has so far only liquidated short-term traders, reaching a cumulative average break-even price. A classic pullback. Technically, the zone of interest or magnet for the medium-term market is 75K (on the daily timeframe).
Resistance levels: 93,000, 94,000, 97,300
Support levels: 89,000, 86,000
In the current situation: a bearish trend, weak purchasing power, and a weak fundamental background, I consider a pullback to be the primary reaction to the 93-94K zone. However, the market is not constant, and if support appears (news or other drivers) and Bitcoin manages to stay above 95K, then growth can be expected.
Sincerely, R. Linda!

ANFIBO XAUUSD – Fibonacci Breakout and Continuation Plan
Hi guys, Anfibo’s here!
XAUUSD Weekly Trading Plan
Overall Picture
On the 4H chart, gold has broken out of the previous descending trendline and is now trending inside a rising bullish channel. Price is pushing toward the upper boundary of this channel, and the next key reaction zone is where:
The new uptrend channel resistance
The old descending trendline (now potential resistance)
And the Fibonacci extension cluster
all line up around the 4240s.
This is where I expect the market to show its hand:
Either give a short-term corrective pullback,
Or consolidate and build energy for a continuation rally toward the higher Fibonacci extensions (2.618 around the 4370–4380 zone).
Macro Context – Why USD Still Matters
From a macro perspective, the U.S. Government and Treasury have a direct impact on the U.S. Dollar Index (DXY) through:
Fiscal policy (budgets, new laws, spending programs)
Announcements from the administration
Treasury funding needs and issuance
At the same time, U.S. GDP data is a core driver of dollar sentiment:
Stronger‐than‐expected GDP → supports DXY → often weighs on gold.
Weaker GDP or slowdown signals → pressures DXY → tends to support gold.
So while the chart is clearly giving us a bullish technical structure, the strength or weakness of upcoming U.S. data will strongly influence whether gold can sustain a breakout beyond these Fibonacci levels or get capped and pull back deeper.
Trading Plan – Using Fibonacci and Structure
For next week, I’m working with one tactical short setup at resistance and one continuation buy setup on the dip.
>>> Scenario #1 – Short-Term SELL at Fibonacci Resistance
If price extends into the confluence zone around 4240+ and shows rejection, I’ll treat it as a counter-trend sell opportunity:
Sell entry: 4241 – 4243
Stop loss: 4248
Take profit levels:4210-4194-4165-4120
Idea: fade the first touch into the Fibonacci + trendline resistance box, targeting a corrective leg back towards mid-channel support and potentially the lower part of the structure around 4120 if sellers step in aggressively.
>>> Scenario #2 – BUY the Continuation from 4194 Support
If the market respects the breakout and only offers a shallow pullback, I’ll look to join the trend from the key support / Fibonacci area:
Buy entry: around 4194
Stop loss: 4185
Take profit levels:
TP1: 4210
TP2: 4235
TP3: higher extension zone toward the 2.618 area (4370+ if momentum continues)
Idea: use 4194 as a continuation buy zone, where broken resistance + Fib support align, aiming to ride the next impulsive leg higher inside the ascending channel.
Key Technical Levels for the Week
Resistance / Sell zone: 4241 – 4243
Intermediate resistance: 4235, then higher at the Fib extension band near 4370–4380
Support / Buy zone: 4194
Deeper supports: 4165 and 4120 (bottom of corrective structure)
As long as price holds above the 4165–4120 block on a closing basis, the medium-term bias remains bullish.
Risk Management
Treat the sell setup as tactical / short-term against higher timeframe bullish structure.
Always wait for clear confirmation (rejection wick, slowdown, or shift in 4H / 1H structure) at 4240s before entering shorts.
Keep Risk:Reward ≥ 1:2 on both scenarios; avoid forcing trades in the middle of the range.
Do not hold opposing positions simultaneously – follow the scenario the market confirms first.
If strong fundamentals (e.g., very strong GDP, hawkish fiscal tone) push DXY sharply higher or lower, be ready to reassess the bias instead of clinging to the plan.
Conclusion
Gold has flipped from a descending structure to a rising channel, and Fibonacci confluences are giving us clear, objective levels to work with next week. Whether price reacts with a short-term pullback from 4240s or respects 4194 as continuation support, we already know:
Where to sell tactically,
Where to buy with the trend,
And how our risk is defined.
LET THE LEVELS GUIDE YOU, TRADE WITH CONFIDENCE, AND STAY DISCIPLINED, GUYS! 💛📈
