SOLANA → Countertrend correction. Bear market BINANCE:SOLUSDT.P is forming a correction after retesting the intermediate bottom of 120.0. Ahead lies a fairly strong and important zone of interest, to which the market may react...
The market structure is bearish. After updating the low within the bearish trend, a countertrend correction to the liquidity zone is forming. A retest of resistance at 143-145 may end in a false breakout and a fall.
Bitcoin is also stagnating. There is no strong support from the fundamental side, and the market is also far from technical support. There is still potential for a fall...
Resistance levels: 143.35, 145.67, 150.8
Support levels: 133.12, 128.3
The coin is within the trading range of 120.0 - 144.0. Accordingly, after a retest of support, a retest of resistance is forming, but pressure on the market is being exerted by a weak fundamental background and a downward trend. A false breakout of this zone of interest could trigger a sell-off...
Best regards, R. Linda!
Fibonacci Retracement

BITCOIN → Retest of the 94,000 zone of interest...BINANCE:BTCUSDT.P is rebounding from its interim low of 80,000. However, it is still too early to talk about a bull market, as a countertrend correction is forming under the current circumstances.
Globally, Bitcoin is in a downtrend, with the zone of interest for a countertrend correction being 94,000-95,000. The market structure is bearish, and a retest of the break-even zone could trigger a downward movement within the trend.
After a strong liquidation to 80K, the market is forming a pullback, which is a basic phenomenon. There is no confirmation of a trend reversal yet, and the fundamental background is neutral, without clear support. Various analytical services suggest that the market is in a cleansing phase and has so far only liquidated short-term traders, reaching a cumulative average break-even price. A classic pullback. Technically, the zone of interest or magnet for the medium-term market is 75K (on the daily timeframe).
Resistance levels: 93,000, 94,000, 97,300
Support levels: 89,000, 86,000
In the current situation: a bearish trend, weak purchasing power, and a weak fundamental background, I consider a pullback to be the primary reaction to the 93-94K zone. However, the market is not constant, and if support appears (news or other drivers) and Bitcoin manages to stay above 95K, then growth can be expected.
Sincerely, R. Linda!

ANFIBO XAUUSD – Fibonacci Breakout and Continuation Plan
Hi guys, Anfibo’s here!
XAUUSD Weekly Trading Plan
Overall Picture
On the 4H chart, gold has broken out of the previous descending trendline and is now trending inside a rising bullish channel. Price is pushing toward the upper boundary of this channel, and the next key reaction zone is where:
The new uptrend channel resistance
The old descending trendline (now potential resistance)
And the Fibonacci extension cluster
all line up around the 4240s.
This is where I expect the market to show its hand:
Either give a short-term corrective pullback,
Or consolidate and build energy for a continuation rally toward the higher Fibonacci extensions (2.618 around the 4370–4380 zone).
Macro Context – Why USD Still Matters
From a macro perspective, the U.S. Government and Treasury have a direct impact on the U.S. Dollar Index (DXY) through:
Fiscal policy (budgets, new laws, spending programs)
Announcements from the administration
Treasury funding needs and issuance
At the same time, U.S. GDP data is a core driver of dollar sentiment:
Stronger‐than‐expected GDP → supports DXY → often weighs on gold.
Weaker GDP or slowdown signals → pressures DXY → tends to support gold.
So while the chart is clearly giving us a bullish technical structure, the strength or weakness of upcoming U.S. data will strongly influence whether gold can sustain a breakout beyond these Fibonacci levels or get capped and pull back deeper.
Trading Plan – Using Fibonacci and Structure
For next week, I’m working with one tactical short setup at resistance and one continuation buy setup on the dip.
>>> Scenario #1 – Short-Term SELL at Fibonacci Resistance
If price extends into the confluence zone around 4240+ and shows rejection, I’ll treat it as a counter-trend sell opportunity:
Sell entry: 4241 – 4243
Stop loss: 4248
Take profit levels:4210-4194-4165-4120
Idea: fade the first touch into the Fibonacci + trendline resistance box, targeting a corrective leg back towards mid-channel support and potentially the lower part of the structure around 4120 if sellers step in aggressively.
>>> Scenario #2 – BUY the Continuation from 4194 Support
If the market respects the breakout and only offers a shallow pullback, I’ll look to join the trend from the key support / Fibonacci area:
Buy entry: around 4194
Stop loss: 4185
Take profit levels:
TP1: 4210
TP2: 4235
TP3: higher extension zone toward the 2.618 area (4370+ if momentum continues)
Idea: use 4194 as a continuation buy zone, where broken resistance + Fib support align, aiming to ride the next impulsive leg higher inside the ascending channel.
Key Technical Levels for the Week
Resistance / Sell zone: 4241 – 4243
Intermediate resistance: 4235, then higher at the Fib extension band near 4370–4380
Support / Buy zone: 4194
Deeper supports: 4165 and 4120 (bottom of corrective structure)
As long as price holds above the 4165–4120 block on a closing basis, the medium-term bias remains bullish.
Risk Management
Treat the sell setup as tactical / short-term against higher timeframe bullish structure.
Always wait for clear confirmation (rejection wick, slowdown, or shift in 4H / 1H structure) at 4240s before entering shorts.
Keep Risk:Reward ≥ 1:2 on both scenarios; avoid forcing trades in the middle of the range.
Do not hold opposing positions simultaneously – follow the scenario the market confirms first.
If strong fundamentals (e.g., very strong GDP, hawkish fiscal tone) push DXY sharply higher or lower, be ready to reassess the bias instead of clinging to the plan.
Conclusion
Gold has flipped from a descending structure to a rising channel, and Fibonacci confluences are giving us clear, objective levels to work with next week. Whether price reacts with a short-term pullback from 4240s or respects 4194 as continuation support, we already know:
Where to sell tactically,
Where to buy with the trend,
And how our risk is defined.
LET THE LEVELS GUIDE YOU, TRADE WITH CONFIDENCE, AND STAY DISCIPLINED, GUYS! 💛📈

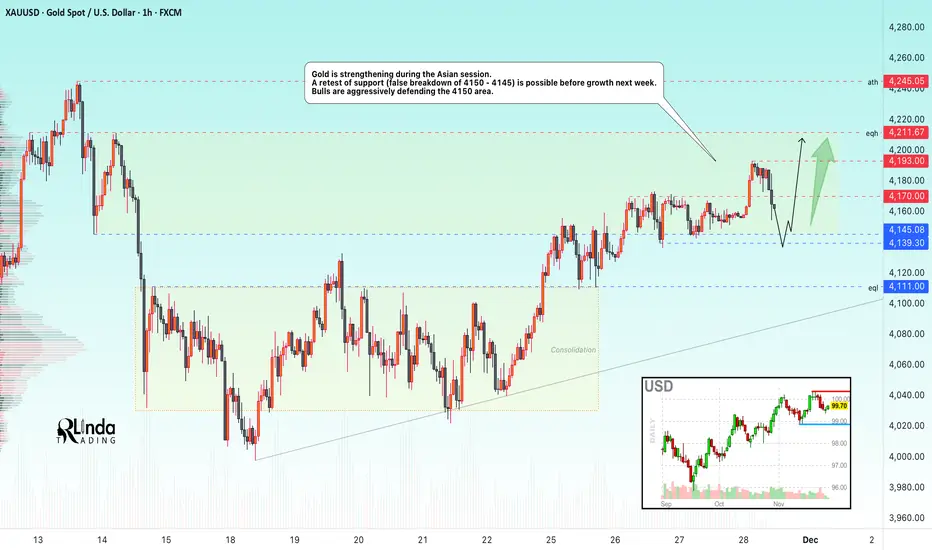
GOLD → Consolidation above 4150 amid a bullish market FX:XAUUSD breaks through 4170 and renews its high to 4193 during the Asian trading session. But further on, the market may consolidate before a possible continuation of growth...
The probability of a Fed rate cut in December remains at 82%. Geopolitical risks (Russia-Ukraine) continue to support demand for safe-haven assets. Weekly growth continues, but consolidation above $4170-4190 is required for the movement to continue.
However, low liquidity is expected on Thursday/Friday due to the holidays in the US. There may not be any strong movement, but volatility could be high during the European/American session...
Focus on the current trading range of 4150-4193...
Resistance levels: 4170, 4193, 4211
Support levels: 4150, 4145, 4139
The market is bullish both globally and locally. Accordingly, within the current trading range, gold may form a long squeeze relative to support and the liquidity zone at 4150. If the fundamental background does not change over the weekend, growth may continue next week...
Best regards, R. Linda!
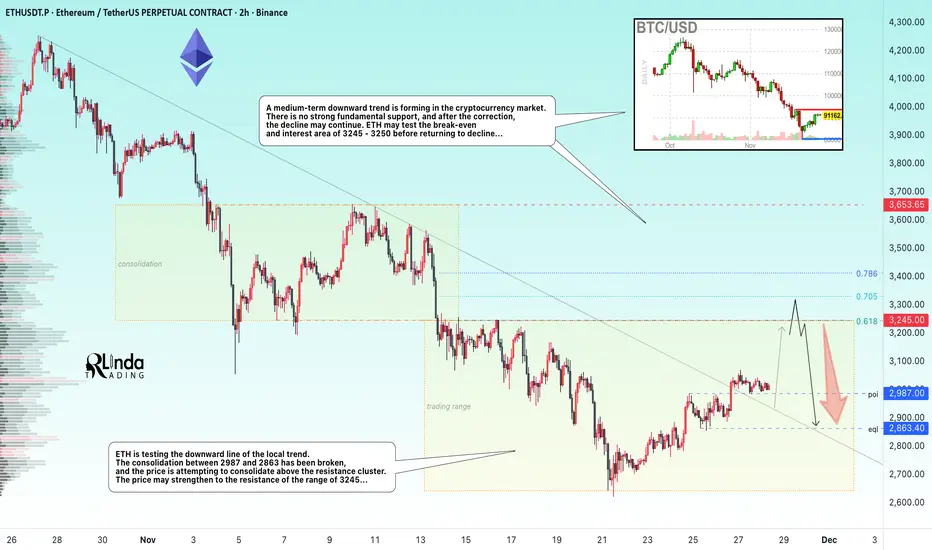
ETHEREUM → Countertrend correction. The hunt for liquidity BINANCE:ETHUSDT is testing the downward trend line and attempting to break through the resistance conglomerate. Overall, against the backdrop of low liquidity, the market has the opportunity to test 3245...
Against the backdrop of low liquidity and without the presence of the American side in trading, ETH is testing the downward line of the local trend. A medium-term downtrend is forming in the cryptocurrency market. There is no strong fundamental support, and after the correction, the decline may continue. Any attempts at growth at this point can be seen as an opportunity to sell profitably...
A breakout is forming and an attempt is being made to keep the price in the long zone. If the bulls keep the price above 2897 after retesting support, the price is likely to strengthen to the resistance range of 3245... However, a false breakout (liquidity capture) of key resistance may remind the market of the relevance of the downward trend...
Resistance levels: 3000, 3245
Support levels: 2987, 2863
I expect two movements. If the price stays above 2987 (after retesting), then Ethereum will be able to retest the resistance of the range. A false breakout of the resistance range could trigger a price decline within the global downtrend that has been developing for 3 months...
Best regards, R. Linda!
GOLD → Consolidation above the support level of the new rangeFX:XAUUSD is consolidating above 4150 but within the distribution phase after breaking through consolidation. The upward price movement is supported by the weakening of the dollar...
The metal remains on track for a fourth month of growth thanks to expectations of further Fed rate cuts and geopolitical tensions.
Despite strong US data, markets are still pricing in a 76-85% probability of a rate cut in December. The dollar is weakening, although yields are rising slightly.
Against the backdrop of the holiday week in the US, volatility may decrease and gold may consolidate. Talks about a possible peace between Russia and Ukraine could reduce demand for safe-haven assets, but the overall backdrop remains favorable for XAU/USD growth.
Resistance levels: 4170, 4211
Support levels: 4146, 4139
Gold is consolidating above the key support zone of 4140-4146. A long squeeze could trigger a shift in market imbalance in favor of buyers. If the bulls keep the price above 4150, this could trigger further growth, a breakout of 4170, and a retest of 4211.
Best regards, R. Linda!

EURUSD → Formation of an intermediate bottom...FX:EURUSD is forming a consolidation, which hints at a halt in the downward correction. The market is waiting for news that could trigger strong movements...
The dollar is pausing and moving into consolidation. If the index enters a correction phase, the euro will go up. A breakout of 1.155 could confirm a change in the local trend and trigger a rally.
The price is trading within a downward price channel; locally, the market is not ready to update the low and is consolidating above 1.150 and 0.7f. Accordingly, the focus is on the current consolidation: 1.150 - 1.155
Resistance levels: 1.155, 1.1606
Support levels: 1.1524, 1.1502, 1.1473
The price is currently consolidating, which means that the market is preparing for possible movements. A breakout of one or another boundary could trigger a rally. A breakout of resistance will confirm a change in the local trend. However, a breakout of support could trigger a continued decline to 1.1473.
Best regards, R. Linda!

ETH/USD 1D chart review1️⃣ Trend and general context
• ETH is trading after a sharp decline from its local high of ~4,000+.
• The price rebounded from a quite strong support zone around ~2,750–2,800.
• Current price: ~USD 3,034 → the market is testing the first local resistance.
Short-term trend: down, but a rebound and the first signs of reversal are visible.
Long-term trend: still upwards (HL/HH on large intervals).
⸻
2️⃣ Key Levels (from your chart)
🟩 Resistances
• USD 3,475 – key resistance + SMA (blue)
👉 if ETH breaks this level and closes 1D above → strong bullish signal.
• USD 4,061 – major resistance from previous highs.
🟥 Support
• USD 2,757 – the nearest strong support after breaking the trendline.
• USD 2,126 – very key macro support (bottom of consolidation).
⸻
3️⃣ Medium SMA
From your chart:
• Red SMA #1 – price is just above it → first positive signal.
• Blue SMA #5 – Acts as resistance and is currently being tested from below.
• Green SMA #2 – higher, acts as resistance at ~USD 3.475.
➡ The price must return above the blue and green SMA to confirm the return of the upward trend.
⸻
4️⃣ MACD
• The MACD at the bottom of the chart begins to curl upwards.
• The histogram decreases towards zero → the downward momentum weakens.
• Bullish cross is still missing, but it's getting closer.
Conclusion: Early signal of trend reversal, but not confirmed.
⸻
5️⃣ RSI
• RSI is in the zone around 40 → quite low, but not extremely.
• Slight divergence: the price made a lower low, the RSI made a higher one.
👉 This is a bullish signal, but only in combination with a resistance breakout.
⸻
6️⃣ Price Action
You can see:
• A long rising candle after a bounce from below.
• We are approaching the first important resistance at ~3.100–3.150.
To confirm continuation, you need:
✔ Closing of the 1D candle above ~3.150–3.200.
⸻
🎯 What might happen next?
Bull scenario (more likely if BTC also increases)
1. Breakout 3,150–3,200 → retest → move to:
• USD 3,475 (major resistance + SMA)
• then 3,800+
2. MACD makes a bullish cross → momentum is growing.
Probability: ~60%, but confirmation only after the breakout.
⸻
The Bears Scenario
1. Rejection from SMA (blue) and return below 3,000
2. Down to 2,750-2,800 again
3. If this breaks → move towards $2.126
Probability: ~40% at this point.

QUICK ANALYSIS (1H) — BTC BOUNCED FROM RESISTANCE✅ 1. Breakout from the downward trendline
On the chart, I see:
a yellow downward trendline—it has been broken,
the candlestick dynamically breaks through it and closes above it.
➡️ This is the first signal of a shift in momentum to upward.
✅ 2. Price is testing the 200 SMA (blue)
BTC is currently:
touching the 200 SMA,
bounces slightly downward—a classic reaction to strong resistance.
➡️ Until we break through the 200 SMA, the market remains in a downtrend.
🟩 3. Nearest resistance levels (green levels on your chart):
90,400 USDT – current resistance (reaction already visible)
92,500 USDT – next important level
93,200–94,000 USDT – strong supply zone
94,900 USDT – strong level from previous bounces
➡️ The closer the price gets to 94–95k, the greater the chance of a downward rebound.
🟥 4. Nearest support levels
From your red levels:
88,700 USDT – first level of defense
87,500 USDT – key support
85,500 USDT – major local bottom
84,150 USDT – extreme support
➡️ If BTC returns below 87.5k, the correction will deepen.
📊 5. RSI — Neutral-Bullet
RSI ~ 55,
Not yet overbought,
RSI trend is increasing.
➡️ There is room for further upward movement.
📉 6. MACD — Bullish Signal
MACD has crossed the signal line upward,
the histogram is rising.
➡️ Upward momentum, shorting here is risky.

XAUUSD WXAUUSD is in an uptrend and may retest the marked area. After that, the trend is likely to continue. Key levels are important to monitor to see how the market reacts from this point.

GOLD → Distribution phase. Focus on 4150...FX:XAUUSD is trading at a one-and-a-half-week high, supported by a weaker dollar and growing expectations of Fed policy easing. More news ahead...
US PPI inflation showed signs of slowing (2.7% y/y). Retail sales and consumer confidence were weaker than expected. The probability of a Fed rate cut in December rose to 85%. Fed members (Williams, Waller, Miran) supported the possibility of easing
However, progress in Russia-Ukraine negotiations is limiting growth
Today, attention is focused on data on jobless claims and durable goods orders
The combination of soft monetary policy, geopolitical risks, and structural demand from the Central Bank creates a favorable backdrop.
Resistance levels: 4156, 4211
Support levels: 4146, 4111
Gold continues to recover after breaking out of consolidation and holding above 4110. Focus on the next trading range (consolidation) of 4156 - 4111. If the bulls keep the price above 4146 - 4156, the next target could be 4211 - 4245.
Best regards, R. Linda!

EURUSD - price at critical resistanceFurther to my previous idea on EURUSD, the price respected the resistance at 1.16300-1.16500.
Yesterday the price rebound on (finally) published data and reached the key Resistance at 1.16.
If this is Resistance is respected, We are returning to the downtrend and in my view the price will continue down to ~1.14.
Just my humble opinion

PNB: Weekly Rounding Bottom Breakout! 🚀 PNB: Weekly Rounding Bottom Breakout! 🚀
📉 CMP: ₹111.16
🔒 Stop Loss: ₹99
🎯 Targets: ₹117 | ₹126 | ₹133
🔍 Why PNB Looks Strong?
✅ Technical Breakout: Rounding bottom breakout confirmed on weekly charts
✅ Retest Support: Successful retest at 40 EMA, strengthening bullish bias
✅ Sector Boost: With rate cuts supporting banking, PNB as a laggard may catch up with upside momentum, especially with improving results
💡 Strategy & Risk Management:
📈 Staggered Entry: Ideal to accumulate in phases
🔒 Strict SL: Maintain stop loss at ₹99 to manage downside risk
📍 Outlook: Strong technical setup + sector tailwind = promising swing and positional trade opportunity.
📉 Disclaimer: Not SEBI-registered. Please do your own research or consult a financial advisor before investing.
#PNB #BankingStocks #BreakoutTrading #TechnicalAnalysis #SwingTrading #StockMarketIndia #InvestmentOpportunities

Balrampur Chini: Eyeing All-Time High! 🚀 Balrampur Chini: Eyeing All-Time High! 🚀
📉 CMP: ₹619
🔒 Stop Loss: ₹575
🎯 Target: ₹700
🔍 Why Balrampur Chini Looks Promising?
✅ Technical Strength: Trading above 61.8% Fibonacci level post-correction, indicating strong support
✅ Consolidation Base: Tight range between ₹615–₹580 signals accumulation before a potential breakout
✅ Upside Potential: Breakout from current range could take the stock to all-time high levels
💡 Strategy & Risk Management:
📈 Staggered Entry: Accumulate in phases as the market remains sideways; avoid expecting sharp moves
🔒 Strict SL: Maintain stop loss at ₹575 to manage risk effectively
📍 Outlook: Strong base formation with Fibonacci support makes Balrampur Chini an attractive swing opportunity towards ₹700.
📉 Disclaimer: Not SEBI-registered. Please do your own research or consult a financial advisor before investing.
#BalrampurChini #SugarStocks #TechnicalAnalysis #BreakoutTrade #SwingTrading #StockMarketIndia #InvestmentOpportunities

Hero MotoCorp: Reversal in Sight? 🚀 Hero MotoCorp: Reversal in Sight? 🚀
📉 CMP: ₹4438
🔒 Stop Loss: ₹4090
🎯 Targets: ₹5030 | ₹5700
🔍 Why Hero MotoCorp Looks Promising?
✅ Rounding Bottom Breakout: Weekly close above ₹4412 confirms this bullish reversal pattern
✅ Box Breakout: 8-week consolidation range of ₹4454–₹4202 broken above ₹4460, signalling strength
✅ Flag & Pole Setup: Larger range of ₹3354–₹4454 forms a flag-pole structure with breakout above ₹4460
💡 Strategic Insight:
📈 Confirmation Level: A weekly close above ₹4500 will further confirm reversal for long-term upside
🔒 Strict SL: Maintain stop loss at ₹4190 to manage downside risks effectively
📍 Outlook: Multiple technical setups indicate potential for a long-term bullish reversal with targets up to ₹5700.
📉 Disclaimer: Not SEBI-registered. Please do your own research or consult a financial advisor before investing.
#HeroMotoCorp #AutoSector #TechnicalAnalysis #BreakoutTrade #ReversalPattern #SwingTrading #StockMarketIndia #InvestmentOpportunity

Will LINK recover after the information about the ETF?📌 1. Main trend
• A clear downward trend, confirmed by a strong, long-term downward trend line (black).
• The price is testing this line from below for the first time in a long time → a key moment.
If the price breaks it and retests, the trend structure changes.
⸻
📌 2. Current situation
Price currently: ~13.02 USDT
Upcoming levels:
Support
• 12.71 – local support (yellow line).
• 11.75 – strong support, here a demand reaction appeared.
• 9.95 – the greatest support on the chart (red line).
Resistances
• 1:30 p.m.–1:50 p.m. – trend line test; key resistance.
• 15.25 – the first significant resistance in the upward trend.
• 17.78
• 19.77
• 21.70
⸻
📌 3. Stoch RSI (at the bottom of the chart)
• The oscillator is high, approaching the overheating zone (80+).
• This signals a possible short-term correction, unless the downtrend breaks out - then it may stay high for a long time.
⸻
📌 4. Key setup
🔵 Bullish (upward scenario)
Confirmation of growth appears only if:
✔ The price will break the black downtrend line
✔ Will close the 12H candle above approximately 1:50 p.m
✔ Will retest and bounce up
Targets after breakout:
1. 15.25
2. 17.78
3. 19.77 - only here it will encounter stronger resistance
⸻
🔴 Bearish (downside scenario)
If the price does not break the trendline and is rejected ↓:
❗ Downside targets:
• 12.71 (local support – first test)
• If it breaks → 11.75
• And in case of market panic → 9.95
The latter is a powerful level - the level of accumulation from earlier months.
⸻
📌 5. What looks best?
Currently:
• The market rebounded from the support at 11.75 – healthy demand response.
• However, the price is below a strong trendline, so this is a place where it may be rejected.
➡ If I were to indicate the most likely short move:
Light correction → retest 12.71 → decision.
⸻
📌 6. Summary
• A key moment for LINK - it decides to break the downward trend.
• Only a close above 1:50 p.m. gives a real upward signal.
• Failure to break the trendline = possible return to 12.71 → 11.75.

GOLD → Psychological level retest before growth FX:XAUUSD breaks through consolidation resistance and renews its high to 4155. As part of a minor correction, a retest of 4100 may form and a battle for key support...
The probability of a Fed rate cut in December has risen to 81%. Fed members (Williams, Waller, Daly) supported the possibility of easing this year.
Progress in negotiations between the West and Ukraine with Russia reduces demand for defensive assets.
Gold remains sensitive to inflation and retail sales data. Strong figures could adjust rate expectations and limit growth, while weak data would support the bulls.
Technically, a retest of the 4110-4100 zone is forming. If the bulls hold their ground above this level, a new trading range of 4100-4150 could form.
Resistance levels: 4155, 4211
Support levels: 4111, 4100
The importance of the 4100 zone is that it is an area of imbalance and breakeven, a consolidation boundary, as well as a psychological level. Accordingly, the reaction to this area should be aggressive. If the reaction is weak, the price may be dragged below 4100. Otherwise, I expect consolidation above 4111 and further growth to 4155 (possibly to 4200).
Best regards, R. Linda!

BNBUSDT → The hunt for liquidity before the decline BINANCE:BNBUSDT.P breaks through the 880 support level as part of a global downtrend and updates its low to 790. Fundamentally and technically, the situation is weak...
Bitcoin and the cryptocurrency market as a whole are in a global downtrend. Within the trend, countertrend corrections are forming as a “hunt for liquidity” before the decline continues...
After updating its low to 790.9, BNB is forming a pullback, the target of which may be the resistance area of 879-888, which acts as a break-even zone (area of interest for MM). A false breakout could trigger a decline of 1/2, 2/3 of the current range.
Resistance levels: 879-880, 940
Support levels: 837, 814, 790
A retest of resistance and a lack of bullish potential could trigger a false breakout. Consolidation and a close below 879 could lead to another phase of selling and a correction to 837-814.
Best regards, R. Linda!

DOT: Bullish Swing SetupIn this chart, the main focus is on the clear bullish divergence forming on the RSI, signaling a possible shift toward buyers regaining control. To find upside targets, I’ve added Fibonacci levels from recent swing highs to lows, marking key price zones where DOT could encounter resistance and potential breakout acceleration.
If momentum builds, the target is the golden ratio at $2.93, which historically acts as a strong magnet for price in retracement moves.
Another confluence is USDT.D at major resistance and soon a new fed cut will be priced in until 10th of December

Kotak Near Crucial Support Zone — Opportunity AheadThis is the daily timeframe chart of Kotak Bank.
The stock is moving within a well-defined parallel channel, with a key support zone around 1950–2000.
When applying the Fibonacci retracement from the recent low to high, the 2050 level aligns as an important support area.
This 2050 zone is also confirmed by the pivot levels—whenever this level holds, the stock avoids further decline and maintains a range-bound movement. For the past month, Kotak Bank has been trading between two key pivot levels:
Quarterly Pivot: 2050
Monthly Pivot: 2120 (which will shift after monthly expiry)
A breakout above the monthly pivot can trigger further upside, with potential targets around 2330–2350.
If the support continues to hold, we may see higher levels in the stock.
Thank you.

GOLD → Neutral price channel... Waiting for news FX:XAUUSD is testing the lower boundary of the 4060 channel and rebounding, maintaining moderate fluctuations in anticipation of key US data. Focus on 4040 - 4100...
The probability of a Fed rate cut in December has risen to 74% following comments by J. Williams
The unusual situation surrounding the Russia-Ukraine conflict means that any hints of de-escalation could trigger a correction in the metal...
The trading week will be relatively short, as Thursday and Friday are public holidays in the US, and the market may see reduced volatility.
Focus on the following news:
- PPI (forecast +0.3%) and US retail sales
- Q3 GDP and PCE index (inflation)
Gold remains sensitive to Fed comments and geopolitics. Strong data could lower expectations for policy easing. A breakout is likely after the release of inflation data and GDP. Rising odds of a rate cut in December limit downside potential.
Resistance levels: 4100, 4111
Support levels: 4040, 4024
Gold is being held within its current trading range. The last four trading sessions indicate uncertainty about the future direction. In this case, it is worth considering trading within the current boundaries first. I expect a retest of resistance and a subsequent downward rebound.
Best regards, R. Linda!

BTC/USDT 4H Chart Review1. Local trend
The chart shows:
✔️ Clear upward trend - the price respects the rising trend line (black diagonal).
✔️ The last candle broke strongly upwards, which suggests bullish momentum.
⸻
🟢 Key resistance levels (green lines)
1. 90,352 USDT - the first stronger resistance (it looks like the price is just reaching it).
2. 93,271 USDT - another strong resistance; there may be a clearer sell-off here.
➡️ If it breaks 90,352 with high volume, the path to ~93k is open.
⸻
🔴 Key support levels (red lines)
1. 86,890 USDT - Local Support/Trendline Retest.
2. 84,989 USDT - Stronger support.
3. 82,545 USDT - key support for the growth structure.
➡️ Loss of 86,890 + breakout from the trendline may mean a correction to around 85,000.
⸻
📉 RSI / Stochastic (bottom of the chart)
Stochastic RSI is:
✔️ In the growth phase
✔️ Approaching overheating level (80-100)
➡️ This often means that the upside momentum continues, but a local correction may be imminent, especially at the 90,352 resistance.
⸻
📌 Summary
🔼 Bullish Signals:
• Uptrend intact
• Breakout with an upward impulse candle
• The price is rebounding from the trend line
🔽 Bearish Signals:
• Stochastic RSI is approaching the “high” zone
• The price is under important resistance at 90,352
• Local pullback possible if resistance is not broken
⸻
⭐ Short-term scenarios (4H)
👉 Bullish scenario
• Maintaining price above 88,800-89,000
• Breakout 90,352
➡️ Target: 93,000 – 93,300 USDT
👉 Bears scenario
• Rejection from 90,352
• Back below 88,900
➡️ Downside target: 86,900 → 85,000 USDT

$ALAB just tapped the Golden 618 fibALAB heavily into AI reported very strong earnings and is down $130 and just tapped the 618 golden Fibonacci level support
