FIL Is Losing Bearish Momentum => Bullish Takeover Soon?📉FIL has been printing a series of progressively weaker bearish impulses, first a big drop, then a smaller one, and now a flat one.
This loss of bearish strength is happening while price is hovering above a major demand zone (orange), a level that previously triggered a massive rally.
📉📈Notice how the bearish swings are curving and flattening (dotted pink curve). This is often an early sign that sellers are exhausting.
⚔️As long as FIL remains above the demand zone, we will be looking for bullish reversal setups, especially if price retests the orange zone one more time and rejects it.
🏹For the bulls to take over entirely, price needs to break above the blue consolidation zone, confirming a shift in momentum.
Do you think FIL is gearing up for a bigger move? Let me know below! 👇
⚠️ Disclaimer: This is not financial advice. Always do your own research and manage risk properly.
📚 Stick to your trading plan regarding entries, risk, and management.
Good luck! 🍀
All Strategies Are Good; If Managed Properly!
~Richard Nasr
FIL

FILUSDT Forming Bullish MomentumFIL/USDT is showing strong signs of bullish momentum, and the fundamentals are lining up in a way that supports a potential sustained move. On-chain metrics suggest increasing protocol activity: Filecoin’s network utility is rising, Q3 2025 saw utilization tick up, and active storage demand from enterprise and verified data clients remains robust.
From a fundamental perspective, FIL is deeply tied to real-world data storage demand. The token is used to incentivize storage providers and acts as collateral in the network. Token issuance is gradual and tied to network milestones, supporting long-term alignment. Furthermore, recent protocol upgrades like Proof of Data Possession are improving trust and efficiency, which could drive more enterprise-level adoption.
Economically, there are meaningful supply-side tailwinds. The block reward schedule is designed to decline over time, and a portion of circulating FIL may become deflationary due to network sinks and locking mechanisms.) At the same time, more FIL is being locked by storage providers as collateral, which reduces active supply and supports token value.

FIL/USDT — Brutal Rejection or the Beginning of Major Reversal?FIL/USDT is entering one of the most critical decision zones of the entire 2025 structure. After spending months inside a clean, well-defined downtrend (yellow trendline), FIL attempted a breakout — only to be met with a violent wick rejection, signaling heavy supply waiting above.
Price has now fallen back into the Golden Retracement zone (0.5–0.618 Fibonacci) — a region that often determines whether a market forms a true reversal or continues its larger downtrend. What happens here is pivotal.
---
🔶 Key Structure & Pattern Insights
1. Long-Term Downtrend Still in Control
Clear formation of lower highs and lower lows visible since early 2025.
The yellow descending trendline has acted as major resistance for almost the entire year.
2. False Breakout (Wick Rejection)
FIL broke above the trendline but failed to close above it.
This usually indicates upside liquidity grab, not a confirmed reversal.
3. Price Returns to the Critical Fibonacci Zone
0.5 = 2.155
0.618 = 1.968
A textbook retest region where major directional decisions often occur.
4. Layered Resistance Levels Above
If FIL stabilizes, these become the upside checkpoints:
2.65 → key confirmation level
3.27 → first major resistance
4.875 / 6.07 / 7.88 → structural targets if a full reversal unfolds
---
🟢 Bullish Scenario (True Reversal Potential)
Bullish bias becomes valid ONLY if:
✔ Price holds above 2.15–1.97 and forms a higher low
✔ A 2D/weekly close occurs above 2.65
If both conditions are met → the trend reversal becomes official.
Bullish targets:
3.27 – first major confirmation
4.875 – upside continuation
6.07 – mid-term target
7.88 – high zone that may trigger market FOMO
Additional Bullish signals:
Volume expansion on the 2.65 breakout
Clean retest of the Fibonacci zone
Strong-bodied candles instead of wick-driven spikes
---
🔴 Bearish Scenario (False Breakout Confirmed)
Bearish continuation strengthens if:
❌ Price breaks & closes below 1.97 (0.618 Fib)
If this happens → the previous breakout is fully confirmed as a false break, and the downtrend resumes.
Downside targets:
1.70–1.50 → major structural support
Breakdown below this region could send FIL to deeper lows
Additional Bearish signals:
Strong rejection near 2.15–2.20
Increasing sell volume
Weak reaction every time price retests the trendline
---
🎯 Key Takeaways
FIL is currently sitting at a major reversal zone or a continuation breakdown point.
📌 2.15–1.97 is the main battlefield
📌 Closing above 2.65 = multi-week bullish potential
📌 Losing 1.97 = downtrend continuation
📌 Watch 2D and weekly closes very closely
This is a decision zone — not a place for FOMO, but a place for precision and disciplined planning.
---
#FIL #FILUSDT #Filecoin #CryptoAnalysis #TechnicalAnalysis #TrendReversal #Fibonacci #Breakout #Rejection #CryptoTrading

FIL Update🚨📊 FIL Update
FIL has formed a new resistance zone in red 🔴.
This level is now acting as a strong ceiling,
and price must break out above this red resistance
to show any real bullish momentum again.
Until that breakout happens,
sellers remain in control and upside stays limited.

FIL: Moonvember Trade#FIL is a major project in the storage and DePIN sectors. Despite it's token unlocks, it recently formed a new ATL, followed by a solid rebound that could mark the start of a strong upward move.
Holding above $1.27 is essential for this bullish scenario.
#Filecoin

#FIL/USDT Ready for a Breakout? Analysis of a Long Accumulatio#FIL
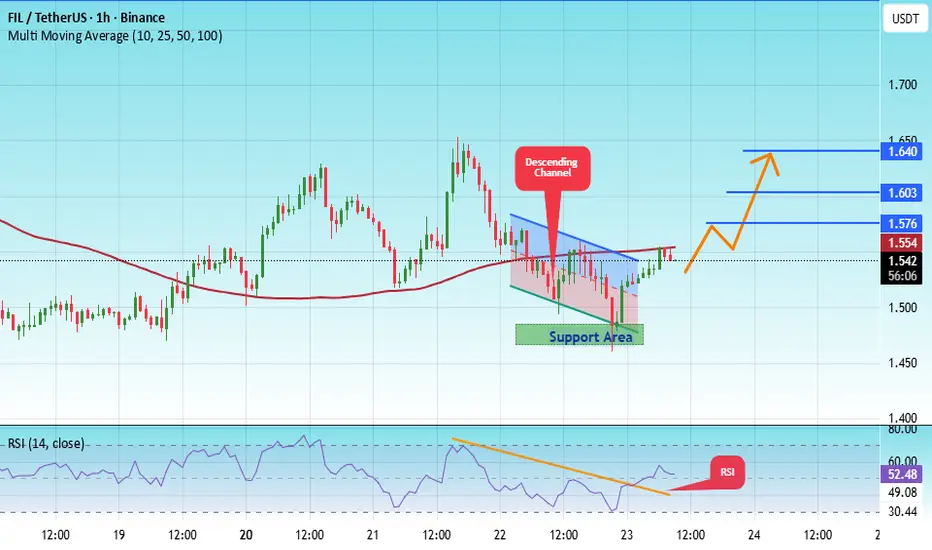
The price is moving within a descending channel on the 1-hour frame, adhering well to it, and is heading for a strong breakout and retest.
We have a bearish trend on the RSI indicator that is about to be broken and retested, which supports the upward breakout.
There is a major support area in green at 1.47, representing a strong support point.
We are heading for consolidation above the 100 moving average.
Entry price: 1.54.
First target: 1.57.
Second target: 1.60.
Third target: 1.64.
Don't forget a simple matter: capital management.
When you reach the first target, save some money and then change your stop-loss order to an entry order.
For inquiries, please leave a comment.
Thank you.
FIL - Momentum Shift Confirmed!📈After months of trading within a bearish descending channel, FIL has finally broken out with a strong bullish impulse, signaling a clear shift in market momentum. This breakout marks a potential end to the prolonged downtrend and the beginning of a new bullish phase.
🏹From here, I’ll be looking for trend-following long setups on every healthy correction, ideally after retesting the broken structure zone. The next key target lies around the $5 round number, which also aligns with a major resistance area on the higher timeframe.
⚔️As long as FIL holds above the previous breakout zone, the bulls remain in control.
⚠️ Disclaimer: This is not financial advice. Always do your own research and manage risk properly.
📊All Strategies Are Good; If Managed Properly!
~Richard Nasr

FILUSDT - Massive bullish patternIt broke the main trendline with a massive daily candle.
A Golden Cross pattern is forming — the 25 EMA is about to cross above the 50 EMA, as you can see.
The coin has been in accumulation for 276 days, initially breaking down to sweep liquidity, and now it’s trading back near that range.
If it breaks upward, it could easily rally 300% or more from here.
Best Regards:
Ceciliones🎯

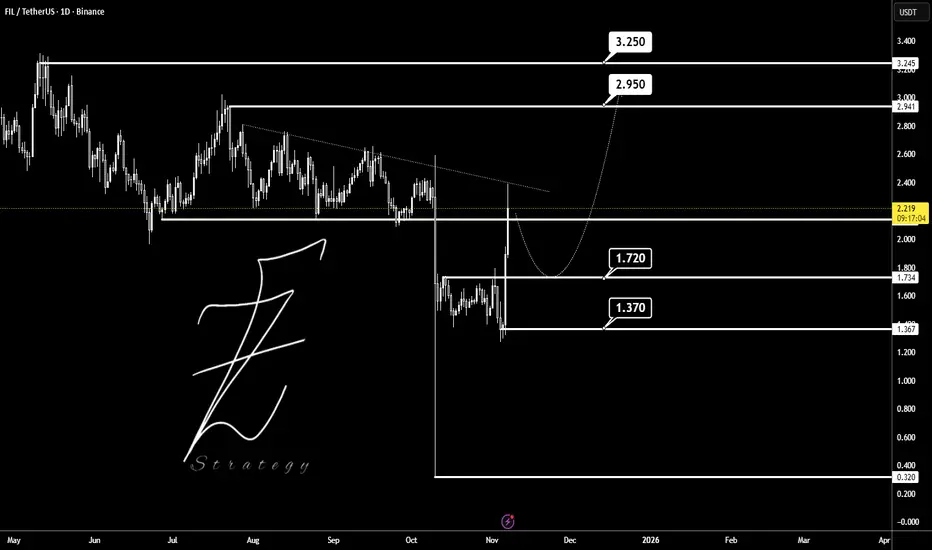
FILUSDTBINANCE:FILUSDT is now for breakout trendline but should pullback to 1.720$ and start up-trend to 3$.
FILUSDT Forming Falling WedgeFILUSDT is forming a clear falling wedge pattern, a classic bullish reversal signal that often indicates an upcoming breakout. The price has been consolidating within a narrowing range around $2.40 USDT, suggesting that selling pressure is weakening while buyers are beginning to regain control. With consistent volume confirming accumulation at lower levels, the setup hints at a potential bullish breakout soon. The projected move could lead to an impressive gain of 90% to 100%+ once the price breaks above the wedge resistance, drawing attention to FILUSDT price prediction in the decentralized storage sector.
This falling wedge pattern is typically seen at the end of downtrends or corrective phases, and it represents a potential shift in market sentiment from bearish to bullish. Traders closely watching FILUSDT are noting the strengthening momentum as it nears a breakout zone near $2.75. The good trading volume adds confidence to this pattern, showing that market participants are positioning early in anticipation of a reversal, especially with recent 67% daily surges signaling renewed interest.
Investors’ growing interest in FILUSDT reflects rising confidence in the project’s long-term fundamentals and current technical strength, particularly its role in powering scalable data storage for AI and DeFi applications. If the breakout confirms with sustained volume, this could mark the start of a fresh bullish leg. Traders might find this a valuable setup for medium-term gains, especially as the wedge pattern completes and buying momentum accelerates in falling wedge breakout crypto opportunities.
✅ Show your support by hitting the like button and ✅ Leaving a comment below! (What is You opinion about this Coin) Your feedback and engagement keep me inspired to share more insightful market analysis with you!

FIL/USDT — The Big Test: Real Breakout or Just Another Trap?After months of being trapped under a strong descending trendline, Filecoin (FIL) is finally showing signs of awakening. A strong bullish candle on the 2D timeframe has pierced through the long-term downtrend line — but the question remains: is this the beginning of a true reversal, or just a fake breakout before another drop?
---
🔹 Overview
Current price around $2.24, testing the descending trendline (yellow).
Key resistance levels: $2.65 → $3.27 → $4.875 → $6.07 → $7.88 (High $8.42).
Major support zones sit at $1.25–$1.50, with psychological support near $1.05.
---
🔸 Technical Pattern Analysis
The chart shows a prolonged accumulation phase beneath a descending trendline — a typical setup before a major directional shift.
The latest breakout candle signals possible momentum change, yet the market hasn’t given full confirmation.
If the next 2D close holds above the trendline and the $2.65 level, that would strongly suggest the end of the long-term downtrend, opening the door for a new bullish expansion phase.
---
🚀 Bullish Scenario
Confirmation Signs:
2D close above $2.65 with strong volume and a clean retest.
RSI and MACD showing momentum shift to the buyers.
Upside Targets:
First target: $3.27 (initial breakout zone).
Next targets: $4.875 → $6.07 → $7.88, if momentum continues.
Strategy:
Conservative entry after retest on trendline / $2.65.
Stop loss below $1.95.
Risk-to-Reward: 2:1 up to 3:1 if breakout holds.
Bullish Narrative:
“If the retest holds, FIL could be entering a new accumulation breakout phase — signaling the end of the long-term downtrend and the start of a mid-term rally toward $4–6.”
---
⚠️ Bearish Scenario
Conditions:
Failure to close above the trendline and fall back below $2.00–$2.20.
Rising sell volume confirming a false breakout or bull trap.
Implications:
Price could revisit the consolidation range $1.50–$1.25,
or even drop to $1.05 if bearish momentum strengthens.
Strategy:
Short entries only on clear rejection candles (strong red 2D + high volume).
Downside targets: $1.50 → $1.25, Stop Loss above $2.65.
Bearish Narrative:
“A failed breakout would indicate the market isn’t ready for a trend reversal — FIL may return to deeper consolidation before any sustainable move up.”
---
🔍 Key Takeaways
Breakout vs Breakdown — the chart is at a critical crossroads.
2D close above $2.65 = bullish confirmation.
Rejection from the trendline = potential for another false rally and continuation of the downtrend.
Momentum suggests something big is approaching — patience and confirmation are key.
---
🧭 Conclusion
The FIL/USDT chart currently represents a classic battle between bulls and bears.
A breakout of a long-term descending trendline doesn’t happen often — and its confirmation will decide the direction for months ahead.
If buyers manage to hold above the breakout level and print a new higher high, FIL could enter a significant recovery phase.
But if momentum fades and sellers regain control, the correction may deepen before any true reversal.
#FIL #FILUSDT #Filecoin #CryptoAnalysis #BreakoutWatch #TrendlineBreak #CryptoTrading #AltcoinAnalysis #TechnicalAnalysis

#FIL/USDT Ready for a Breakout? Analysis of a Long Accumulatio#FIL
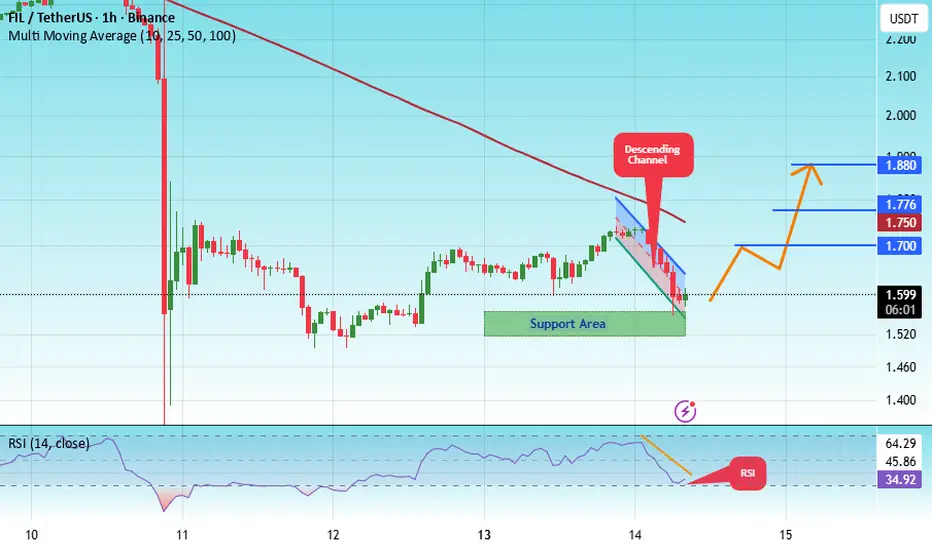
The price is moving within a descending channel on the 1-hour frame, adhering well to it, and is heading for a strong breakout and retest.
We have a bearish trend on the RSI indicator that is about to be broken and retested, which supports the upward breakout.
There is a major support area in green at 1.54, representing a strong support point.
We are heading for consolidation above the 100 moving average.
Entry price: 1.60
First target: 1.70
Second target: 1.77
Third target: 1.80
Don't forget a simple matter: capital management.
When you reach the first target, save some money and then change your stop-loss order to an entry order.
For inquiries, please leave a comment.
Thank you.
Filecoin: Ready for a Breakout? Analysis of a Long AccumulationFilecoin has been consolidating around its all-time lows for about two years now, marking a very long accumulation period that, in my opinion, will lead to an inevitable upward explosion once the main resistances are broken. At this moment, the first thing the price should do is break the trendline that has been suppressing it since the beginning of the year. Once this is broken and the price consolidates above $3, it should move toward $8, which is the last significant resistance where a reversal occurred. Once that resistance is broken, the bull market for FIL will truly begin. Given the project's fundamentals, I believe it is absolutely the most undervalued coin. Thank you all for your attention.

Filecoin - Still in accumulationHello everyone, as you know if you follow me, one of the coins I’ve been accumulating for years is FIL. From both a technical and fundamental analysis perspective, I believe it’s the bet with the absolute highest potential in the crypto world. Speaking of my analysis, as you can see, we’re still in an accumulation phase for about 2-3 years now, with a range between $2.3 and $7-10. In recent weeks, we’ve seen a retest of the all-time low, and right now it’s testing the lowest monthly close of the previous cycle. That said, I expect a fairly rapid rise toward $7 soon, with the possibility that it finally breaks out of the range and starts running toward the previous ATH at $230. In any case, the risk/reward is truly excellent, probably the best in the entire crypto market. Thanks to everyone for your attention, and I hope the video is helpful for your analyses.

FILECOIN -The accumulation is almost overMy favorite coin right now is FIL, for several reasons, the first is that the risk reward in this case is really exceptional considering the historical support very close and the last important point where the course has been reversed to about a 50X from here, the second fundamental factor is Grayscale which has not one but two funds dedicated to FIL, the first is a single-asset fund and the second has just been created and is called Decentralized AI Fund where Filecoin is the most important holding (more than 30%). That said, we have a coin with incredible potential that is great from both a technical analysis and fundamental analysis perspective

FIL can touch 1$ in the coming weeksFIL / USDT
The price just brokedown the Huge trading range (2022-2025) on weekly chart and price still find difficulty to restore the broken support
Our view for this coin in mid term is bearish and few weeks we can see FIL hits 1$ 📉
This is my macro view for FILUSD as long as price doesn’t reclaim the support with strong volume
Best of wishes

$FIL bull pennant to $3.00?Seeing this bull pennant form. Really would love to see this one run and break out of some HTF resistance zones.
FIL | Swing Trade Setup from Key Support ZoneFilecoin (FIL) is hovering near a major support zone between $2.47 and $2.55, offering a high-probability swing trade opportunity. The recent pullback has brought price action into a known demand area, and while momentum has cooled off, the broader market structure remains bullish. If the level holds, FIL could rebound toward multiple resistance targets in the coming sessions.
🔹 Trade Setup
• Entry Zone: $2.47 – $2.55
• Take Profit Targets:
🥇 $2.67 – $2.80
🥈 $3.00
• Stop Loss: Daily candle close below $2.36
#FIL #Filecoin #CryptoTrading #SwingTrade #SupportAndResistance #Altcoins #TradingSetup #TechnicalAnalysis #CryptoIdeas

FIL is Ready to Move 200% + Up FIL is making a Triangle pattern at Support zone and It is Ready for Breakout from that pattern . and at the same time Altcoin Season Index is at 74 , when it is >75 it is sign of very bullish in altcoins and Breakouts will have very high potential to give a big move .
and at the same time Bitcoin dominance is decreasing and altcoins dominance is started increasing , so look on all the altcoins
and follow proper risk management , it has very good chances to move UP side but first we have to protect the down side , where risk management comes into game .
Follow for more Ideas and potential coins/ Stocks .
FIL (SPOT)BINANCE:FILUSDT
#FIL / USDT
Entry range (2.230- 2.350)
SL 1D close below 2.130
T1 3.300
T2 4.600
Extra Target is optional 7.500
_______________________________________________________
Golden Advices.
********************
* collect the coin slowly in the entry range.
* Please calculate your losses before the entry.
* Do not enter any trade you find it not suitable for you.
* No FOMO - No Rush , it is a long journey.

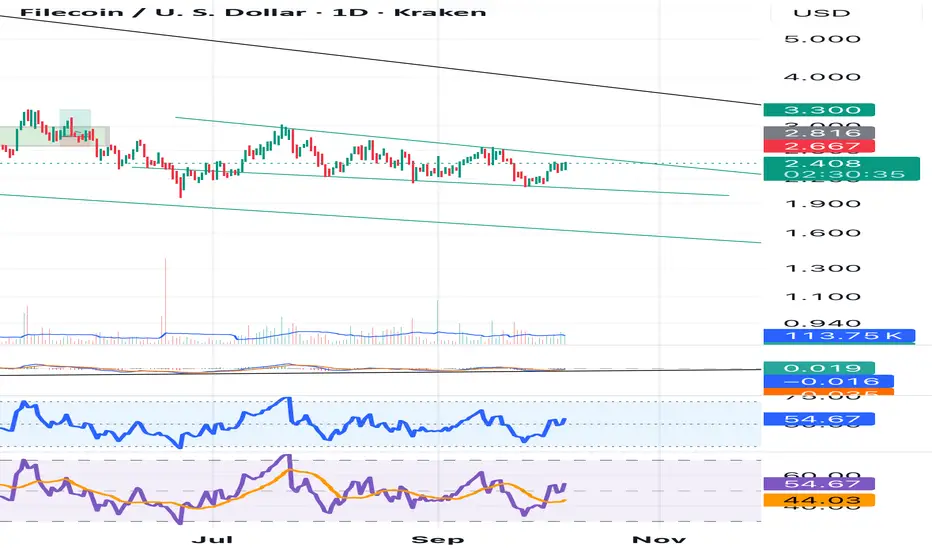
FIL/USDT — Bearish Continuation vs Potential Reversal?Currently, Filecoin (FIL) is trading at a critical decision point on the daily timeframe. The chart shows a clear descending triangle pattern, formed by a downtrend resistance line and a horizontal support zone around $1.96 – $2.28.
This pattern is typically seen as a bearish continuation, but it can also trigger a strong reversal breakout if price breaks above resistance with significant volume. In short, the market is now at a make-or-break zone — either a breakdown to new lows or a bullish breakout that could spark a strong rally.
---
🔎 Pattern Details & Key Levels
Pattern: Descending Triangle (lower highs + flat support)
Major Support Zone: $1.96 – $2.28 (strong demand zone, price has bounced multiple times)
Dynamic Resistance: descending trendline pressing since early 2025
Static Resistance Levels: $2.737 – $3.094 – $3.537 – $4.832
Psychological Levels above: $6.0 – $8.0
Measured Move Targets (triangle height):
Upside breakout = ≈ $3.51
Downside breakdown = ≈ $1.19
---
✅ Bullish Scenario
Trigger: Daily close above the descending trendline + confirmed breakout above $2.737 with strong volume.
Additional confirmation: Successful retest of trendline / $2.737 as new support.
Targets:
Short-term: $3.09
Primary measured move: $3.51
Extended targets: $3.53 – $4.83 (if momentum continues)
Upside potential: From $2.28 → $3.51 = +53.6%
---
❌ Bearish Scenario
Trigger: Daily close below $1.964 with convincing volume.
Additional confirmation: Failed retest of $1.96 as resistance.
Targets:
Primary measured move: ≈ $1.19
Psychological area: $1.00 (potential liquidity zone)
Downside risk: From $2.28 → $1.19 = -47.8%
---
📌 Conclusion
FIL/USDT is at a major crossroad.
Holding the $1.96–$2.28 support + breakout above the trendline opens the door to $3.51 and potentially $4.83.
Losing this support would confirm a bearish breakdown towards $1.19.
Best approach: Wait for daily close + volume confirmation to avoid false breakouts/breakdowns.
⚠️ Disclaimer: This analysis is for educational purposes only, not financial advice. Always apply proper risk management.
---
> FIL/USDT is now testing a decision zone with a descending triangle pattern on the daily chart.
Bullish case: Breakout above $2.737 → targets $3.09 to $3.51
Bearish case: Breakdown below $1.964 → target $1.19
$1.96 – $2.28 remains the critical support — either the last defense before a deeper drop, or the launchpad for the next rally.
🚨 Watch for daily close & volume to confirm the move!
#FIL #FILUSDT #Filecoin #Crypto #TechnicalAnalysis #DescendingTriangle #SupportResistance #Breakout #BearishScenario #BullishScenario #CryptoTrading

Filecoin Opportunity Buy Zone, ATL & 2025 Bull MarketThis is another all-in chart. Filecoin is looking rich. I already know that by now you understand me, you understand what I mean.
The highest volume ever continues to show up. What is happening here?
Filecoin is trading at bottom prices but volume is just so high... Who is buying this much? Why now and why at such a low price?
The all-time high buying didn't happen just recently, whale buying was also present in November 2024. Accumulation at bottom prices for sure. Smart money. Smart people. How much money are they going to extract from this bullish run? You can do it too.
EMA8 is the shortest moving average we track and FILUSDT is moving weekly above this level, just now. The next one is EMA13 and I think this one will be flipped support as well before the week ends/closes. Everything looks great.
The bottom range here was activated 10-March 2025. We are looking at true bottom prices. This is a perfect chart setup to go LONG. This would activate a very strong long-term position. With 3X, 4X or even 5X or higher, it can be life changing but, patience is key. You know how it goes... We have to wait and wait and wait but once the breakout is in and we are green with a strong position, it was worth the wait.
There is no way to trade here as there is no volatility. The only action that can be taken here is a buy. Then you can buy more. Then buy again. Accumulate. Invest. Purchase. Hold. There are no other options available. This is what makes Cryptocurrency trading easy. Buy the bottom, the market takes care of the rest.
Are there any doubts?
Crypto is going up. So many pairs are already moving strong; those trading at the bottom are set to catch up. New all-time highs all across. The best is yet to come.
Thank you for reading... It will get better, I promise.
Namaste.

FILUSDTBINANCE:FILUSDT is deep corrections from latest bull-trend.
Bets support's in 1.90 to 2.150 $ and resistance's 2.50 and 2.80 $.
Please control risk management.
