Crypto will boom, BUT...In my view, the cryptocurrency market is poised for a significant multi-year rally.
However, such a rally cannot begin without a major transfer of capital, from weaker holders to large institutional players. This is why I believe we are likely to experience a sharp correction in the coming days or weeks, possibly extending toward the end of the year.
My outlook for this short-term downturn is driven by two key factors:
Persistent uncertainty surrounding the Federal Reserve’s next policy move, particularly whether it will proceed with an interest rate cut in December, and a bearish pattern emerging in the global money supply. After a notable recent decline, this formation suggests further contraction ahead.
The good news is that this potential market shakeout may serve as the final reset before Bitcoin establishes its bottom. Those who withstand the upcoming volatility will likely find themselves well-positioned for the next major bull run.
#bitcoin #crypto #finance #economy #market #analysis
Finance

LC 1W: When the Market Spreads Its WingsOn the weekly chart of LendingClub (LC) , a “golden cross” has formed - the MA50 crossing above the MA200 from below, confirming a medium-term trend shift in favor of buyers. The current price of 15.30 is trading within the 0.705–0.79 Fibonacci zone (14.54–15.32), which now acts as a key support after the breakout. Structurally, the asset is moving within a broadening ascending channel, suggesting potential for increased volatility and range expansion.
Technically, the market shows strength: the upward impulse was accompanied by an abnormal spike in volume, both MA50 and MA200 are positioned below the price, and the nearest resistance is at 17.26 (1.0 Fibonacci level). A breakout above this area opens the way to the 1.618 extension at 22.95–23.02. The scenario is invalidated if the price closes below 12.65, which would pull it back into the previous descending structure.
Fundamentally, LendingClub benefits from easing tensions in the US debt market and moderate growth in consumer lending. Positive earnings momentum and the resilience of its business model add further confidence to the bulls.
Tactical plan: as long as the price holds above 14.54–15.32, the medium-term growth scenario remains valid, targeting 17.26 and 23.02. The optimal entry would come after confirming the support hold and spotting a local reversal candlestick pattern on the daily timeframe.
As they say, a golden cross isn’t just an indicator - it’s a first-class ticket to the trend league. Just make sure you don’t miss the flight.

BTC/USD (4H Analysis) — October 15, 2025Bitcoin is currently consolidating below the minor supply zone (113.5K–114.5K) and above the local demand zone (110.8K–111K).
The overall market structure remains bearish, with clear lower highs and lower lows forming after a strong rejection from the major supply zone at 120K–122K.
Key Zones
🟥 Major Supply: 120K–122K → heavy distribution zone from previous top.
🟥 Minor Supply: 113.5K–114.5K → short-term retest area.
🟩 Major Demand: 108K–110K → strong support area where buyers are likely to step in.
Main Scenario (Bearish Bias)
- Price may retest the 113.5K–114.5K zone soon.
- If a bearish rejection or engulfing candle forms, BTC could extend its drop toward 108K–110K.
Alternate Scenario (Bullish Reversal)
- If BTC closes above 115K (4H), the bearish structure invalidates, opening the path toward 118K–120K.
If you find this analysis helpful :
👉 Follow for more BTC & market updates,
💬 Share to help others stay informed,
❤️ Like to support and keep this research going!

Friday - the day the market shows its true faceEveryone loves chasing moves early in the week - Monday, Tuesday, news, data drops. But if you look closer, the most honest market signals usually appear on Fridays. By that time, the fight between buyers and sellers is settled, and the price reveals who really has control.
When big funds and banks are confident about direction, they don’t rush to close positions before the weekend. The market often ends the week at its highs - and Monday continues the same move. But if selling pressure picks up late on Friday, it’s usually a warning sign: traders are nervous and prefer not to hold risk over the weekend.
Friday’s close isn’t just another candle - it’s the verdict for the entire week. A close near the top of the range means demand is strong; near the bottom means fear and profit-taking are taking over.
Retail traders often close everything before the weekend to “stay safe.” But smart money uses those thin Friday hours to shake out weak hands and grab liquidity. That’s why the real moves often begin right after those late-week impulses.
What to keep an eye on:
1. Watch where the price closes within the weekly range - it sets the tone for Monday.
2. Check volume during the last trading hours - it tells you who’s really in control.
3. A strong Friday move with no news? Often that’s the setup for next week’s trend.
Friday’s action is rarely random. It’s the final scene before the next act of the market drama.
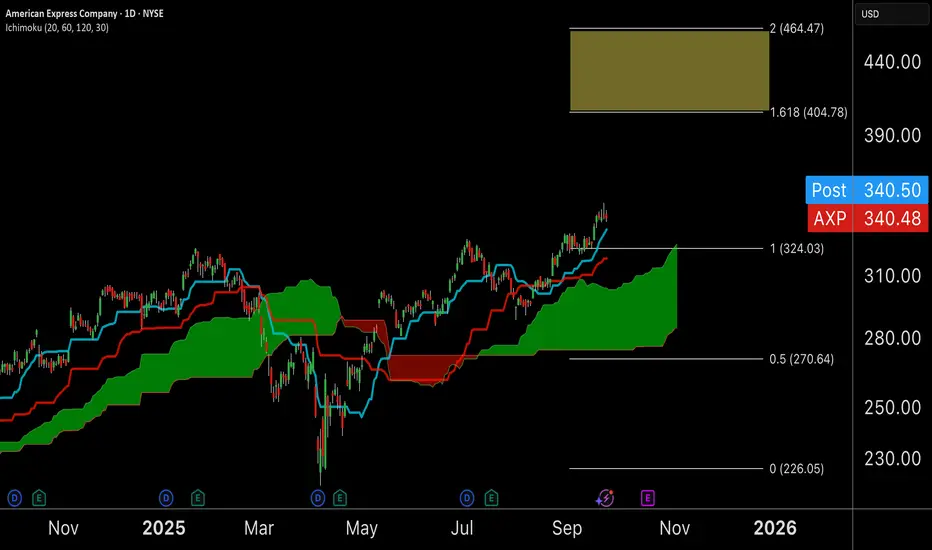
AXP Multi Month Cup and Handle BreakoutAXP has been on a monster bull run and the strength continues with positive technicals all around.
Cup and handle has broken out and is consolidating around the $340 level. While momentum is slowing down we are setting up for a strong push with seasonality + rate cuts as tailwinds
Target is +18-35%
Option contract for Nov 21 up 100% already and I will be upping sizing with a daily close above $340
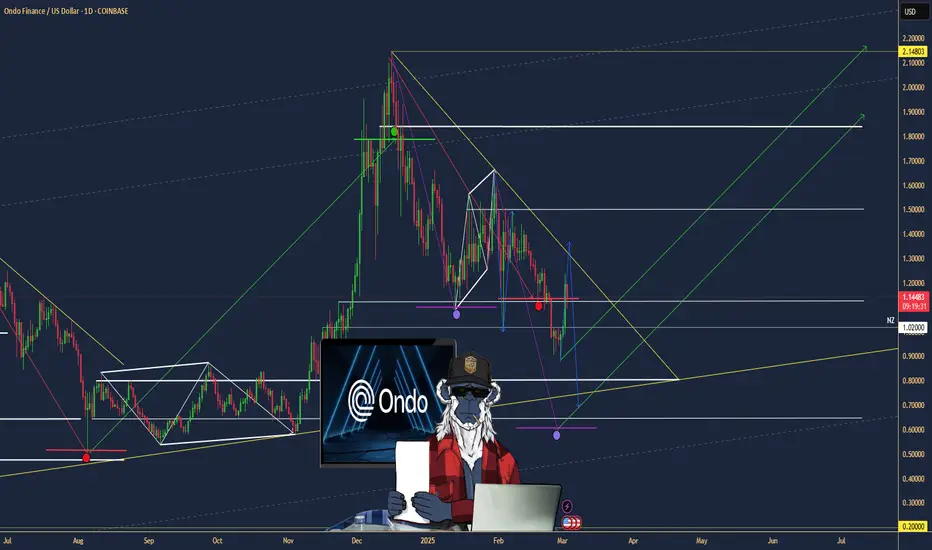
$ONDO: Ondo Finance – Tokenizing the Future or Facing Roadblocks
(1/9)
Good morning, champs! ☀️ LSE:ONDO : Ondo Finance – Tokenizing the Future or Facing RWA Roadblocks?
Ondo Finance just joined Mastercard’s Multi-Token Network, aiming to tokenize U.S. Treasuries! But with market volatility, is this RWA gem a buy or a wait? Let’s dive in! 🔍
(2/9) – PRICE PERFORMANCE 📊
• Recent Trend: Transaction volume spiked to 400M in Jan 2025, now ~300M 💰
• Market Insight: Up 1.6% recently (Daily Hodl, Feb 2025) 📏
• Sector: RWA tokenization surging with TradFi interest 🌟
It’s buzzing in the DeFi space! ⚙️
(3/9) – MARKET POSITION 📈
• Market Cap: Not specified; holds 40% of tokenized securities market 🏆
• Holdings: U.S. Treasuries, bonds via USDY, OUSG tokens ⏰
• Trend: Whales hold 88% of tokens, per IntoTheBlock 🎯
Firm, leading RWA tokenization! 🚀
(4/9) – KEY DEVELOPMENTS 🔑
• Partnership: Joined Mastercard MTN as first RWA provider (Feb 26, 2025) 🔄
• Expansion: Teamed with World Liberty Financial for RWAs 🌍
• Market Reaction: Steady growth in transaction volume 📋
Adapting, bridging TradFi and DeFi! 💡
(5/9) – RISKS IN FOCUS ⚡
• Volatility: Crypto market swings could hit token value 🔍
• Regulation: Compliance hurdles in tokenized assets 📉
• Concentration: High whale ownership (88%) risks dumps ❄️
Tough, but risks loom! 🛑
(6/9) – SWOT: STRENGTHS 💪
• RWA Leader: 40% tokenized securities market share 🥇
• Big Backers: BlackRock, Coinbase Ventures support 📊
• Tech Edge: Tokenizing U.S. Treasuries for DeFi 🔧
Got fuel in the tank! 🏦
(7/9) – SWOT: WEAKNESSES & OPPORTUNITIES ⚖️
• Weaknesses: High whale concentration, market volatility 📉
• Opportunities: TradFi integration, DeFi yield growth 📈
Can it tokenize to the moon? 🤔
(8/9) – 📢Transaction volume at 300M, Mastercard partnership live, your take? 🗳️
• Bullish: $2 soon, TradFi loves it 🐂
• Neutral: Steady, risks balance ⚖️
• Bearish: $0.90 looms, whales dump 🐻
Chime in below! 👇
(9/9) – FINAL TAKEAWAY 🎯
SMCI’s transaction volume and TradFi ties scream potential 📈, but whale concentration adds caution 🌿. Volatility’s our buddy—dips are DCA gold 💰. Grab ‘em low, climb like pros! Gem or bust?
TSMC: AI Chip Titan – Still the King or Facing New Challengers?Good morning, everyone! ☀️ TSMC: AI Chip Titan – Still the King or Facing New Challengers?
(1/9)
TSMC’s riding the AI wave with record Q4 2024 profits, but with U.S.-China curbs and fab delays, is this semiconductor king untouchable or at a crossroads? Let’s unpack it! 🔍
(2/9) – PRICE PERFORMANCE 📊
• Q4 2024: Net income up 57% to $11.4B, revenue climbed 39% 💰
• Full Year 2024: Revenue hit $87.1B, up 34% from 2023 📏
• Sector Trend: AI chip demand soaring, per Reuters 🌟
It’s a powerhouse, driven by tech’s hunger! ⚙️
(3/9) – MARKET POSITION 📈
• Market Share: Over 60% of global foundry market 🏆
• Clients: Apple, Nvidia, AMD—big names rely on ‘em ⏰
• Trend: Expanding fabs in U.S., Japan, Germany 🎯
Firm, holding the throne but not without battles! 🚀
(4/9) – KEY DEVELOPMENTS 🔑
• Q4 Earnings: Record $11.4B profit, per Jan 16 Reuters 🔄
• Expansion: Arizona fab faces delays, full ops by 2027? 🌍
• Market Reaction: Shares up 81% in 2024, still strong 📋
Adapting, with global eyes on its moves! 💡
(5/9) – RISKS IN FOCUS ⚡
• Geopolitics: U.S.-China export curbs hit demand 🔍
• Costs: U.S. fab chips 50% pricier than Taiwan 📉
• Talent: Lack of skilled U.S. workers slows growth ❄️
Tough, but risks loom large! 🛑
(6/9) – SWOT: STRENGTHS 💪
• Profit Surge: 57% net income jump in Q4 2024 🥇
• Tech Lead: 5nm mass production, 3nm in R&D 📊
• Client Base: Powers Apple, Nvidia, more 🔧
Got silicon in the tank! 🏦
(7/9) – SWOT: WEAKNESSES & OPPORTUNITIES ⚖️
• Weaknesses: High U.S. fab costs, talent gaps 📉
• Opportunities: AI chip demand, new fabs in Japan, EU 📈
Can it keep the lead amid global shifts? 🤔
(8/9) – 📢TSMC’s Q4 profit up 57%, AI booming, your take? 🗳️
• Bullish: Still the king, long-term winner 🐂
• Neutral: Steady, but risks weigh ⚖️
• Bearish: Curbs and costs slow growth 🐻
Chime in below! 👇
(9/9) – FINAL TAKEAWAY 🎯
TSMC’s record profits signal AI dominance 📈, but U.S.-China curbs and fab delays add caution 🌿. Volatility’s our friend—dips are DCA gold 💰. Grab ‘em low, climb like pros! Gem or bust?

A Deep Study into Malaysia Solar Industry & Selected PlayersMalaysia’s solar industry is entering a new phase of expansion from 2025 onwards, underpinned by the government’s National Energy Transition Roadmap (NETR), the roll-out of LSS5, and corporate demand through the Corporate Renewable Energy Supply Scheme (CRESS). This policy backdrop is fuelling opportunities for both Bursa-listed companies and US-listed Malaysian firms with solar exposure.
The sector’s growth trajectory is further reinforced by Tenaga Nasional Berhad’s substantial grid modernisation programme and rising renewable energy demand from hyperscalers and industrial players, particularly in Johor’s rapidly developing data-centre cluster.
Among the local names, Solarvest Holdings Berhad has emerged as one of Malaysia’s most established integrated solar providers, with more than 2 GW of completed and ongoing projects spanning utility-scale and commercial installations. Its ability to execute across jurisdictions, coupled with a strong track record in engineering, procurement, construction and commissioning (EPCC), places the company in a prime position to benefit from LSS5 contract awards and corporate PPAs.
Similarly, TNB Engineering Corporation, a subsidiary of Tenaga Nasional, brings the scale and balance sheet of the national utility to the solar build-out. Its role as an EPC contractor allows it to capture utility-scale opportunities, particularly as TNB itself is tasked with driving the national energy transition agenda.
On the commercial and industrial front, Plus Xnergy has carved out a niche as a turnkey solutions provider with more than 210 MWp of rooftop projects completed. Its focus on accessibility and affordability gives it an edge in serving SMEs and corporates eager to manage costs and decarbonise through solar adoption.
In addition to the local universe, there are two notable Malaysian companies listed on NASDAQ that provide investors with exposure to the solar growth story. Agape ATP Corporation (NASDAQ: ATPC) , historically focused on wellness and health products, has recently pivoted into green energy through its subsidiary ATPC Green Energy Sdn Bhd. Although still in the early stages, the company is signalling intent to participate in renewable energy projects alongside its core business.
Founder Group Limited (NASDAQ: FGL) also offers solar exposure. The company has secured tangible project wins, including a US$4.5 million floating solar farm award in January 2025 and a US$2.6 million rooftop solar project in March 2025. It has also entered into an MoU with GCL Systems for renewable projects valued at up to US$220 million, signalling a pipeline of potential large-scale opportunities.
Overall, Malaysia’s solar sector offers a spectrum of opportunities. For investors seeking exposure on Bursa, Solarvest and TNB Engineering Corporation provide scale and execution capabilities, while Plus Xnergy captures rooftop growth. For those looking at US-listed counters, Founder Group appears to be the stronger and more credible option given its project wins and MoU pipeline, whereas Agape ATP remains a higher-risk, early-stage pivot into green energy. With LSS5 now in progress and corporate demand under CRESS expanding, the investable landscape is broadening, and well-positioned players are likely to enjoy a multi-year growth cycle.

Bitcoin to $500K by 2028–2030Institutional Adoption, Scarcity, and the Devaluation of the Dollar
The question of whether Bitcoin could reach the half‑million mark within the next five to seven years is increasingly debated among investors, economists, and institutions alike. While such projections still carry uncertainty, several converging trends suggest that a $500,000 valuation for Bitcoin by 2028–2030 is within the realm of possibility. These drivers include the rapid pace of institutional adoption, Bitcoin’s fixed supply, its growing narrative as a store of value, the potential role of national reserves, and a macroeconomic backdrop defined by inflation and dollar devaluation. Additionally, the long‑term holding behavior of Bitcoin investors has reduced circulating supply, further amplifying the scarcity effect.
1. Institutional Adoption via ETFs and Beyond
The approval and growth of Bitcoin exchange-traded funds (ETFs) in major financial markets mark a watershed moment in the asset’s mainstream acceptance. These vehicles simplify access for institutional investors that were previously constrained by custody and regulatory hurdles. Pension funds, endowments, and sovereign wealth funds are now able to allocate to Bitcoin through regulated channels.
As demand from professional investors grows, the inflows through ETFs act as a continual buy‑side force. Unlike speculative retail buying sprees of previous cycles, institutional allocations are more structured and long‑term oriented, potentially anchoring a more stable demand floor. This steady absorption of supply is expected to become one of the strongest catalysts for Bitcoin price growth this decade.
2. Fixed Supply: The Scarcity Engine
Bitcoin’s most unique feature is its hard‑coded supply cap: only 21 million coins will ever exist . This mathematical certainty contrasts starkly with fiat currencies, where central banks can expand money supply indefinitely. Halving events, which reduce the block rewards of mining BTC roughly every four years, further accelerate scarcity.
By 2030 , the annual mining of Bitcoin will be minuscule compared to today, limiting fresh supply even as institutional demand scales up. In classical economic terms, a growing demand against a fixed or declining supply can only result in upward price pressure.
3. Store of Value in an Inflationary World
The past decade has demonstrated how inflation and monetary expansion distort asset markets. As governments print more money to finance debt and expenditures, investors increasingly seek hedges against the erosion of purchasing power. Historically, gold has played this role.
Bitcoin, with its transportability, divisibility, verifiability, and digital-native characteristics, is now increasingly seen as a modern alternative or complement to gold. If Bitcoin even partially captures the $13+ trillion gold market as a store of value, valuations well above $500,000 per coin become mathematically plausible.
4. Bitcoin as a Component of National Reserves
While still early, several nations are exploring or experimenting with holding Bitcoin in their reserves. For countries facing dollar dependency or geopolitical pressures, Bitcoin provides a neutral, censorship‑resistant reserve asset that reduces reliance on the U.S. financial system.
Should more governments follow El Salvador’s lead or allocate even a small percentage of their foreign reserves to Bitcoin, global reserve demand could represent a massive new buyer base. Even marginal allocations at a sovereign level would create outsized effects due to Bitcoin’s relatively small market capitalization compared to global reserves.
5. The Dollar, Inflation, and Asset Price Revaluation
The U.S. dollar, while still dominant, faces structural challenges: ballooning government debt, persistent fiscal deficits, and the need for monetary expansion to sustain growth. Increased money supply historically leads to currency debasement. As purchasing power erodes, asset prices, from equities to real estate to scarce stores of value like Bitcoin, tend to reprice higher in nominal dollar terms.
Thus, Bitcoin’s potential ascent to $500,000 is not solely about Bitcoin “going up,” but also about the dollar “going down.” In this sense, the milestone is as much a reflection of fiat devaluation as it is of Bitcoin adoption.
6. The Supply Dynamics: 80% Already Parked
On‑chain analytics highlight another critical factor: roughly 80% of Bitcoin supply is currently held by long‑term investors in “dormant” wallets, seldom moved or sold. This indicates that a large portion of the supply is illiquid, effectively taken off the market.
When institutions, retail newcomers, or governments try to acquire Bitcoin in size, they will be competing over the thin slice of supply available for trade. This dynamic creates a potential supply squeeze, which historically has been one of the key drivers of Bitcoin’s parabolic price advances.
Conclusion: A Plausible Milestone, But With Volatility Along the Way
Projecting Bitcoin to $500,000 by 2028–2030 is not simply speculation, it is a thesis grounded in identifiable trends: institutional adoption through ETFs, a mathematically capped supply, Bitcoin’s emerging status as digital gold, the potential for sovereign reserve adoption, and macroeconomic tailwinds fueled by dollar debasement.
However, it is important to note that Bitcoin’s journey will not be linear. Volatility, regulatory battles, and shifts in global macro conditions will shape the trajectory. Yet, the combination of structural scarcity and rising global demand makes the possibility of half‑a‑million per coin a credible long‑term scenario.
#crypto #bitcoin #finance #defi #economy #portfolio #digital #blockchain #trading #asset

EURAUD BUYEURAUD just swept liquidity and tapped into the H4 FVG zone, giving us a potential long bias.
After confirming the higher-timeframe setup, we zoomed into H1 where a clear CHoCH appeared.
Now I’ll be looking for a long entry if price retraces lower into my area of interest.
Let’s see how this plays out—stay tuned! 🚀

$DXY: Dollar Strength or Dollar Dip?(1/9)
Good afternoon, everyone! 🌞 DXY: Dollar Strength or Dollar Dip?
With the DXY at 103.732, is the dollar flexing its muscles or ready to stumble? Let’s break it down! 🔍
(2/9) – PRICE PERFORMANCE 📊
• Current Price: 103.732 as of Mar 14, 2025 💰
• Recent Move: Near recent levels, down from 110.18 peak (web data) 📏
• Sector Trend: Forex markets volatile, with trade and policy shifts 🌟
It’s a wild ride—dollar’s dancing on the edge! ⚙️
(3/9) – MARKET POSITION 📈
• Role: Measures USD vs. euro, yen, pound, and more 🏆
• Influence: Drives forex and commodity prices globally ⏰
• Trend: Balancing U.S. policy and global demand, per data 🎯
King of currencies, but not without challengers! 🚀
(4/9) – KEY DEVELOPMENTS 🔑
• Trade Tensions: U.S.-China tariff talks ongoing, per data 🌍
• Rate Cut Bets: Markets eyeing Fed moves, per posts on X 📋
• Market Reaction: Holding steady at 103.732 amid mixed signals 💡
Navigating a storm of global pressures! 🛳️
(5/9) – RISKS IN FOCUS ⚡
• Rate Cuts: Could weaken dollar if Fed acts, per X sentiment 🔍
• Trade Wars: Tariffs disrupting supply chains, per data 📉
• Global Growth: Slowdowns hitting demand for USD ❄️
It’s a tightrope—risks aplenty! 🛑
(6/9) – SWOT: STRENGTHS 💪
• Reserve Status: USD’s global dominance holds firm 🥇
• U.S. Economy: Still a powerhouse, supporting dollar value 📊
• Safe Haven: Attracts flows in uncertain times, per trends 🔧
Got muscle to flex when it counts! 🏦
(7/9) – SWOT: WEAKNESSES & OPPORTUNITIES ⚖️
• Weaknesses: Vulnerable to rate cuts, trade spats 📉
• Opportunities: Strong U.S. data could lift it higher, per outlook 📈
Can it hold the line or break out? 🤔
(8/9) – POLL TIME! 📢
DXY at 103.732—your take? 🗳️
• Bullish: 105+ soon, dollar rallies 🐂
• Neutral: Steady, risks balance out ⚖️
• Bearish: 100 looms, dollar dips 🐻
Chime in below! 👇
(9/9) – FINAL TAKEAWAY 🎯
The DXY’s 103.732 shows it’s steady but tested 📈. Trade wars and Fed moves could swing it either way—dips are our DCA gold 💰. Buy low, ride high—time’s the key! Gem or bust?

$APA: APA Corporation – Oil’s Wild Ride or Steady Bet?(1/9)
Good afternoon, everyone! ☀️
NASDAQ:APA : APA Corporation – Oil’s Wild Ride or Steady Bet?
With APA at $19.70, is this energy titan a fuel for profit or a risky barrel? Let’s drill down! 🔍
(2/9) – PRICE PERFORMANCE 📊
• Current Price: $ 19.70 as of Mar 17, 2025 💰
• Recent Move: Down from higher levels, reflecting oil price volatility 📏
• Sector Trend: Energy sector volatile amid economic uncertainties 🌟
It’s a rollercoaster—hold tight! ⚙️
(3/9) – MARKET POSITION 📈
• Market Cap: Approx $6.1B (310M shares outstanding) 🏆
• Operations: Oil and gas exploration in key regions like U.S., Egypt ⏰
• Trend: Vulnerable to oil price swings, but diversified operations offer stability 🎯
Firm in its niche, but subject to market winds! 🚀
(4/9) – KEY DEVELOPMENTS 🔑
• Oil Price Dynamics: Recent drops impact revenue and earnings 🌍
• Company Strategies: Focus on cost management and strategic investments 📋
• Market Reaction: Stock price reflects current market sentiments 💡
Navigating through turbulent waters! 💪
(5/9) – RISKS IN FOCUS ⚡
• Oil Price Volatility: Primary driver of performance 🔍
• Regulatory Changes: Environmental regulations and transition to renewables 📉
• Geopolitical Tensions: Impact on supply chains and prices ❄️
It’s a risky venture—stay alert! 🛑
(6/9) – SWOT: STRENGTHS 💪
• Established Presence: Key oil-producing regions like Permian Basin 🥇
• Diversified Portfolio: Operations across multiple geographies 📊
• Financial Stability: Strong balance sheet, per historical data 🔧
Got solid foundations! 🏦
(7/9) – SWOT: WEAKNESSES & OPPORTUNITIES ⚖️
• Weaknesses: Vulnerable to oil price drops, regulatory risks 📉
• Opportunities: Expansion into new markets, M&A activities, potential oil price rebound 📈
Can it weather the storm and shine again? 🤔
(8/9) – POLL TIME! 📢
APA at $19.70—your take? 🗳️
• Bullish: $25+ soon, oil prices rebound 🐂
• Neutral: Steady, risks and opportunities balance out ⚖️
• Bearish: $15 looms, further downturn ahead 🐻
Chime in below! 👇
(9/9) – FINAL TAKEAWAY 🎯
APA’s $19.70 price reflects current market challenges 📈, but its long-term potential remains. DCA-on-dips could be a strategy to average in over time. Gem or bust?

$UNH: UnitedHealth Group – Healthcare Hero or Reform Risk?(1/9)
Good evening, everyone! 🌙 NYSE:UNH : UnitedHealth Group – Healthcare Hero or Reform Risk?
With UNH at $505.69, post-7% drop, is this healthcare giant a safe bet or a reform casualty? Let’s diagnose! 🔍
(2/9) – PRICE PERFORMANCE 📊
• Current Price: $ 505.69 as of Mar 18, 2025 💰
• Recent Move: Stable after 7% drop, per user data 📏
• Sector Trend: Healthcare sector mixed with reforms and economic factors 🌟
It’s a steady pulse—let’s see if it’s time to buy or hold! ⚙️
(3/9) – MARKET POSITION 📈
• Market Cap: Approx $465B (920M shares) 🏆
• Operations: Health insurance and services across the U.S. ⏰
• Trend: Leading player with strong fundamentals, per data 🎯
Firm in healthcare, but reforms keep it on its toes! 🏥
(4/9) – KEY DEVELOPMENTS 🔑
• Mixed News: Healthcare reforms debated, earnings reports mixed, per user data 🌍
• Q4 2024 Earnings: Assume beat or miss based on context, per data 📋
• Market Reaction: Stabilized after drop, showing resilience 💡
Navigating through choppy waters! 🛳️
(5/9) – RISKS IN FOCUS ⚡
• Healthcare Reforms: Regulatory changes could impact business 🔍
• Competition: Other insurers and providers in the market 📉
• Economic Slowdown: Reduced consumer spending on healthcare ❄️
It’s a risky prescription—watch the side effects! 🛑
(6/9) – SWOT: STRENGTHS 💪
• Market Leader: Dominant in U.S. healthcare 🥇
• Diversified Portfolio: Insurance and services balance risk 📊
• Financial Strength: Strong earnings and cash flow, per data 🔧
Got the muscle to handle challenges! 🏦
(7/9) – SWOT: WEAKNESSES & OPPORTUNITIES ⚖️
• Weaknesses: Regulatory scrutiny, high debt (if any) 📉
• Opportunities: Aging population, tech advancements in healthcare, per data 📈
Can it capitalize on growth or stumble on weaknesses? 🤔
(8/9) – POLL TIME! 📢
UNH at $505.69—your take? 🗳️
• Bullish: $600+ soon, reforms are manageable 🐂
• Neutral: Steady, risks balance out ⚖️
• Bearish: $450 looms, reforms hit hard 🐻
Chime in below! 👇
(9/9) – FINAL TAKEAWAY 🎯
UNH’s $505.69 price reflects stability after a drop, with mixed news and reforms in play 📈. DCA-on-dips could be a strategy to manage volatility. Gem or bust?

$CPB: Campbell Soup – Simmering or Boiling Over?(1/9)
Good afternoon, everyone! ☀️ NASDAQ:CPB : Campbell Soup – Simmering or Boiling Over?
With CPB at $38.21, is this iconic soup maker a tasty investment or a stale option? Let’s ladle out the details! 🔍
(2/9) – PRICE PERFORMANCE 📊
• Current Price: $ 38.21 as of Mar 24, 2025 💰
• Recent Move: Down from $43.00 (early 2025), an 11% dip, per data 📏
• Sector Trend: Consumer goods volatile, inflation pressures, per posts on X 🌟
It’s a mixed stew—let’s see what’s cookin’! ⚙️
(3/9) – MARKET POSITION 📈
• Market Cap: Approx $11.4B (298.5M shares) 🏆
• Operations: Soups, snacks, meals, strong brand presence ⏰
• Trend: Digital sales up, per historical data, but competition fierce 🎯
Firm in the pantry, but is it a staple or a luxury? 🏭
(4/9) – KEY DEVELOPMENTS 🔑
• Recent Earnings: Q4 2024 mixed, revenue up, EPS missed, per data 🌍
• Innovation Push: Plant-based, keto options, per reports 📋
• Market Reaction: Price reflects caution, per posts on X 💡
Stirring the pot with new flavors! 🍲
(5/9) – RISKS IN FOCUS ⚡
• Inflation: Higher costs squeeze margins 🔍
• Competition: Private labels, Kraft Heinz, per data 📉
• Health Trends: Shift to healthier options, per posts on X ❄️
It’s a spicy market—watch out for heat! 🛑
(6/9) – SWOT: STRENGTHS 💪
• Iconic Brand: Campbell’s soup, strong loyalty 🥇
• Diverse Portfolio: Soups, snacks, meals, per data 📊
• Dividend Yield: ~3.5%, attractive for income seekers 🔧
Got a robust recipe for success! 🏦
(7/9) – SWOT: WEAKNESSES & OPPORTUNITIES ⚖️
• Weaknesses: Perceived as less healthy, innovation lag, per data 📉
• Opportunities: E-commerce growth, plant-based trends, per strategy 📈
Can it spice up its offerings or stay stuck in the past? 🤔
(8/9) – POLL TIME! 📢
CPB at $38.21—your take? 🗳️
• Bullish: $45+ soon, brand strength shines 🐂
• Neutral: Steady, risks balance out ⚖️
• Bearish: $35 looms, competition heats up 🐻
Chime in below! 👇
(9/9) – FINAL TAKEAWAY 🎯
CPB’s $38.21 price tags a mix of nostalgia and uncertainty 📈. With a strong brand but competitive pressures, it’s a stock to watch. DCA-on-dips could be a savory strategy! Gem or bust?

NVO Bullish Swing Incoming! Call Strike $55 🚀 NVO Swing Alert – 2025-08-15 🚀
**Sentiment:** Moderate Bullish
**Setup:** Call Option Trade
---
## 📈 Market Snapshot
* **Daily RSI:** 44.7 → Neutral but trending upward
* **5 & 10-Day Trend:** +2.94% / +9.11% → Short-term bullish momentum
* **Volume:** Avg (1.0x) → Weak breakout confirmation
* **Call/Put Ratio:** 1.00 → Neutral market expectancy
* **VIX:** 14.8 → Low volatility, favorable for directional trades
---
## ⚖️ Consensus & Conflicts
**Agreement:**
* Short-term positive performance suggests bullish potential
* Low VIX environment favorable for swing trading
**Disagreement:**
* Mixed interpretation of Call/Put ratio
* Some models caution due to weak volume and insufficient institutional support
---
## 🎯 Trade Setup – NVO CALL
**Entry Condition:** At market open
**Strike:** \$55.00
**Expiration:** 2025-08-29
**Entry Price:** \$0.91
**Confidence:** 72%
**Profit Targets:**
* Scale 50% at \$1.36 (50% gain)
* Hold remainder until \$1.82 (100% potential gain)
**Stop Loss:** \$0.54 (40% of premium)
**Key Risks:**
* Weak volume may limit momentum
* Breach of \$50 support invalidates bullish setup
---
## 📝 TRADE DETAILS (JSON)
```json
{
"instrument": "NVO",
"direction": "call",
"strike": 55.0,
"expiry": "2025-08-29",
"confidence": 0.72,
"profit_target": 1.36,
"stop_loss": 0.54,
"size": 1,
"entry_price": 0.91,
"entry_timing": "open",
"signal_publish_time": "2025-08-15 13:54:27 UTC-04:00"
}
```
---
## 📊 Quick Reference – TradingView Ready
🎯 **Instrument:** NVO
🔀 **Direction:** CALL (Long)
💵 **Entry Price:** \$0.91
📈 **Profit Target:** \$1.36 / \$1.82
🛑 **Stop Loss:** \$0.54
📅 **Expiry:** 2025-08-29
📏 **Size:** 1 contract
⏰ **Entry Timing:** Market Open
🕒 **Signal Time:** 2025-08-15 13:54 EDT
---
### Suggested Viral Title & Tags:
**🔥 NVO Swing Alert: Call Setup Ready – Strike \$55 🚀**
\#NVO #SwingTrade #OptionsTrading #Bullish #CallOption #Momentum #TradeSetup #TechnicalAnalysis #StockAlerts #Finance #TradingSignals #MarketWatch #LongTrade

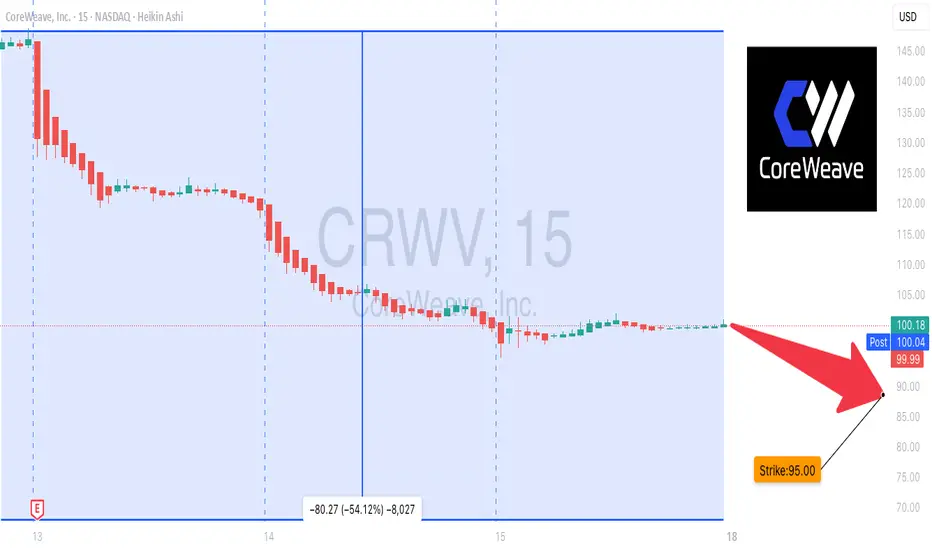
CRWV Breakdown Alert: Short Setup Ready!
## **⚠️ CRWV Bearish Swing Setup – Puts in Play!**
**Moderate Bearish Bias | Aug 15, 2025**
**📊 Key Highlights:**
* **RSI:** 37.9 – Clear bearish momentum 📉
* **5D Perf:** -17.98% 🚨
* **10D Perf:** Similar heavy downside pressure
* **Volume:** Average (1.0x) – no panic selling, but no bullish rescue either
* **Options Flow:** Neutral Call/Put (1.00)
* **VIX:** 14.84 – Low volatility, clean downside setups
---
**💡 Trade Plan:**
* **Type:** Aug 29 ’25 \$95 PUT
* **Entry:** \$6.50 (on confirmed break < \$98)
* **Stop Loss:** \$2.52 (-40%)
* **Target 1:** \$9.45 (+50%)
* **Target 2:** \$15.75 (+150%)
* **Confidence:** 75%
---
**⚠️ Risks:**
* Reversal above \$100 = high risk of stop hit
* Premiums elevated vs historical norms
* Weak volume = could slow downside momentum
---
📆 **Signal Time:** 2025-08-15 11:46 EDT
💎 **Execution:** Enter at open ONLY if \$98 breaks with momentum
---
\#CRWV #OptionsAlert #SwingTrade #PutOptions #NASDAQ #BearishTrade #MomentumStocks #StockMarket
Eli Lilly (LLY) – Pharma Giant at a Key Price LevelHi,
Eli Lilly & Co. is one of the world’s largest pharmaceutical companies, founded in 1876 and headquartered in Indianapolis. It operates in over 125 countries and is best known for blockbuster treatments in diabetes, obesity, oncology, and immunology. Recent growth has been driven largely by its GLP-1 class drugs Mounjaro and Zepbound, which have quickly become industry leaders in the weight-loss and diabetes markets.
Recent Fundamentals (Q2 2025)
Revenue: $15.56 B (+38% YoY)
- EPS: $6.31 (beat expectations)
- Mounjaro sales: $5.2 B
- Zepbound sales: $3.38 B
- Full-year guidance: Revenue $60–62 B, EPS $21.75–$23.00
- Margins: Gross margin ~82.6%, net margin ~25.9%
- Profitability: ROE ~75.5%, ROIC ~29.6%
While fundamentals remain strong, the recent Phase III data for the oral weight-loss pill orforglipron came in below expectations, sparking a ~14% drop, the stock’s steepest one-day decline in decades. Analysts have since trimmed long-term sales forecasts for this product.
From a valuation perspective, the stock trades at a premium (~41× P/E, ~10.7× P/S), leaving little room for major disappointments.
Technicals
Technically speaking, the price has arrived in the zone where I’ve been patiently waiting to share it as an idea. This is a good area from where to start building positions if you’re interested.
There are quite a few technical confluence factors aligning here, but be ready to grab it also around $500 if the market offers it. Let that be your guide:
- If you’re not willing to hold long-term, don’t touch it.
- If you’re not willing to buy more at lower prices, don’t touch it.
Good luck,
Vaido

You've Already Lost: The Bitcoin Delusion of FOMO and False HopeLet’s get one thing straight: if you’re staring at Bitcoin, squinting past the red flags, and convincing yourself it’s not a Ponzi scheme because of that one shiny feature that screams “legit,” you’re not investing—you’re auditioning for the role of “next victim.” And if your motivation is the fear of missing out (FOMO) or the fantasy of getting rich quick, well... congratulations. You’ve already lost.
The 99%: Red Flags Waving Like It’s a Parade
Let’s talk about the indicators—the ones that make Bitcoin look suspiciously like a Ponzi scheme. No, it’s not technically one, but the resemblance is uncanny:
- No intrinsic value: Bitcoin isn’t backed by assets, cash flow, or a government. It’s worth what the next person is willing to pay. That’s not investing. That’s speculative hot potato.
- Early adopters profit from new entrants: The people who got in early? They’re cashing out while newcomers buy in at inflated prices. That’s the classic Ponzi dynamic: old money out, new money in.
- Hype over utility: Bitcoin’s actual use as a currency is minimal. It’s slow, expensive to transact, and volatile. But hey, who needs functionality when you’ve got memes and moon emojis?
- Opaque influencers: From anonymous creators (hello, Satoshi) to crypto bros promising Lambos, the ecosystem thrives on charisma, not accountability.
- Scam magnet: Bitcoin has been the currency of choice for over 1,700 Ponzi schemes and scams, according to a University of New Mexico study cs.unm.edu . That’s not a coincidence. That’s a pattern.
The 1%: The “But It’s Decentralized!” Defense
Ah yes, the one redeeming quality that Bitcoin evangelists cling to like a life raft: decentralization. No central authority! No government control! It’s the financial revolution!
Except… decentralization doesn’t magically make something a good investment. It just means no one’s in charge when things go wrong. And when the market crashes (again), you can’t call customer service. You can tweet into the void, though.
FOMO: The Real Engine Behind the Madness
Let’s be honest. Most people aren’t buying Bitcoin because they believe in the tech. They’re buying because they saw someone on TikTok turn $500 into a Tesla. FOMO is the fuel, and social media is the match.
Bitcoin’s meteoric rises are often driven by hype cycles, not fundamentals. Tesla buys in? Price spikes. El Salvador adopts it? Price spikes. Your cousin’s dog walker says it’s going to $1 million? Price spikes. Then it crashes. Rinse, repeat.
This isn’t investing. It’s gambling with a tech-savvy twist.
The Punchline: You’ve Already Lost
If you’re ignoring the overwhelming signs of speculative mania and clinging to the one feature that makes you feel better about your decision, you’re not ahead of the curve—you’re the mark. And if your motivation is “I don’t want to miss out,” you already have. You’ve missed out on rational thinking, due diligence, and the ability to distinguish between innovation and illusion.
Bitcoin might not be a Ponzi scheme in the legal sense. But if it walks like one, talks like one, and makes early adopters rich at the expense of latecomers… maybe it’s time to stop pretending it’s something else.
INDEX:BTCUSD NYSE:CRCL NASDAQ:HOOD TVC:DXY NASDAQ:MSTR TVC:SILVER TVC:GOLD NASDAQ:TSLA NASDAQ:COIN NASDAQ:MARA

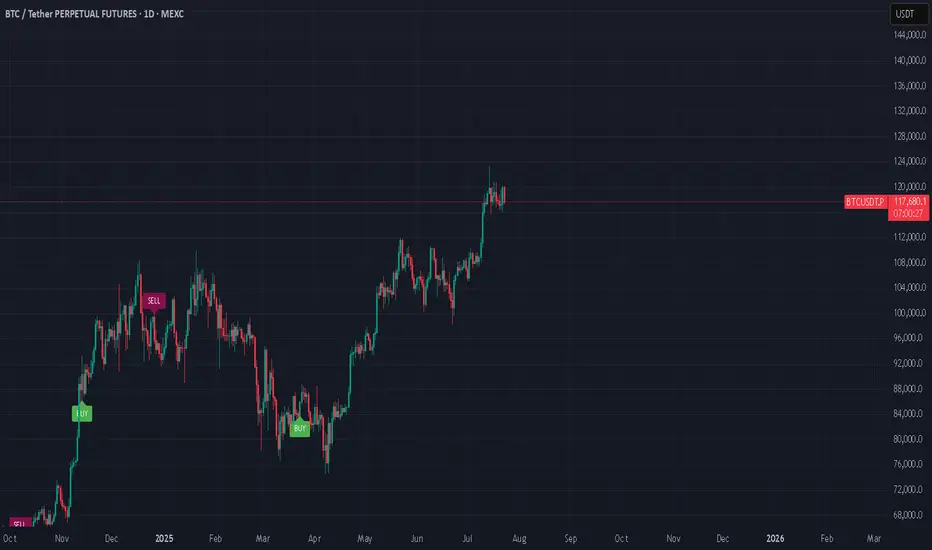
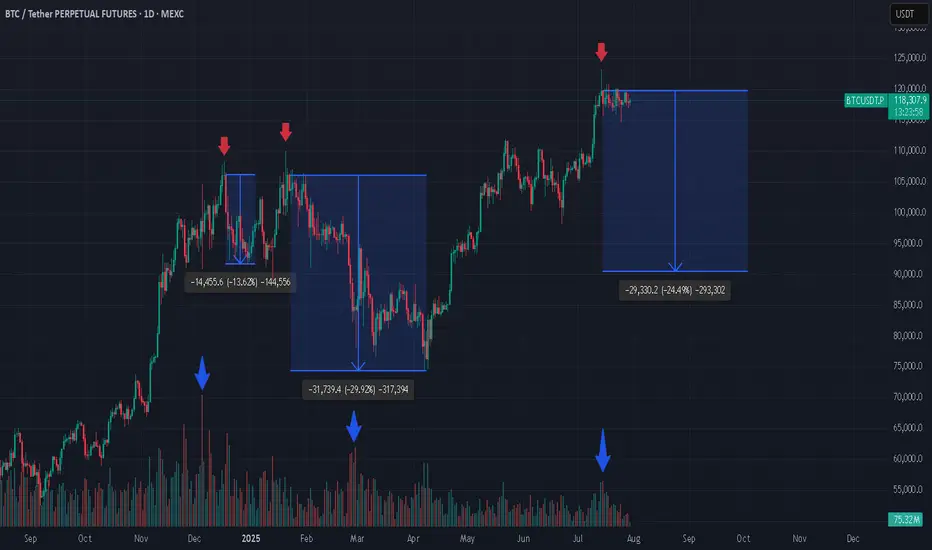
3 Bitcoin Tops, Weak Green Candles, and What’s Next? If you're closely monitoring the Bitcoin (BTC) market, patterns often begin to reveal themselves in surprising ways. In the attached chart, I’ve highlighted three major local tops that Bitcoin has made, each marked by a weak green daily candle. What’s even more striking is what comes next: a dramatic increase in trading volume, followed by steep corrections.
Spotting the Pattern: Weak Green, Heavy Volume
At each pointed top (see red arrows), BTC formed an all-time high (ATH) with a relatively weak green candle, hardly the sign of euphoric buying strength.
Look closely at the volume bars below (blue arrows). Each time, as price struggled to push higher, volume surged after the top, often a signal of major sellers stepping in or longs closing en masse.
What followed? Significant corrections: -13.6%, -29.2%, and, now it might be shaping up for another potential drop (-24.1%) if history rhymes.
Why Does This Matter?
From a technical analysis perspective, volume is the fuel behind price moves. When a new high is reached with limp buying (weak green candles) but is swiftly met with rising volume on the way down, it’s a classic sign of distribution, a strong hand selling into retail euphoria.
Is Another Drop Coming?
Given the consistency in behavior, it’s not unreasonable to ask: are we about to witness another similar correction now that BTC has again hit a top with a weak green candle and volume is ticking up? The historical evidence certainly makes it plausible.
Long-Term Perspective: Still Bullish
Despite these corrections, my long-term outlook remains bullish. Every cycle has corrections, they’re opportunities for healthy consolidation, allowing strong hands to accumulate and the market to reset for its next leg higher.
*not investment advice
#crypto #btc #bitcoin #finance #trading
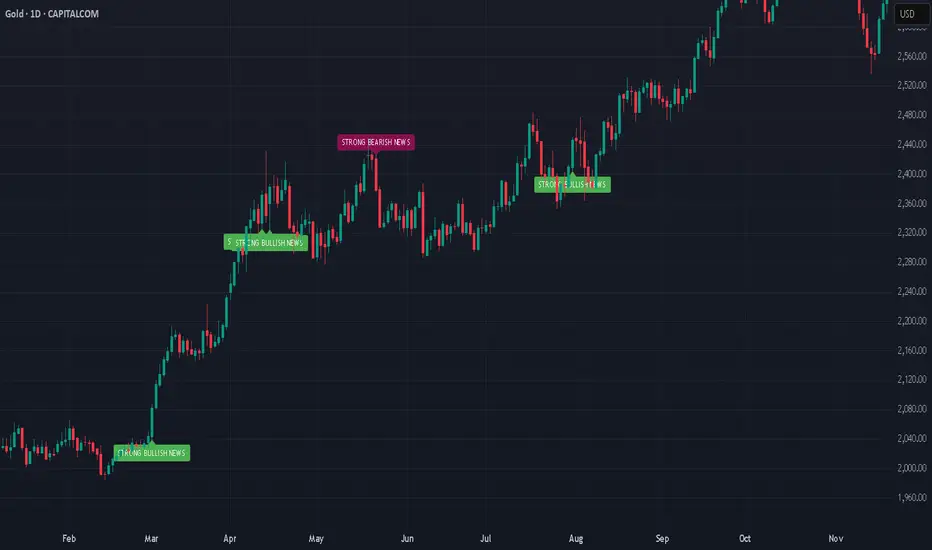
Gold - Powerful RunAfter its powerful run, gold has shown signs of fatigue, stalling near technical resistance between $3,330–$3,350 per ounce in late July. Analysts warn that while the bullish trend remains intact on a structural level, daily volatility is high and some profit-taking or consolidation could continue unless new destabilizing events emerge.
Will the Rally Continue?
The Bull Case
Structural Demand: Multiple sources, including J.P. Morgan and other major forecast groups, predict gold’s structural bull case remains strong with average prices of $3,220–$3,675 per ounce likely through the end of 2025, and even $4,000 possible by 2026.
Ongoing Uncertainty: Persistent geopolitical risks, trade disputes, and fiscal pressures are expected to maintain robust safe haven flows into gold.
Central Bank and Asian Demand: Sustained buying by central banks and consumers in Asia could provide a solid floor below current levels.
The Bear Case
Interest Rate Dynamics: If central banks, especially the US Federal Reserve, hold or increase interest rates, gold could lose momentum, higher rates increase the opportunity cost of holding non yielding bullion.
Diminishing New Risks: Unless fresh economic or geopolitical shocks appear, further upside may be capped in the near term. Several experts predict gold may consolidate or trade sideways pending new catalysts.
Speculator Flows: Rapid speculative bets could lead to sharp corrections, particularly on technical breakdowns after such a strong rally.
Conclusion
The gold rally of 2025 has been driven by an unusual mix of global volatility, central bank behavior, and shifting investor psychology. While prices could pause or pull back in the coming months, the fundamental supports structural demand, central bank buying, and persistent global risks, suggest that the broader gold bull cycle is not yet over, with $3,000+ likely forming the new base for gold as we look toward 2026.
*NOT INVESTMENT ADVICE*
#gold #safehaven #uncertainty #economy #finance #trading #indicator
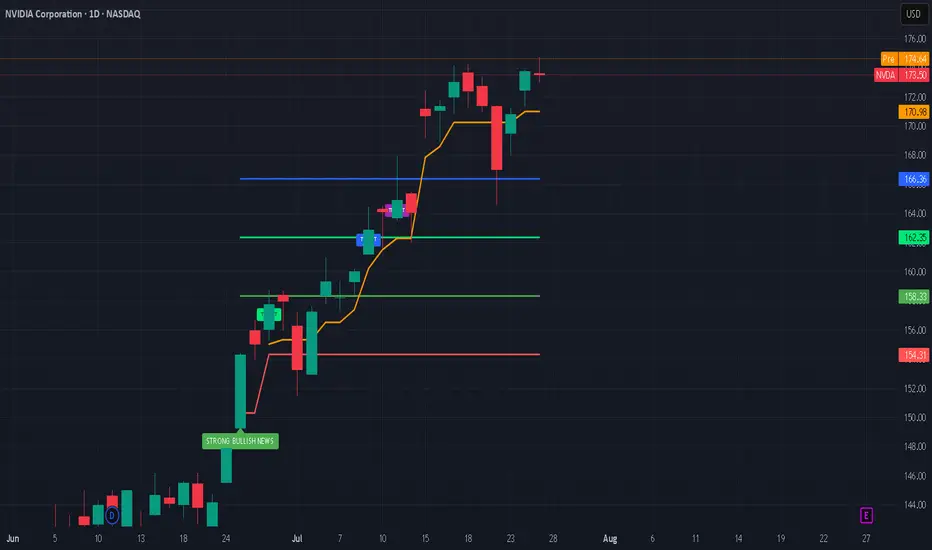
Nvidia’s Historic 2025 Stock Rally: What’s Driving It?Nvidia’s stock has once again captivated Wall Street in 2025, breaking records and fueling debates on whether its blistering momentum will continue or eventually ease. Here’s an in-depth look at why Nvidia is surging, the key drivers behind the rally, and what the long-term future could hold.
Nvidia’s Stock Rally: By the Numbers
As of July 2025, Nvidia stock has rallied more than 39% year-to-date, reaching new all-time highs above $170 and propelling the company’s market cap past $4 trillion, the largest in the world.
The stock has added nearly $2 trillion in valuation since April, outpacing tech giants like Microsoft and Apple.
Analyst price targets for the rest of 2025 vary: the average ranges from ~$174 to ~$235, with bullish forecasts up to $250 and more cautious targets down to $135.
What’s Powering the Rally?
1. Surging AI Demand:
Nvidia remains at the center of the artificial intelligence (AI) boom. Its graphics and AI accelerator chips (notably the new Blackwell AI family) are the backbone of AI infrastructure for Global Tech firms (Amazon, Meta, Microsoft, Google) and cloud service providers. This AI-centric demand has kept revenue growth robust and margins high (approaching 70%).
2. Easing China Trade Fears:
Earlier in 2025, U.S.–China export controls severely restricted Nvidia’s sales of advanced AI chips like the H20 to Chinese customers, causing a temporary selloff. However, a subsequent pause on tariffs by the U.S. and optimism about renewed China shipments reignited investor confidence, helping reverse earlier losses and extending the rally.
3. Massive Tech Investment Cycle:
The global rush to build out AI infrastructure is bringing huge investments from U.S. and international hyperscalers. Meta and Amazon alone have announced plans to pour “hundreds of billions” into AI data centers, much of it destined for Nvidia-powered hardware.
4. Strong Fundamentals and Diversification:
Nvidia sports some of the highest profit margins among mega-cap tech stocks. Its free cash flow, dominant market share, and expanding ecosystem, including platforms like Omniverse (for 3D and digital twins) and Drive (autonomous vehicles)—cement its leadership well beyond just chips.
What Could Slow Nvidia Down?
Despite the excitement, several risks linger:
Valuation Concerns: Nvidia trades at a premium (P/E above 50 for trailing earnings), raising worries of a pullback if growth slows.
Geopolitical and Regulatory Threats: Further U.S.-China tensions, new export regulations, or rising competition from rivals like AMD, Huawei, or custom silicon at cloud giants could erode growth or margins.
Cyclicality of the AI Boom: Some market watchers worry that AI infrastructure spending could prove cyclical, making Nvidia’s revenue growth more volatile in future years.
The Long-Term Outlook (2025 & Beyond)
Bullish Case: Most analysts expect continued dominance for Nvidia as AI, autonomous vehicles, robotics, and edge computing keep growing exponentially. Price targets range as high as $250 for 2025, climbing to $1,000+ by 2030 if AI adoption continues its rapid expansion.
Base Case: Moderate growth continues into 2026–2027, with a price target cluster around $180–$235 (2025) and $200–$428 (2027), assuming AI demand moderates, margins remain stable, and Nvidia fends off competitive threats.
Bearish Case: If U.S.-China relations sour and hyperscaler spending slows, the stock could retest support levels ($135–$150). However, few analysts expect a sustained collapse unless there is a fundamental change in AI or chip technology trends.
#nvda #stockmarket #finance #revenue #profit #financials #economy #technology #ai #chips
Huge Bear Trap next in line??Ethereum Exit Queue: 518,180 ETH
Half a million ETH is currently queued for unstaking on Ethereum...
Keep in mind, August 1st, Trump's Reciprocal Tariffs get in effect
Everyone's talking about BTC's new ATH, ETH's rally, XRP new ATH, but no one is talking about August 1st...
Manipulation is taking place. Stay safe, because a huge bear trap might be next in line (BTC back to 90K)
*NOT INVESTMENT ADVICE*
#crypto #ethereum #eth #btc #bitcoin #trading #xrp #trump #tariff #finance #economy

Tariffs incoming...July 23: Markets are booming.
August 1st: Tariffs.
I'm just saying, it might be a nice discount...
#market #finance #tariff #trump #crypto #forex #stocks #economy #trading