Bitcoin - Sell this upcoming pump! New Bear Flag - Target 74k!I am currently bullish on Bitcoin in the short term, and I believe Bitcoin will hit 96k, probably this week. The current price is around 91k, so this is definitely a good opportunity to sell or open a short position at 96k on futures because later this month/in January Bitcoin will most likely continue in a downtrend and hit 74k!
74k (74,508) is a significant swing low from April 2024. There is no doubt that a lot of retail traders have their stop losses placed exactly below this swing low. This acts like a strong magnet for huge institutions, hedge funds, and big banks (market makers). It's no longer a secret that Bitcoin's development and Bitcoin's price are completely controlled by these lizards. But let's take a look at the short-term prediction.
What we can see on the daily chart or on the 12h chart is a bear flag formation. This bear flag is so nice and almost textbook perfect! Inside the bear flag we have a WXY corrective pattern (3x ABC or 3x WXY). I think that this is a strong indication that the downtrend we see from the all-time high (126k) will likely continue in the next weeks.
Write a comment with your altcoin + hit the like button, and I will make an analysis for you in response. Trading is not hard if you have a good coach! This is not a trade setup, as there is no stop-loss or profit target. I share my trades privately. Thank you, and I wish you successful trades!
Flag

NFLX: Flag Forming as Market Awaits Clarity on Warner Bros DealNetflix has broken into a wider flag structure as the market digests the recent announcement of its planned acquisition of Warner Bros. Discovery. The initial move lower reflects uncertainty rather than a judgment on long-term value — which is exactly what you typically see in the early stages of large M&A.
For now, we’re waiting for regulatory clarity.
Until there’s a credible signal that the deal is likely to be approved, the market will continue to price in an uncertainty discount.
If regulators turn less hostile, the next key stage is financing clarity.
This is where Netflix will need to show:
how the transaction will be funded (debt vs. equity split),
the impact on leverage and credit profile,
the expected paydown path,
how the combined entity affects forward margins and cash flow.
Once the market understands the financing structure, the major unknowns disappear — and that’s typically when investors begin front-running the upside of the deal.
We could then see a rerating back toward major levels such as $124, and potentially even a retest of the previous all-time highs near $133, if the narrative shifts from “uncertainty” to “strategic value creation.”
For now, the flag is setting up — but confirmation will only come once those fundamental catalysts begin to de-risk.

AUDCHF: Bullish More After Breakout 🇦🇺🇨🇭
AUDCHF broke and closed above a key daily horizontal resistance.
Retesting a broken structure, the price formed a bullish flag pattern.
A breakout of its resistance line is a strong confirmation.
It indicates a highly probable movement up to 0.5656 level.
❤️Please, support my work with like, thank you!❤️
I am part of Trade Nation's Influencer program and receive a monthly fee for using their TradingView charts in my analysis.

Silver and Gold Flag and Pole PatternBoth Silver and Gold are forming Flag and pole pattern on charts. If the breakout sustains and prices go higher with support of relatively higher volumes, both commodities can achieve higher prices in near term. The momentum is currently on bulls side in both commodities but silver has more relative strength than gold. So watch both commodities for breakout.

BullsHaving closed above the weekly resistance we await complition of the pullback before we have another go at the buys. This will be targetting the 71% retracement region on the daily chart.

Bitcoin Pumps +10% — Bull Trap or Trend Reversal?Bitcoin( BINANCE:BTCUSDT ) has experienced over a +10% increase in the past two days, which came as a surprise to many analysts considering the previous bearish momentum. In other words, Bitcoin is on something of a roller coaster lately😂.
The question now is whether Bitcoin has started a new bullish trend or if it’s likely to see another decline.
Let’s dive into the 4-hour chart of Bitcoin. Currently, Bitcoin is approaching a resistance zone($94,850-$93,000), a Cumulative Short Liquidation Leverage($94,710-$94,063), and the monthly pivot point. This cluster of resistances, combined with the recent upward momentum, might make it challenging for Bitcoin to break through.
It’s also worth noting that the trading volume during this recent rally hasn’t been particularly high, so Bitcoin could still surprise us. This recent behavior shows that Bitcoin can move sharply both up and down, so it’s crucial to maintain proper risk management.
From an Elliott Wave perspective, considering Bitcoin’s recent decline, I initially expected that Bitcoin might at least test the low of its main wave 3 again. However, the recent rebound suggests that the main wave 5 may be truncated, and the corrective waves could still push Bitcoin lower, potentially even below $75,000.
From a classical technical analysis perspective, Bitcoin might be forming a bearish flag pattern, with the ascending channel acting as the flag’s pole.
In addition, the USDT.D%( CRYPTOCAP:USDT.D ) is still on an upward trend, which indicates that the cryptocurrency market might still face downward pressure.
Moreover, geopolitical tensions, such as those between the U.S. and Venezuela, could also act as a trigger for further Bitcoin declines if they escalate.
Lastly, the S&P 500 index( SP:SPX ), despite its recent bullish trend, doesn’t show the same positive correlation with Bitcoin. In fact, a decline in the S&P 500 could amplify Bitcoin’s downward movement.
Considering all these factors, I expect Bitcoin to continue its bearish trend and potentially test the heavy support zone. If these support levels break, we could see even more significant declines in the crypto market.
Based on the above explanation, I expect Bitcoin to have at least a correction to the targets I specified on the chart, and then depending on the momentum, we can expect a continuation of the decline or a resurgence.
Note: In general, with the opening of the US markets, financial market movements have become more intense these days than before, and it is better to be prepared for any scenario at that time.
What do you think? Do you believe Bitcoin will dip below $75,000, or will it bounce back?
Cumulative Short Liquidation Leverage: $98,591-$96,688
Cumulative Long Liquidation Leverage: $91,860-$90,960
Stop Loss(SL): $96,200
Points may shift as the market evolves
💡 Please respect each other's opinions and express agreement or disagreement politely.
📌Bitcoin Analysis (BTCUSDT), 4-hour time frame.
🛑 Always set a Stop Loss(SL) for every position you open.
✅ This is just my idea; I’d love to see your thoughts too!
🔥 If you find it helpful, please BOOST this post and share it with your friends.

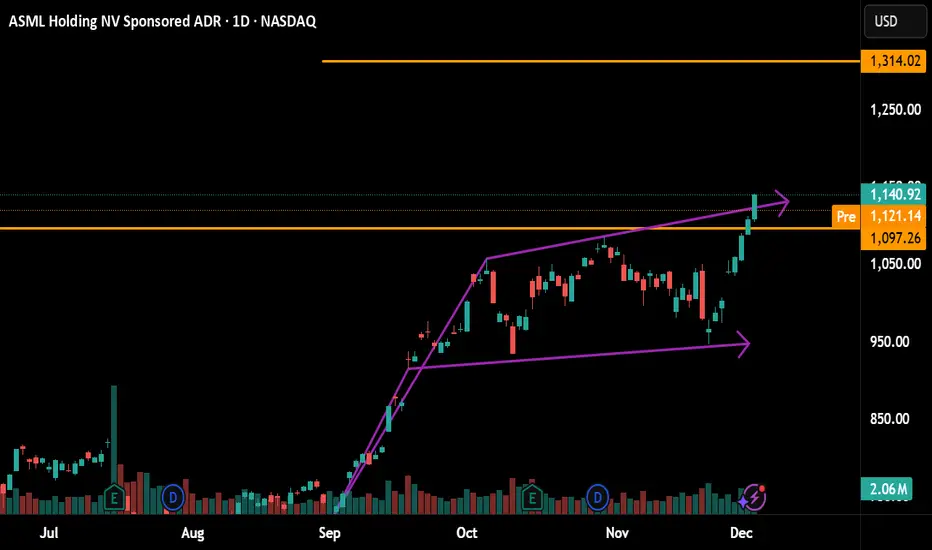
ASML : Flag Bullish Pattern activatedUpside Target 1314
cmp: 1140.92
SL: 929.
Risk Reward is not favorable so, decline is as strong opportunity 1000 around.
Manage Your Risk
Flag Bullish Pattern Breakout done
BIDU: 97 Key LevelGood investment opportunity,
If It will be sustained 97 level,
Target upside 179
SL Below 97
Good Risk to Reward Ratio.
And Flag Bullish Pattern also.

TSM :Thanks So Much : (295.45 = 400) Opportunity by Flag BullishFlag Bullish Pattern. Investment.
cmp : 295.45
Waiting for breakout.
Accumulate before stop Loss: 260.
Target : 400
Manage your Risk ..

BTCUSD – Observing a Bullish Flag Structure on the 4H ChartBitcoin’s 4-hour chart is showing a period of consolidation following a strong upward movement. The recent rally created a steep impulse leg, and price is now moving within a compact range that resembles a bullish flag–type structure. This type of structure often appears when the market is taking a pause after increased momentum.
Several moving averages (EMA 7/21/50) are positioned below the current price, indicating that short-term trend conditions continue to lean on the supportive side. Price is holding above these EMAs while staying inside the consolidation zone.
If price continues to maintain support near this range, traders will often watch for a potential continuation scenario. On the other hand, if the market slips below the lower boundary, it may signal that the consolidation phase is extending or losing momentum.
This idea focuses on illustrating the pattern and highlighting how price is interacting with the EMAs, without suggesting any specific trading action.

EURUSDcup&handle formation with trend in bullish keeping in mind that DXY is bearish which is pre-absorbing the FED expected cut. Divergence formed for the price to retrace till top of the cup and bounces back. Expectation are towards the cup&handle projection.

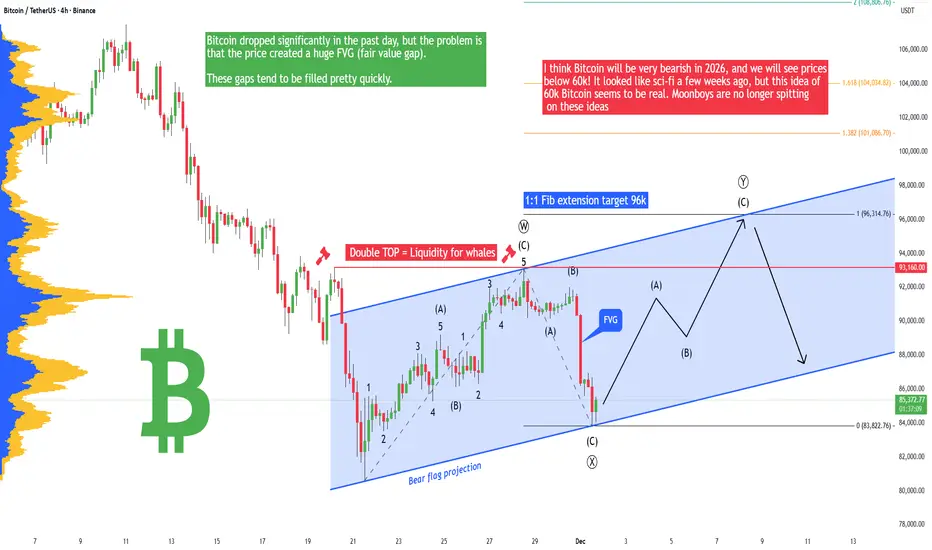
Bitcoin - Fake drop! Soon return to 96k (December PUMP!)Bitcoin has dropped like crazy in the past day because we are in a strong bear market, but I think we should see a December rally! I have been warning you against these big crashes pretty much since Summer 2025. I knew it was going to happen - the question was not if but when.
The price created a huge FVG, and this gap is very unfilled. Pretty much it looks like a huge manipulation from big players (they sent the price down significantly to liquidate high-leverage traders on futures). You know that the Bitcoin market is completely manipulated by the Fed, banks, and huge institutions. They even have a roadmap, and they know what the price of Bitcoin will be in 2030 and 2040. I know everyone hates the Fed and banks, but this is how it is. We trade it, so you have to be able to predict their movements and trade with their plan.
I think Bitcoin will be very bearish in 2026, and we will see prices below 60k! It looked like sci-fi a few weeks ago, but this idea of 60k Bitcoin seems to be real. Moonboys are no longer spitting on these ideas, and some people are calling for 30k or 40k Bitcoin. Let me know in the comment section your prediction. I am curious! You have to understand that there is a lot of manipulation going on in this world. We live in a physical world that has been created recently. The original astral world is where the magic happens. And yes, the physical world is a scam and fraud. The sooner you understand that after you're dead, you wake up in the original astral world, the better for you.
Currently, I am pretty bullish, I think we will see a bullish rally sooner rather than later!
Write a comment with your altcoin + hit the like button, and I will make an analysis for you in response. Trading is not hard if you have a good coach! This is not a trade setup, as there is no stop-loss or profit target. I share my trades privately. Thank you, and I wish you successful trades!
MarketBreakdown | USDJPY, EURCAD, Dollar Index, US30
Here are the updates & outlook for multiple instruments in my watch list.
1️⃣ #USDJPY daily time frame 🇺🇸🇯🇵
Correctional movement continues.
The price now formed a falling parallel channel - a bullish flag.
A bullish breakout of its resistance and a daily candle close above
will confirm a completion of a correction and a resumption
of a long-term uptrend.
2️⃣ #EURCAD daily time frame 🇪🇺🇨🇦
The market is in a deep consolidation.
The price is stuck within a wide horizontal range on a daily
for more than a month.
We can expect a bullish continuation to a resistance of the range.
A bearish movement will most likely follow from that.
3️⃣ Dollar Index #DXY daily time frame $
The market reached a significant daily horizontal support cluster.
Due to its historic importance, there is a high probability
to see a pullback from that.
4️⃣ DOW Jones Index US30 daily time frame
The market continues coiling alongside a recently broken
trend line that turned into a strong vertical resistance now.
There is a high probability that we will see a stronger retracement
from that and a bearish movement.
Do you agree with my market breakdown?
❤️Please, support my work with like, thank you!❤️
I am part of Trade Nation's Influencer program and receive a monthly fee for using their TradingView charts in my analysis.


AUDUSDCup formation complete-handle formation to be waited. Divergence confirmed at 1H timeframe which make a expected retracement at fib retracement lvl of 0.368.
Order can be put with tight SL at top of cup or trade can be executed at smaller timeframe.
Will wait for proper cup&handle formation for the execution of long trade at top of cup/pole of flag

The #1 Indicator For Stop LossesOne time I had to defend myself
because a person I thought was my friend
approached when he was drunk.
I recently just had eye surgery so
I told him about it..
for some odd reason, he thought
he could take advantage of me.
I then defended myself.
He tried again when he was drunk
I then walked away from him
But I give him a "middle finger"
in words..
He retaliated and came back with a gang
and with
insults.
I didn't hear him because
I was on the phone talking to a girl
that I dig...lol!
Today I saw him a distance
and I recognised his walk.
Then he saw me and walked away instantly
Keep in mind this was at a distance.
while he was sober..
He didn't want that smoke.
He knew once he get that smoke
with me.He's gonna shiver in
his little baby boy pants.
The point am trying to make to you
is that it takes time to master something
and as we journey
together on this trading.
I need you to be patient
and learn not only
from my mistakes
but also from yours
am now the O.G I used to look up
to.
On this chart, I have used the
parabolic
to set my stop loss and buy stop
order
And so far I think its a good trade.
A good Buy trade
plus, sentiment is very strong.
its perfect- I think
it will turn out well.
Trade safely out there.
Rocket boost this content to learn more
Disclaimer: Trading is risky. Please use risk management
and profit taking
strategies
Also feel free to use a simulation trading account
before you trade with real money.

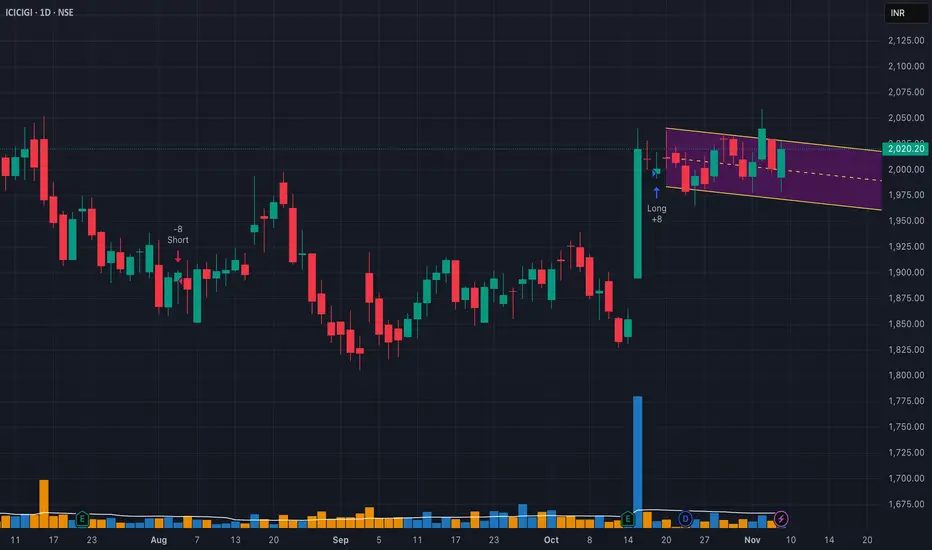
ICICI Lombard Signalling Flag PatternObserved Volume breakout on 15 th October.
Now consolidating in a channel.
Showing an Pole and Flag Pattern.
Entry above on Channel Breakout.
SL below Channel
Target 2080/2250
$RDDT – Larger Head & Shoulders + Bear Flag = Trouble AheadReddit ( NYSE:RDDT ) is showing a bigger-picture head & shoulders pattern combined with a near-term bear flag, and the downside risk is real if the market continues to weaken — especially if NASDAQ:NVDA disappoints on earnings.
🔹 The Bigger Structure:
Head: The peak around $280
Right Shoulder: Forming around $230
This entire pattern is stretched over months — a structural topping pattern with heavy implications.
🔹 Near-Term Structure:
Between $180–$190, NYSE:RDDT is building a tight bear flag.
This is exactly the kind of setup that resolves to the downside when market sentiment turns.
🔹 Downside Levels:
First real support sits around $202, and that’s where sellers likely target first.
A breakdown of the flag could send it there quickly, especially in a risk-off tape.
🔹 Macro Risk:
If NASDAQ:NVDA misses earnings, this market is sitting on a cliff.
Momentum names and high-beta IPOs like NYSE:RDDT tend to get hit the hardest when liquidity dries up.
Combine macro weakness + a topping pattern + a bear flag… and you have a real setup for further downside.
🔹 My Trade View:
1️⃣ Bias: Bearish while under the 9 EMA.
2️⃣ Trigger: Breakdown under the bear flag ($180–$190 zone).
3️⃣ Target: $202 first, and potentially lower depending on market conditions.
4️⃣ Stop: Above the flag highs / 9 EMA.
Why This Matters:
You don’t often see a multi-month topping pattern line up cleanly with a short-term continuation short setup.
NYSE:RDDT has room to fall if the broader market unwinds.
This is one of the cleanest momentum breakdown candidates on the board.

EURCHF new bullish expected
OANDA:EURCHF trend based analysis, we are have strong bullish push, currently price in BULLISH FLAG pattern, from here expecting new bullish push
SUP zone: 0.93100
RES zone: 0.93950, 0.94150

USDCAD daily bearish flagI see a bearish flag on USDCAD. Waiting for confirmation to go short if it doesn't break the trend line forming the upper edge of the flag

Downfall of DXY?!? Bears Flag The Possibility!Here on TVC:DXY we can see that last week it ended in a Bearish Breakout of an Ascending Channel, the perfect Bear Flag scenario!
Now price closed the week on the ascent possibly being the Retest of the Breakout.
If the Channel holds price on a successful retest, TVC:DXY will drop!
Fundamentally, USD has impactful news all week this week. Even so, with limited data from back logged events not available until after next FOMC Meeting, this means the Federal Reserve will continue to make decisions in "the dark" and with a high probability of a Rate Cut coming in December!
If the Bear Flag is successful in being a continuation pattern set-up, we could see price drop down to the prior Low of November under 99!

GBPUSD - Flag + Bat= SARMy top trading idea of the week comes on GBPUSD, and it’s a unique scenario packed with multiple setups working together. The first is a potential bearish Bat pattern forming at higher prices. The second is a potential bullish flag pattern that develops before the Bat completes, offering an early opportunity to get involved on the long side.
The third setup ties everything together using a technique called the “Stop and Reverse.” This approach allows traders to transition directly from the bullish flag buy into the bearish Bat sell, creating a seamless shift from one opportunity to the next. In this video, we’ll break down how each setup works individually—and how combining them can unlock a powerful, multi-layered trading plan.
Hope you enjoyed my Top 5 this week!
Please leave any questions or comments below and I wish you guys a great week of trading.
Akil

F | Possible 3 Year Long Consolidation Over | LONGFord Motor Co. engages in the manufacture, distribution, and sale of automobiles. It operates through the following segments: Ford Blue, Ford Model E, Ford Pro, Ford Next, Ford Credit, and Corporate Other. The Ford Blue, Ford Model E, and Ford Pro segment includes the sale of Ford and Lincoln vehicles, service parts, and accessories, together with the associated costs to develop, manufacture, distribute, and service the vehicles, parts, and accessories. The Ford Next segment is involved in the expenses and investments for emerging business initiatives aimed at creating value for Ford in vehicle-adjacent market segments. The Ford Credit segment consists of the Ford Credit business on a consolidated basis, which is primarily vehicle-related financing and leasing activities. The Corporate Other segment refers to corporate governance expenses, past service pension and OPEB income and expense, interest income and gains and losses from cash, cash equivalents, and marketable securities, and foreign exchange derivatives gains, and losses associated with intercompany lending. The company was founded by Henry Ford on June 16, 1903 and is headquartered in Dearborn, MI.
