Almost ReadyThere might be an opportunity to enter a trade if the stock price breaks out of the triangle pattern upwards with a significant increase in volume."
Flag

Target Sputters as Market Recovers Target has sputtered as the broader market recovers, and some traders may think the retailer has further downside risk.
The first pattern on today’s chart is the steady decline between early February and early April. TGT tried to stabilize after the move but barely rebounded. It also failed to hold the rally on May 12 after Treasury Secretary Scott Bessent cut tariffs on China. That feeble price action may suggest sellers remain in control.
Second, the stock spent about a month at its 50-day simple moving average (SMA) early this year before continuing lower. It’s now spent about three weeks at the same line without closing above it. Is the intermediate-term trend still bearish?
Third, the move between April 8 and May 20 may be viewed as a potentially bearish flag that’s now broken to the downside.
Next, the 8-day exponential moving average (EMA) recently crossed below the 21-day EMA. MACD has also turned negative. Those patterns may reflect a bearish short-term trend.
Finally, TGT is an active underlier in the options market. (It averages more than 70,000 contracts per day, according to TradeStation data.) That could help traders take positions with calls and puts.
Check out TradingView's The Leap competition sponsored by TradeStation.
TradeStation has, for decades, advanced the trading industry, providing access to stocks, options and futures. If you're born to trade, we could be for you. See our Overview for more.
Past performance, whether actual or indicated by historical tests of strategies, is no guarantee of future performance or success. There is a possibility that you may sustain a loss equal to or greater than your entire investment regardless of which asset class you trade (equities, options or futures); therefore, you should not invest or risk money that you cannot afford to lose. Online trading is not suitable for all investors. View the document titled Characteristics and Risks of Standardized Options at www.TradeStation.com . Before trading any asset class, customers must read the relevant risk disclosure statements on www.TradeStation.com . System access and trade placement and execution may be delayed or fail due to market volatility and volume, quote delays, system and software errors, Internet traffic, outages and other factors.
Securities and futures trading is offered to self-directed customers by TradeStation Securities, Inc., a broker-dealer registered with the Securities and Exchange Commission and a futures commission merchant licensed with the Commodity Futures Trading Commission). TradeStation Securities is a member of the Financial Industry Regulatory Authority, the National Futures Association, and a number of exchanges.
Options trading is not suitable for all investors. Your TradeStation Securities’ account application to trade options will be considered and approved or disapproved based on all relevant factors, including your trading experience. See www.TradeStation.com . Visit www.TradeStation.com for full details on the costs and fees associated with options.
Margin trading involves risks, and it is important that you fully understand those risks before trading on margin. The Margin Disclosure Statement outlines many of those risks, including that you can lose more funds than you deposit in your margin account; your brokerage firm can force the sale of securities in your account; your brokerage firm can sell your securities without contacting you; and you are not entitled to an extension of time on a margin call. Review the Margin Disclosure Statement at www.TradeStation.com .
TradeStation Securities, Inc. and TradeStation Technologies, Inc. are each wholly owned subsidiaries of TradeStation Group, Inc., both operating, and providing products and services, under the TradeStation brand and trademark. When applying for, or purchasing, accounts, subscriptions, products and services, it is important that you know which company you will be dealing with. Visit www.TradeStation.com for further important information explaining what this means.

TSLA: Continues to form a Cup and Handle reversal patternHey folks,
Just a quick analysis of NASDAQ:TSLA on the daily chart. Compared to my last analysis, price has fallen a bit since, as a new flag (handle) continues to form following a cup pattern.
- Cup and Handle pattern forming. The handle would also count as a bull flag. This is known as
a cup and handle reversal pattern, after a downtrend. So yes, it is possible for a stock to
reverse its trend through the formation of a cup and handle reversal pattern (as you can see
in the chart).
- Major resistance at $366 which marks the peak of the flag (handle) pattern. This would have
to be broken in order for the cup and handle to be valid.
- Volume has also been decreasing during the formation of this pattern: this is typical amongst
Cup and Handle patterns, and generally a positive sign.
Note: Not financial advice.

GU Bulls Raise "Flag" Eyeing Higher PricesFX:GBPUSD has formed a Bull Flag and we could be getting ready to see the Bulls take the spotlight!
After Price broke through the Previous Level of Structure, Price retraces the High of 1.35589 to the 50% Fibonacci Level @ 1.35022 and is supported pushing Price back up from the Previous Level of Structure.
-The 50% retracement signals the end of the Consolidation Phase of the Pattern.
Now with a Bull Flag being a Continuation Pattern, we can suspect that Price will give us a Bullish Breakout of the Descending Channel and Retest before moving higher Confirming the Pattern and once the Breakout is Validated!
Based off the "Flagpole" of the Pattern, if a Bullish Breakout is Validated and the Retest is Successful, the extension of the Set-up would place the Price Target @ 1.3640 which is at the next big level of Resistance.

BTCUSDT is following flag PatternBTCUSDT is following a flag Pattern, it has also given a retracement of the 0.5 fib level.
GOLD (XAUUSD): Bullish Continuation Confirmed
As we discussed yesterday, Gold managed to break and close above
a resistance line of a bullish flag pattern on a daily.
It opens a potential for more growth.
Our next resistance is 3429.
For buying, consider the expanding demand zone based
on a broken horizontal resistance and a trend line.
❤️Please, support my work with like, thank you!❤️
I am part of Trade Nation's Influencer program and receive a monthly fee for using their TradingView charts in my analysis.


GOLD (XAUUSD): Sense of Fear?!
As the Russia-Ukraine peace talks are going today,
Gold shows clear signs of worry.
The market turned bullish after the opening and is currenty
breaking a resistance line of a bullish flag pattern on a daily
that we discussed earlier.
To confirm the violation, we will need a daily candle close above that.
As the results of the talks are still unknown, more moves may occur today.
So the today's close will be very important.
Let's patiently wait.
❤️Please, support my work with like, thank you!❤️

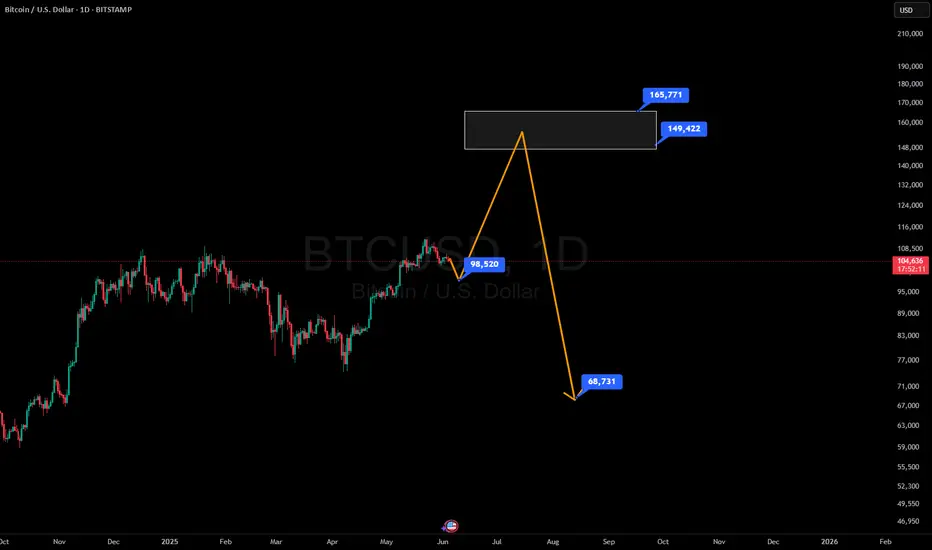
$Btc Bearish Flat Pattern Forming?Bitcoin Bearish Flat Pattern Forming? Potential Short Setup to $97K-$98K if Rejected at $106K
📉 BTC recently hit a new all-time high around $112K, followed by a series of higher lows near $110K, $108K, and potentially $106K. If price gets rejected at $106K, a bearish flat pattern may play out—triggering a high-probability short opportunity toward the $97K–$98K support zone. However, a clean breakout above $107K will invalidate this setup.

Gold 1D timeframe. What Next Moment?Hello everyone, I am back after 3 years. Finally I have decided to continue my trade journey in forex and crypto professionally.
Here is the analysis of XAUUSD/Gold.
Gold has taken a big bold moment of Uptrend since strong resistance breakout on march of 1st, 2024. Since that time Gold didn't looked back & continued it's rally in uptrend. So our major trend is Uptrend in 1D and 4H timeframe. Gold did some downtrend and sideway rally and again took another uptrend rally on Dec of 18th, 2024. Gold break all top high and made new high 3500.
If I talk in 1D timeframe gold is trading in bullish flag, and I am not wishing it right now to break upward. But has you know it is gold anything can happen. While today is Monday and market opening was in gap. So it needs to fill the gap after that we can execute a trade. Still now needs some confirmation that it will come down. So have patience and watch the market carefully.
Key point.
Resistance - 3356, 3369, 3396
Support - 3343, 3323, 3304
Any Query Reach Us or comment down
Rudra Vasaikar Wishes You A Great And Very Amazing Trading Life. Trade Safe, Trade Right.
RISK WARNING 🔴 🔴 🔴
There is high risk of loss in Trading Forex, Crypto, Indices, CFDs, Features and Stocks. Choose your trade wisely and confidently, please see if such trading is appropriate for you or not. Past performance is not indicative of future results. Highly recommended - Information provided by Pro Trading Point are for Educational purpose only. Do your investment according to your own risk. Any type of loss is not our responsibility.
HAPPY TRADING.
#gold #xauusd #xauusdtrading #goldtrading #goldanalysis #forextrading #forex #trendline #goldsignals #goldnews goldlatestanalysis #xauusdtradesetup #forextradingguide #fxgold

Link Analysis (12H)Chainlink (LINK) Technical Outlook – Elliott Wave Perspective
After applying Elliott Wave Theory, the chart appears to speak for itself — the downward corrective phase seems to have concluded.
Zooming into lower timeframes, there are several bullish signs suggesting that LINK is primed for an upward move.
Key Technical Reasons Supporting Upside Potential:
Bullish Flag Formation: A clear flag pattern has formed in lower time frames, and LINK is currently testing its resistance level.
Elliott Wave Count: Based on wave structure, Wave 3 appears to be nearing completion. Should we see a short-term pullback, it would likely be Wave 4, offering a strong buy opportunity around the support zone of the flag.
Fib Confluence: The potential retracement aligns perfectly with the 50% Fibonacci level — a typical target area for Wave 4 corrections.
Two Possible Scenarios:
Immediate Breakout: With support from Bitcoin’s continued momentum, LINK could extend its current Wave 3 and break out from the flag without any significant pullback.
Healthy Correction: Alternatively, LINK could retrace to the 50% Fib level before initiating the final leg of Wave 5 — providing a textbook buying opportunity.
Target:
In both scenarios, the upside target remains the same: $18.00 to $18.40 range.
— Thanks for reading.

GOLD (XAUUSD): Support : Resistance Analysis For Next Week
Here is my latest structure analysis and
important supports & resistances for Gold for next week.
Horizontal Structures
Support 1: 3238 - 3286 area
Support 2: 3122 - 3179 area
Support 3: 2957 - 2982 area
Resistance 1: 3353 - 3366 area
Resistance 2: 3427 - 3425 area
Resistance 3: 3483 - 3501 area
Vertical Structures
Vertical Support 1: falling trend line
Vertical Resistance 1: falling trend line
Consider these structures for pullback/breakout trading.
❤️Please, support my work with like, thank you!❤️
I am part of Trade Nation's Influencer program and receive a monthly fee for using their TradingView charts in my analysis.

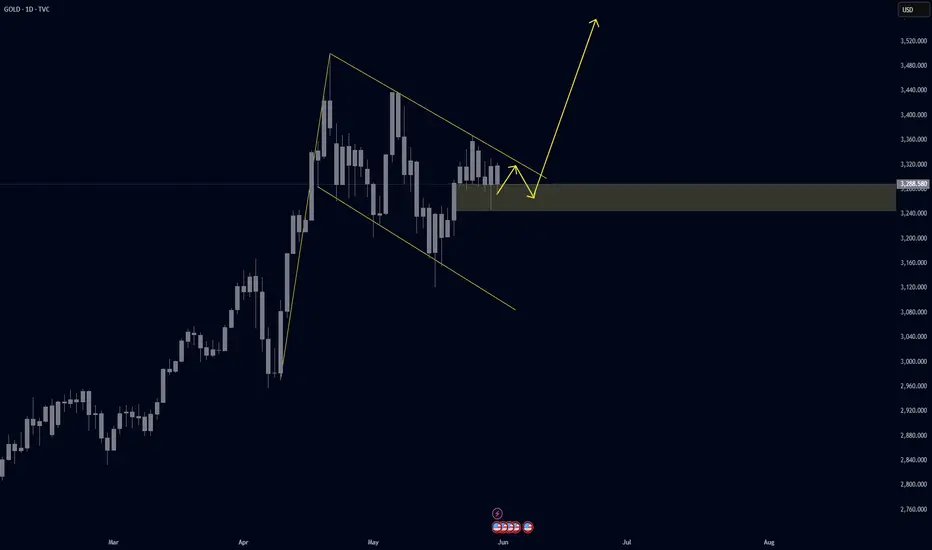
POSSIBLE BREAKOUT ON GOLDGold is making what looks like a large bull flag. Could see it retrace a little bit further before it finally breaks out to new highs
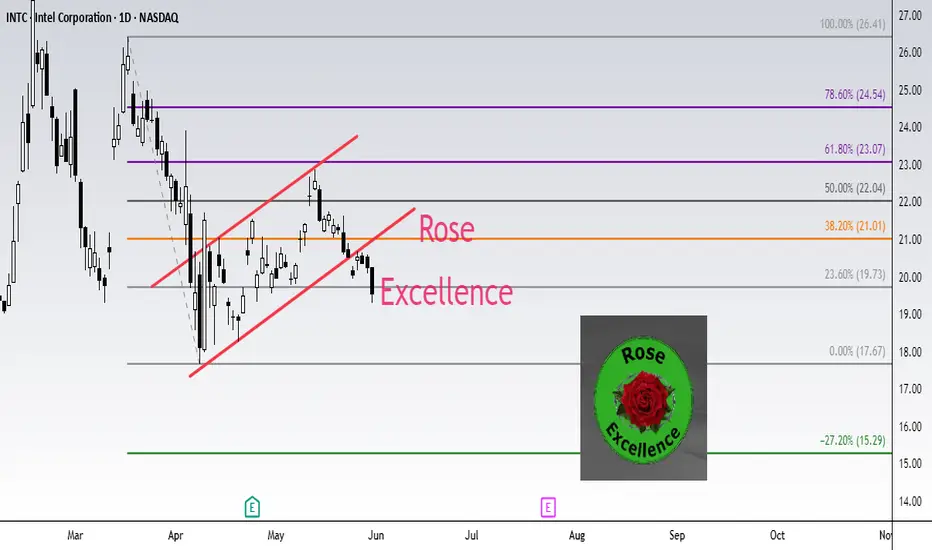
INTEL INTC Short setup target 15.29Fibonacci technical analysis : Intel Corporation NASDAQ:INTC has already found resistance at the Fib level 61.8% (23.07) of my Down Fib. The May 30th Daily candle has closed below retracement Fib level 23.6% (19.73), confirming a sell signal. A Bear Flag pattern has also formed. My Down Fib guides me to look for NASDAQ:INTC to eventually go down to hit first target at Fib level -27.2% (15.29).
NASDAQ:INTC – Target 1 at -27.2% (15.29), Target 2 at -61.8% (12.26) and Target 3 at -78.6 (10.79)
Stop loss slightly above the 50.0% retracement Fib level (22.04).
Enjoy the trading process and take time to smell the roses🌹
GOLD (XAUUSD): Detailed Daily Time Frame Analysis
Gold is officially in correction now.
Analysing a price action on a daily time frame,
we can see a valid bullish flag pattern.
A minor trend that we see within the boundaries of the flag
reflects a global overbought state of the market.
The upper boundary of the flag is a strong vertical resistance
that concentrates a selling interest.
An accurate signal of a resumption of a bullish trend will be
a breakout and a candle close above that.
A bullish wave will be expected at least to 3420 then.
Remember that we can not predict how long the market will
keep trading within the flag. Also, the market may easily
drop lower within that, updating the low.
If a correction continues below the low of a flag pole,
that may signify a global bearish reversal.
Of course, from a current geopolitical and economic perspective
it is a low-probability scenario.
❤️Please, support my work with like, thank you!❤️

BCH Analysis for Scalpers (1H)Bitcoin Cash (BCH) is currently showing multiple technical signals that support a potential bullish continuation.
A reversed Head and Shoulders pattern is in the process of forming, and it aligns well with several key confluences — including the Ichimoku Cloud and volume profile support zones.
A breakout above the $430 level would not only confirm the pattern but also activate a bullish flag formation, adding further momentum to the setup. In that case, the next immediate target would be around $452.4.
This setup remains valid only upon confirmation of the breakout. Until then, caution is advised — a clean break and retest would offer the most favorable entry.
— Thanks for reading.

NVDA: Ascending triangle break, bull flag on S/R retestHey traders! I'm back and once again, I've spent almost the whole evening (lol) trying to figure out the odd, strange price action we've seen from NASDAQ:NVDA over the past few weeks, and especially today!
As we all know (I assume), Nvidia failed to disappoint on earnings once again, and we saw a HUGE gap up overnight, as far as up to the $143 mark. However, we soon began to see a dip. That's fair, as traders will likely sell and take profit.
However, the dip became a larger dip, and Nvidia finished the day basically at 3.2%. But it seems that the pullback may been pretty healthy.
Because as you can see from the chart, Nvidia has been forming an ascending triangle ever since the 14th May. That was after the sweet run it had prior to that. It has tested the £136-137 area as a major resistance line ever since until finally, a strong earnings report sent Nvidia above the line.
After the gap up, throughout the day, the stock went into a controlled, composed downward channel which what we like to call, a bull flag. This is taking into consideration market hours, not extended hours. This bull flag is bullish in its own way, but it is also a sign of a retest of the $136-137 resistance zone. This is officially a support zone now.
A successful retest from this support zone will cause a bounce, especially from the support trendline, and likely send the stock towards $140+, possibly extending its reach to $150 if broader market strength (Nasdaq) continues.
On the contrary, a dip below the support line and a crash below the red support trendline, would likely send the stock lower to $133 as next support.
As long as Nvidia maintains $136-137, the bulls are in control.
Note: Not financial advice. Please do your DD.

GOLD- BULL SIGN - BUY CALL - Bullish Flag patternMarket is making a Bullish Flag Pattern and it seems when breaksout with a Buy Stop order, it will move to its projected TPs

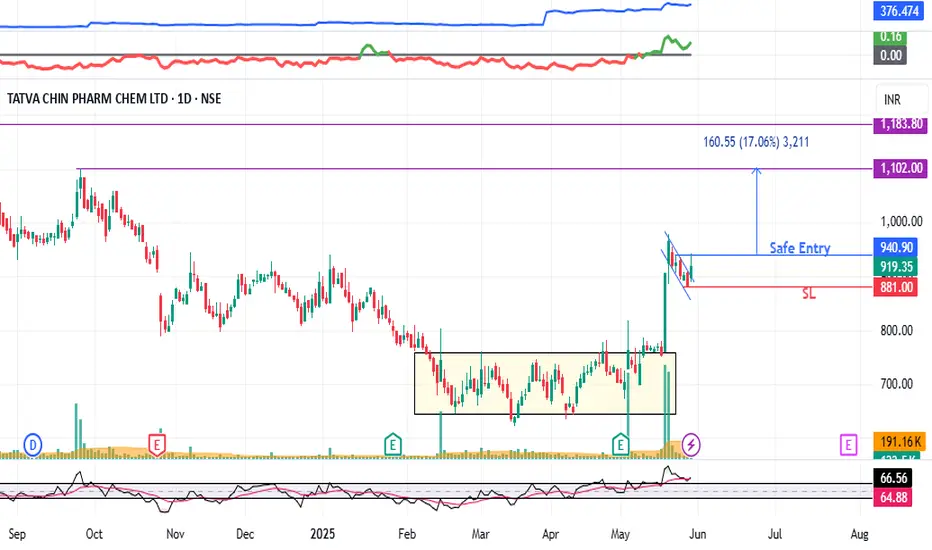
TATVA : Chart Pattern Breakout (Swing Pick)#TATVA #chartpatternbreakout #breakoutstock #flagbreakout
TATVA : Swing Trade
>> Chart Pattern Breakout
>> Flag & Pole Breakout Visible
>> Trending stock
>> Good Strength in stock
>> Volumes Driedup, Expansion imminent
>> Good Upside Potential
Swing Traders can lock profit at 10% and keep trailing
Disc : Stock charts shared are for Learning purpose and not a Trade recommendation.
Do your own analysis or Consult a SEBI Registered Advisior for taking positions
ZAGGLE : Chart Pattern Breakout ( Swing Pick )#ZAGGLE #breakoutstock #flagbreakout #chartpatternbreakout #flagandpole
ZAGGLE : Swing Trade
>> Chart pattern Breakout
>> Flag and pole breakout visible
>> Trending stock
>> Low Risk , High Reward Trade
>> Good Strength & Decent Volumes Building up
Swing Traders can Lock Profit at 10% and keep trailing
Disclaimer : Stock Charts shared are for Learning Purpose and not a Trade Recommendation. Do your Own Analysis or Consult ur Financial advisor or a SEBI Registered Advisor

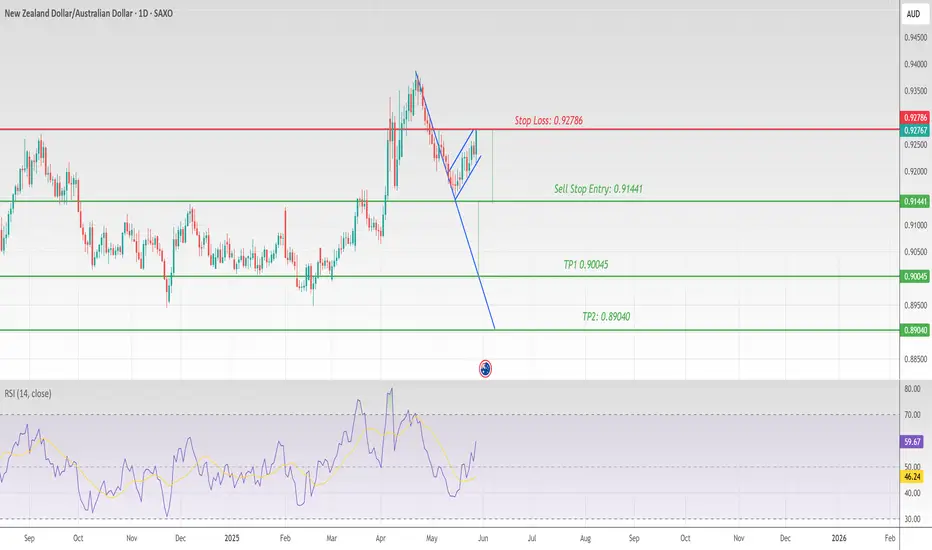
NZDAUD 1 Daily Chart Bearish Flag Continuation PatternNZDAUD 1 Daily Chart Bearish Flag Continuation Pattern
Stop Loss: 0.92786
Sell Stop Entry: 0.91441
TP1 0.90045
TP2: 0.89040
No Divergence
CADJPY: Bullish Continuation Confirmed 🇨🇦🇯🇵
Look how strongly CADJPY reacted to a recently broken
resistance that turned into a support after a breakout.
A bullish violation of a resistance line of a falling wedge on an hourly time frame
with a bullish imbalance confirms a highly probable growth.
The price will go up at least to 105.09
❤️Please, support my work with like, thank you!❤️
I am part of Trade Nation's Influencer program and receive a monthly fee for using their TradingView charts in my analysis.
