RAY : razor edgeHello friends
Given the price growth we had, the price is now in a triangle, which is now in an important area in the triangle. If the price is supported and our triangle is broken, it can move to the identified resistance areas, which are price pivots.
But if the support breaks and the price falls, the identified important supports can be the next price targets.
*Trade safely with us*
Flag

Btc Dominance Ready to Collapse = ALTSEASONAs you can see, this is the Bitcoin dominance chart on the 1-hour timeframe. A bearish flag is forming, and inside it we can also spot a head and shoulders pattern—both bearish setups. Once the flag breaks down, we can expect a strong altcoin rally that could last 2–3 weeks. So, keep your bags ready, secure profits along the way, and make sure to take some gains before the expected rate cut in September.

BTCUSD: Will the Bulls Defend Key Support Zones?The Bitcoin chart reveals a significant technical pattern that traders should be watching closely. After a strong run-up, we are seeing the asset face considerable resistance, forming what appears to be a double-top structure near the $124,000 level. 📈 This price action suggests a potential reversal or a substantial pullback before any further upward continuation.
Bitcoin is currently trading within a short-term Fib Golden Zone , a critical area for bulls to defend. 🛡️ This zone spans between the 61.8% ($116,730) and 78.6% ($114,500) Fibonacci retracement levels. A decisive break below this range could signal a deeper correction.
Beneath the short-term support, there is a key "Order Block" that could act as the next line of defense for the bulls. 🧱 This area, typically marked by institutional buying interest, is a high-probability reversal zone.
A more significant test for Bitcoin's strength lies in the "Major Fib Golden Zone" and the "Fair Value Gap" below the current price. 🎯 This area, roughly between $108,000 and $103,000, represents a confluence of strong technical support. A drop into this zone would be a healthy retracement to re-test prior support levels before attempting a new leg up.
Failure to hold the key support levels and a breakdown below the Major Fib Golden Zone could see the price seeking a deeper floor towards the "Ext Support" level, near the $96,000 mark. 📉 This would invalidate the recent bullish structure and open the door for a more prolonged bear market.
Disclaimer
The information provided in this chart is for educational and informational purposes only and should not be considered as investment advice. Trading and investing involve substantial risk and are not suitable for every investor. You should carefully consider your financial situation and consult with a financial advisor before making any investment decisions. The creator of this chart does not guarantee any specific outcome or profit and is not responsible for any losses incurred as a result of using this information. Past performance is not indicative of future results. Use this information at your own risk. This chart has been created for my own improvement in Trading and Investment Analysis. Please do your own analysis before any investments.

CVNA – Coiling for the Next Launch?After a monster run from ~$148 to ~$413, CVNA is cooling off inside a tight range ($323–$376). This looks like a classic bull flag — a pause before the next leg higher. A breakout above $376 could send price first to $413 and then toward $450 (+37%). A drop below $323, however, may open the door for a deeper pullback. Watching for volume confirmation on any breakout.

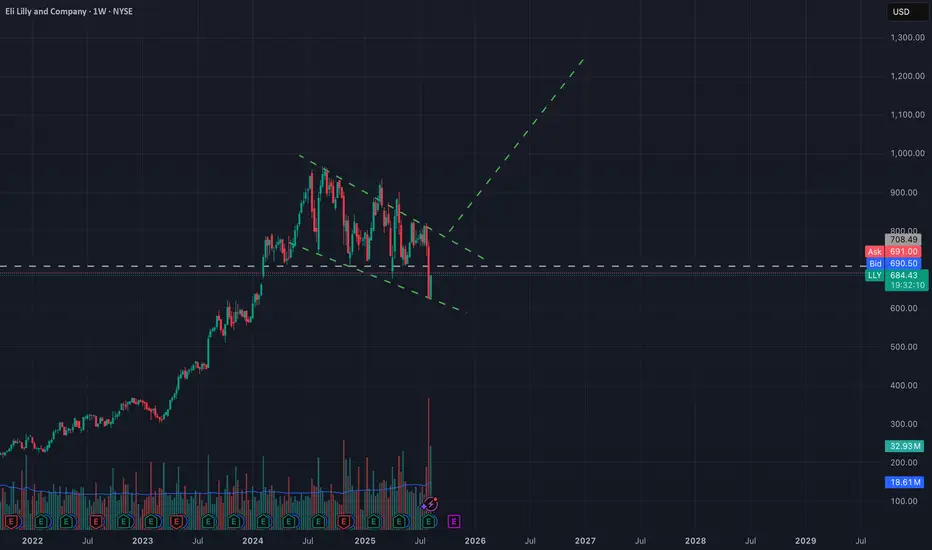
LLY - Clean LevelsBull flag patten on the LLY weekly Chart. The base of the flag/channel has been reactive so far although with low volume (See previously boxed LLY chart) off the top of the recent boxed range.
If you look at the previous chart, you will see that LLY is currently floating up through a low volume node on the anchored volume profile. Unless sellers step in here, 708.49/709 - 711.44 is the next target.
Volume will be in that area, if buyers step in, could be great for calls. Otherwise we could see a look above and fail of the top boxed range(again see previous chart under related publications to the right of this post).
~The Villain
META daily updade(swing) Meta after break out is going retest the flag.
have 2 important point to get in.
ready to entry and watch out could fake break out.

Gold Break out and retest of an H1 TF bearish flagI am still bearish on Gold, and I am seeing a bearish continuation pattern on the 1 hour TF and we already have a break out and retest of the pattern.

Linear chart version of cup&handle+ bullflag targetsI just posted the log chart version of these patterns before posting this idea and as you can see the linear chart version of these patterns have a much smaller measured move target for their breakouts. Usually what ends up happening in these scenarios is both the linear and log targets eventually get hit,, it just takes the logarithmic targets much longer than the linear ones. So while there is a possibility we could hit the log chart targets this bull run, there’s a much higher probability that we will Hit the full linear targets this bull run. With the higher log chart target that could get reached this bull run or it could also not get hit until next bull run which is something that has occurred frequently in the past with log patterns as well. Either way I’m confident those log chart targets will get hit by next bull run if not this one and pretty confident as long as the 5.3 diminishing returns theory doesn’t play out that we will very likely hit these linear price targets. *not financial advice*

Monthly chart bullflag has a breakout target around 115kIhave arbitrarily placed the measured move line for the bullflag breakout in the month of October but there’s always a chance it stays in the flag longer than that, in which case the measured move line would get moved over to the right and slightly lower each time it does. If it breaks up by october and validates that breakout the measured move target will be around 115k. *not financial advice*

LTIM | FLAG breakout | Buy @5200 | SL below 4900 | Target 6940Disclaimer:
This is not financial advice. Please do your own research or consult with a financial advisor before making any investment decisions. Investments in stocks can be risky and may result in loss of capital.

EUR/AUD – Second Chance for Bears?About a month ago, I drew attention to a potential long-term short setup on EUR/AUD, highlighting that the pair had formed a measured move pattern after the sharp drop from 1.85.
Since then, price broke below the rising trendline, but at that moment the drop lacked follow-through, and EUR/AUD bounced back. This bounce may now be a retest of the broken ascending trendline.
If this is the case, bears could get a second chance to enter at higher levels, with the overall bearish structure still intact.
Trading Plan: Selling around 1.79 could offer a solid medium-to-long-term opportunity, with a risk–reward ratio of approximately 1:2.5.
Disclosure: I am part of TradeNation's Influencer program and receive a monthly fee for using their TradingView charts in my analyses and educational articles.

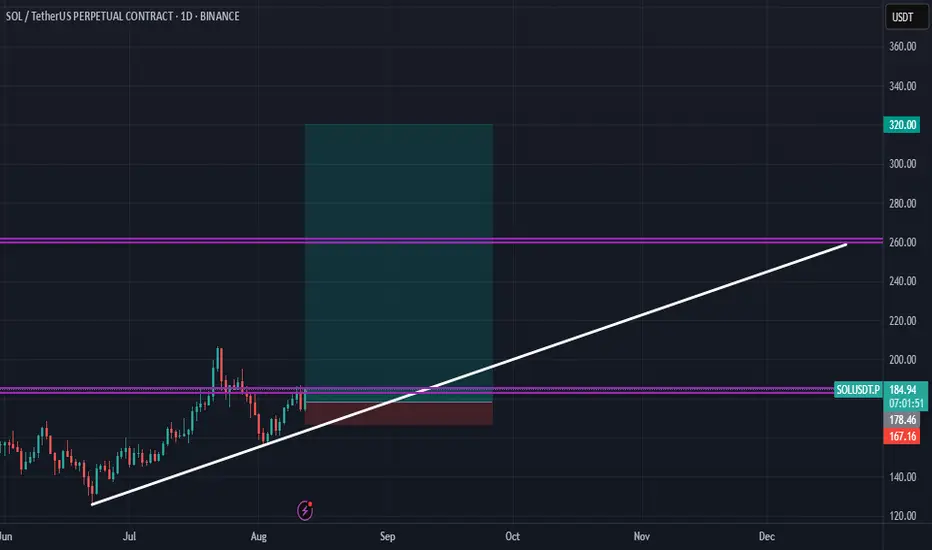
$SOLUSDT about to make a new ATH!!BINANCE:SOLUSDT has broken out of a bullish flag on the Daily time frame and this second bullish leg will see CRYPTOCAP:SOL pump to about $320 in the coming weeks.
Kindly support this post to help reach other people and do comment your thoughts about the setup.
USDCAD Bull Flag and Other Long ConfirmationsPrice is currently in a support zone on H4 after it broke out of a bullish flag and retested it. My bias is bullish and target will be in the supply zone.

BTCUSDT: Flagging for a Fresh Breakout!🚀 BTC: Flagging for a Fresh Breakout!
Bitcoin (BTCUSDT) on the daily timeframe is currently showcasing a classic bullish continuation pattern, indicating robust underlying strength and a likely ascent toward significant overhead resistance. The price action reflects a healthy consolidation phase concluding, paving the way for further upward movement.
•Powerful Pole Formation : Bitcoin initiated its recent ascent with a strong, impulsive move upwards, establishing what technical analysts recognize as the "pole" of a bullish flag pattern. This initial surge demonstrates clear demand and a forceful entry of buyers into the market, pushing valuations higher. 🚀 www.tradingview.com
•Healthy Flag Consolidation: Following this strong rally, Bitcoin entered a period of measured consolidation, forming a descending channel or "flag." This phase has been crucial for allowing the market to digest gains, with price action finding formidable support at the $113,000 ('Immediate Support 113000') zone. Furthermore, the 'Fib Golden Level 107000' also served as a critical re-accumulation point, solidifying the base. 🚩⏳
•Breakout and Re-Engagement: The asset has now successfully broken out of this bullish flag consolidation, signaling a decisive resumption of the prior uptrend. This breakout from the flag formation, coupled with the previous robust support tests, provides a high-probability setup for a continuation move, validating the renewed bullish momentum. ✨
•Targeting Resistance: Based on the textbook projection of the bullish flag and pole pattern, Bitcoin is poised to challenge the significant overhead 'Resistance 123000' zone. This area represents a critical psychological and technical barrier, and a sustained breach above it would unlock further upside potential, confirming higher highs. ⚡🎯
•Macro Tailwinds: The broader cryptocurrency market continues to benefit from an evolving regulatory landscape and growing institutional acceptance. News surrounding increasing adoption, coupled with ongoing discussions about clearer frameworks for digital assets, are contributing to a positive market sentiment. These macro factors provide a strong fundamental backdrop that supports Bitcoin's current technical strength and its journey toward higher valuations. 🌐 www.tradingview.com
Disclaimer:
• The information provided in this chart is for educational and informational purposes only and should not be considered as investment advice. Trading and investing involve substantial risk and are not suitable for every investor. You should carefully consider your financial situation and consult with a financial advisor before making any investment decisions. The creator of this chart does not guarantee any specific outcome or profit and is not responsible for any losses incurred as a result of using this information. Past performance is not indicative of future results. Use this information at your own risk. This chart has been created for my own improvement in Trading and Investment Analysis. Please do your own analysis before any investments.

BTC Technical Structure: Cup & Handle BreakoutBitcoin just broke out of a Cup & Handle formation, a pattern often associated with bullish continuation.
Pattern target based on cup depth: ~125,500 USD (projection only, not a guarantee).
Breakout came with increased trading volume and a short consolidation period.
Whether you trade or invest, identifying repeating patterns like this is a core skill for market analysis.
👉 What’s your take? Could this momentum carry into Q4?

GBPUSD Pressure to the downside following breakout of flagResistance trendline is still being respected and the break out of the bearish pattern is a strong confirmation for shorting.

Bearish Flag in PayPal?PayPal has limped as the broader market flirts with new highs, and some traders may see downside risk.
The first pattern on today’s chart is the drop on July 29 after the company reported quarterly results. While some of the numbers beat, investors focused on lower profitability. Are fundamentals deteriorating?
Second, prices continued lower the next three sessions. They inched slightly higher before stalling again, creating a potential bearish flag.
The drop occurred at the 8-day exponential moving average (EMA), which is also below the 21-day EMA. MACD is falling as well. Those patterns may be consistent with a short-term downtrend.
Finally, the 50-day simple moving average (SMA) had a “death cross” below the 200-day SMA in April and has stayed there since. That may suggest a longer-term downtrend has begun.
TradeStation has, for decades, advanced the trading industry, providing access to stocks, options and futures. If you're born to trade, we could be for you. See our Overview for more.
Past performance, whether actual or indicated by historical tests of strategies, is no guarantee of future performance or success. There is a possibility that you may sustain a loss equal to or greater than your entire investment regardless of which asset class you trade (equities, options or futures); therefore, you should not invest or risk money that you cannot afford to lose. Online trading is not suitable for all investors. View the document titled Characteristics and Risks of Standardized Options at www.TradeStation.com . Before trading any asset class, customers must read the relevant risk disclosure statements on www.TradeStation.com . System access and trade placement and execution may be delayed or fail due to market volatility and volume, quote delays, system and software errors, Internet traffic, outages and other factors.
Securities and futures trading is offered to self-directed customers by TradeStation Securities, Inc., a broker-dealer registered with the Securities and Exchange Commission and a futures commission merchant licensed with the Commodity Futures Trading Commission). TradeStation Securities is a member of the Financial Industry Regulatory Authority, the National Futures Association, and a number of exchanges.
TradeStation Securities, Inc. and TradeStation Technologies, Inc. are each wholly owned subsidiaries of TradeStation Group, Inc., both operating, and providing products and services, under the TradeStation brand and trademark. When applying for, or purchasing, accounts, subscriptions, products and services, it is important that you know which company you will be dealing with. Visit www.TradeStation.com for further important information explaining what this means.

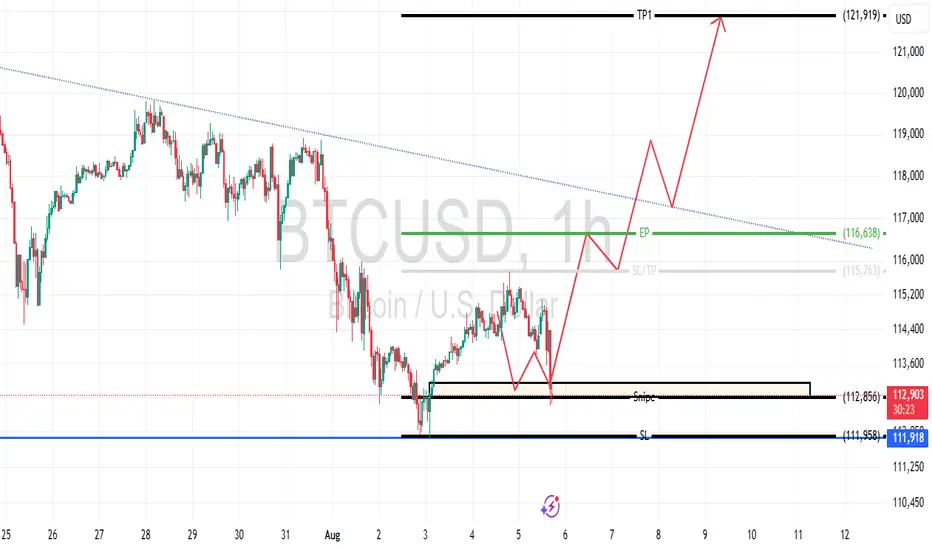
Bitcoin Possible new ATHPrice targets TP1 at $121,919, with an entry point (EP) at $116,638, stop loss (SL) at $111,987, and a support/slip level at $112,856. Expecting a rise from current levels near $113,085, driven by a breakout above the descending trendline.
XAUUSD Sell Setup bearish Flag
Low volume
High risk trade Xauusd Is sideways risky setup use small lots
SL TP EP all in Charts

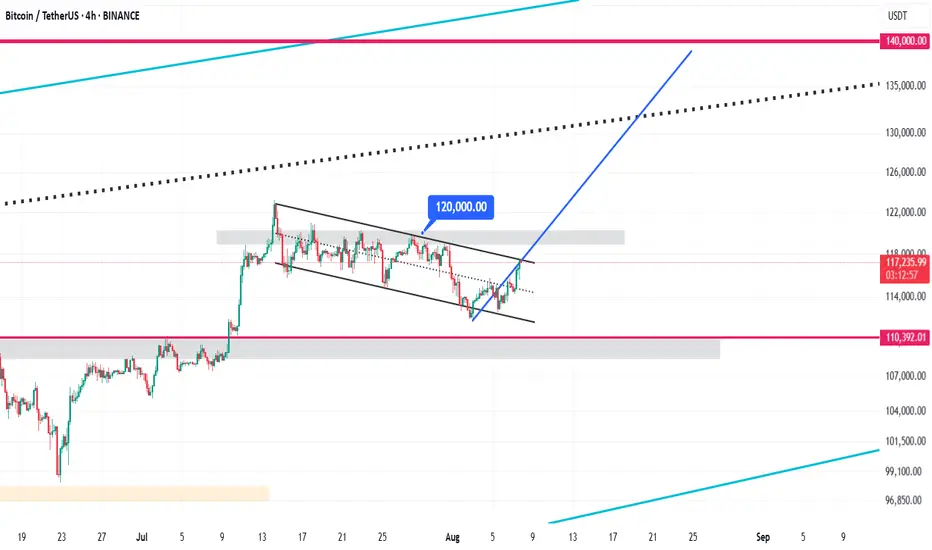
Bitcoin Bullish Flag Pattern Analysis & $140,000 Target🚩 Bullish Flag Pattern Formation
Bitcoin is currently forming a bullish flag pattern on the 4-hour chart. This pattern typically appears after a sharp upward move and represents a short-term consolidation within a descending channel. It usually signals a continuation of the strong bullish trend. Currently, the price is oscillating between the upper and lower boundaries of this channel, poised for a potential breakout.
⏳ Duration of the Correction Phase
The correction inside this channel has lasted from July 14 to August 8, 2025, spanning approximately 25 days. This relatively long consolidation period indicates a deep stabilization phase, allowing the market to gather momentum for the next upward wave. During this time, Bitcoin traded in a tight range between the channel’s support and resistance levels.
⚠️ Critical Resistance at $120,000
The key resistance level to watch is $120,000. If Bitcoin can break this level decisively with strong volume and confirming candles, the bullish flag pattern will be validated, signaling a continuation of the upward trend. This breakout point is considered an optimal entry for new long positions.
🎯 Price Target at $140,000
The target price derived from the bullish flag pattern, calculated by measuring the flagpole and projecting it from the breakout point, is around $140,000. This represents approximately a 20% gain from the breakout and may serve as a significant psychological resistance level.
BSE Takes Breather Before Its Next Move‽BSE Ltd, Asia's oldest stock exchange and a backbone of India's financial markets, has been a silent wealth creator over the past year.
From early 2024, the stock went on a dream run, driven by surging investor participation, record equity and derivatives turnover, and its diversified revenue streams - listing fees, transaction charges, and new technology-led offerings.
But like every strong trend, momentum eventually pauses. Since June, the rally cooled, and the price entered a downward-sloping channel, hinting at profit booking and cautious sentiment.
Technicals
• Primary Resistance: ₹2,500 - the top of the falling channel and a key breakout gate.
• Current Support: *2,365, where buyers have recently shown interest.
• Major Demand Zone: ₹2,270-₹2,300 - a historical springboard that fueled earlier surges.
• If Support Fails: A slide towards *1,946 and 1,775 could unfold.
The structure resembles a falling channel with a descending triangle base a classic setup where a decisive breakout can flip sentiment overnight.
The Bigger Picture
BSE's fundamentals remain robust
• India's booming equity culture is increasing trading volumes.
• Growing market share in derivatives is adding fresh revenue streams.
• Technology upgrades and new product introductions are future-proofing its business model.
Short-term price weakness appears more like a healthy pause in a long-term uptrend - provided the ₹2,270 zone holds.
Key Watch Levels
• Bullish Trigger: Sustained close above ₹2,500 could open the path to ₹2,800+
• Bearish Trigger: Close below ₹2,270 may extend the correction to ₹1,946 or 1,775.
Market Sentiment Cue
If the broader market remains strong and participation continues to rise, BSE could be setting up for its next breakout phase. But if the market turns risk-off, the stock may test its lower zones before attempting a rebound.

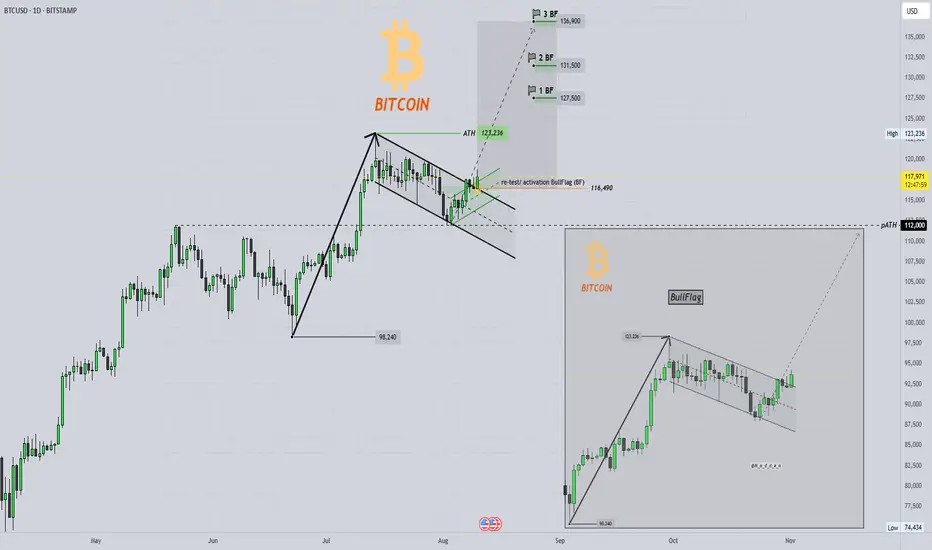
BITCOIN Bullflag and new all-time high ?!BULL FLAG and new all-time high 👀⏰
📇BTC daily-chart (BITSTAMP) and 💡everything important in the chart !
Bitcoin has broken out of its sideways consolidation and has recently successfully tested this channel (bull flag), thereby activating a potential bull flag.
The resulting targets (see example) are based on the low of approximately $98,240 and the sharp rise to the current all-time high of $123,236.
See the flags at the top with the corresponding price-targets 🏁 👀
💥Rising blue diagonal line for the previous support
💥From an indicator perspective, a possible bullish cross is imminent in the MACD-Indicator and bearish momentum may continue to decline ...
💥Finally, the bull flag (textbook) as an example of a chart pattern.
🔥Please also take a look at my last idea, as there are certain similarities based on this...
🎯 If you like this idea, please leave me a 🚀 and follow for updates 🔥⏰
Furthermore, any criticism is welcome as well as any suggestions etc. - You're also very welcome to share this idea.
I wish you a pleasant Sunday and a good start to the week & successful trading decisions 💪
M_a_d_d_e_n ✌
NOTE: The above information represents my idea and is not an investment/trading recommendation! Without any guarantee & exclusion of liability!
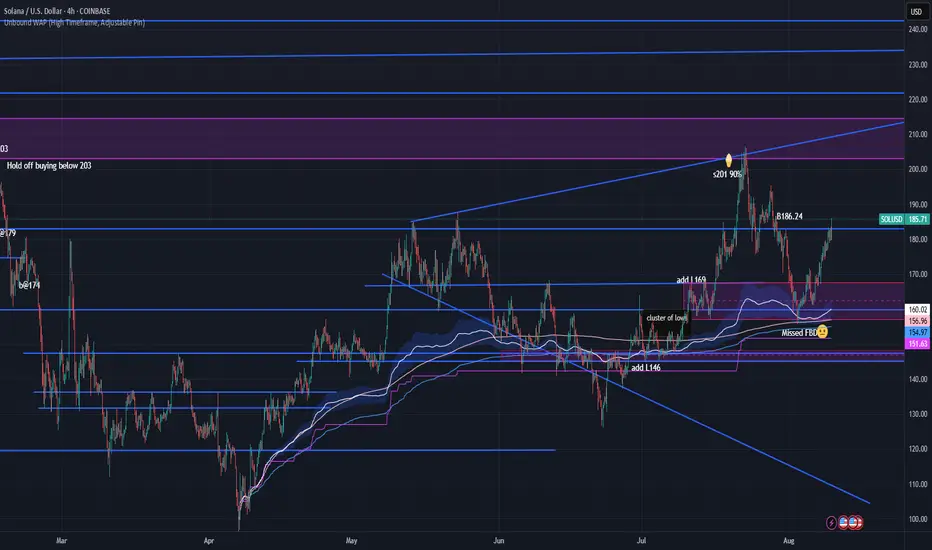
Ideal FBD on SOL with UWAPAug 25. FBD of cluster of lows from July 10-16. 6 day balance.. Combine the FBD with UWAP (Unbound WAP High Timeframe Adjustable Pin. A+ setup