The #1 Indicator For Stop LossesOne time I had to defend myself
because a person I thought was my friend
approached when he was drunk.
I recently just had eye surgery so
I told him about it..
for some odd reason, he thought
he could take advantage of me.
I then defended myself.
He tried again when he was drunk
I then walked away from him
But I give him a "middle finger"
in words..
He retaliated and came back with a gang
and with
insults.
I didn't hear him because
I was on the phone talking to a girl
that I dig...lol!
Today I saw him a distance
and I recognised his walk.
Then he saw me and walked away instantly
Keep in mind this was at a distance.
while he was sober..
He didn't want that smoke.
He knew once he get that smoke
with me.He's gonna shiver in
his little baby boy pants.
The point am trying to make to you
is that it takes time to master something
and as we journey
together on this trading.
I need you to be patient
and learn not only
from my mistakes
but also from yours
am now the O.G I used to look up
to.
On this chart, I have used the
parabolic
to set my stop loss and buy stop
order
And so far I think its a good trade.
A good Buy trade
plus, sentiment is very strong.
its perfect- I think
it will turn out well.
Trade safely out there.
Rocket boost this content to learn more
Disclaimer: Trading is risky. Please use risk management
and profit taking
strategies
Also feel free to use a simulation trading account
before you trade with real money.
Flag

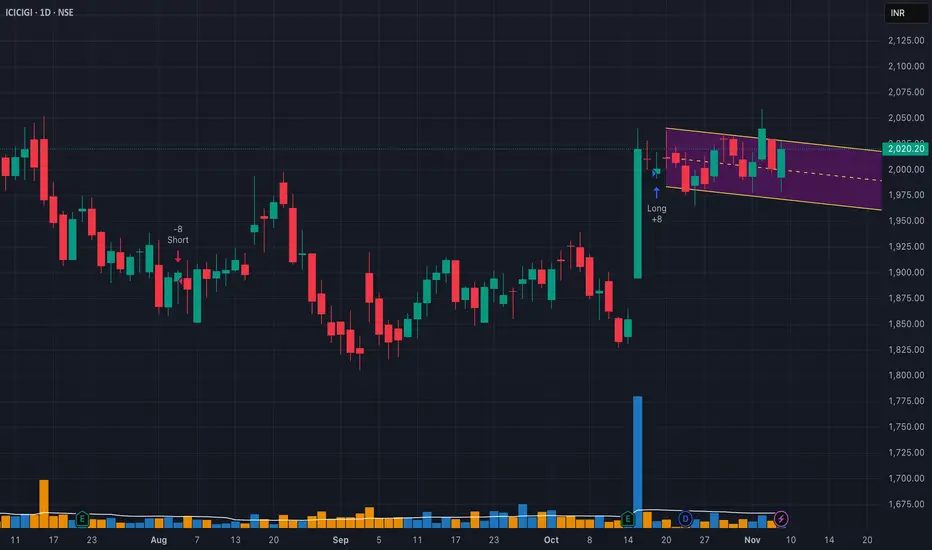
ICICI Lombard Signalling Flag PatternObserved Volume breakout on 15 th October.
Now consolidating in a channel.
Showing an Pole and Flag Pattern.
Entry above on Channel Breakout.
SL below Channel
Target 2080/2250
$RDDT – Larger Head & Shoulders + Bear Flag = Trouble AheadReddit ( NYSE:RDDT ) is showing a bigger-picture head & shoulders pattern combined with a near-term bear flag, and the downside risk is real if the market continues to weaken — especially if NASDAQ:NVDA disappoints on earnings.
🔹 The Bigger Structure:
Head: The peak around $280
Right Shoulder: Forming around $230
This entire pattern is stretched over months — a structural topping pattern with heavy implications.
🔹 Near-Term Structure:
Between $180–$190, NYSE:RDDT is building a tight bear flag.
This is exactly the kind of setup that resolves to the downside when market sentiment turns.
🔹 Downside Levels:
First real support sits around $202, and that’s where sellers likely target first.
A breakdown of the flag could send it there quickly, especially in a risk-off tape.
🔹 Macro Risk:
If NASDAQ:NVDA misses earnings, this market is sitting on a cliff.
Momentum names and high-beta IPOs like NYSE:RDDT tend to get hit the hardest when liquidity dries up.
Combine macro weakness + a topping pattern + a bear flag… and you have a real setup for further downside.
🔹 My Trade View:
1️⃣ Bias: Bearish while under the 9 EMA.
2️⃣ Trigger: Breakdown under the bear flag ($180–$190 zone).
3️⃣ Target: $202 first, and potentially lower depending on market conditions.
4️⃣ Stop: Above the flag highs / 9 EMA.
Why This Matters:
You don’t often see a multi-month topping pattern line up cleanly with a short-term continuation short setup.
NYSE:RDDT has room to fall if the broader market unwinds.
This is one of the cleanest momentum breakdown candidates on the board.

USDCAD daily bearish flagI see a bearish flag on USDCAD. Waiting for confirmation to go short if it doesn't break the trend line forming the upper edge of the flag

Downfall of DXY?!? Bears Flag The Possibility!Here on TVC:DXY we can see that last week it ended in a Bearish Breakout of an Ascending Channel, the perfect Bear Flag scenario!
Now price closed the week on the ascent possibly being the Retest of the Breakout.
If the Channel holds price on a successful retest, TVC:DXY will drop!
Fundamentally, USD has impactful news all week this week. Even so, with limited data from back logged events not available until after next FOMC Meeting, this means the Federal Reserve will continue to make decisions in "the dark" and with a high probability of a Rate Cut coming in December!
If the Bear Flag is successful in being a continuation pattern set-up, we could see price drop down to the prior Low of November under 99!

GBPUSD - Flag + Bat= SARMy top trading idea of the week comes on GBPUSD, and it’s a unique scenario packed with multiple setups working together. The first is a potential bearish Bat pattern forming at higher prices. The second is a potential bullish flag pattern that develops before the Bat completes, offering an early opportunity to get involved on the long side.
The third setup ties everything together using a technique called the “Stop and Reverse.” This approach allows traders to transition directly from the bullish flag buy into the bearish Bat sell, creating a seamless shift from one opportunity to the next. In this video, we’ll break down how each setup works individually—and how combining them can unlock a powerful, multi-layered trading plan.
Hope you enjoyed my Top 5 this week!
Please leave any questions or comments below and I wish you guys a great week of trading.
Akil

F | Possible 3 Year Long Consolidation Over | LONGFord Motor Co. engages in the manufacture, distribution, and sale of automobiles. It operates through the following segments: Ford Blue, Ford Model E, Ford Pro, Ford Next, Ford Credit, and Corporate Other. The Ford Blue, Ford Model E, and Ford Pro segment includes the sale of Ford and Lincoln vehicles, service parts, and accessories, together with the associated costs to develop, manufacture, distribute, and service the vehicles, parts, and accessories. The Ford Next segment is involved in the expenses and investments for emerging business initiatives aimed at creating value for Ford in vehicle-adjacent market segments. The Ford Credit segment consists of the Ford Credit business on a consolidated basis, which is primarily vehicle-related financing and leasing activities. The Corporate Other segment refers to corporate governance expenses, past service pension and OPEB income and expense, interest income and gains and losses from cash, cash equivalents, and marketable securities, and foreign exchange derivatives gains, and losses associated with intercompany lending. The company was founded by Henry Ford on June 16, 1903 and is headquartered in Dearborn, MI.

EURAUD: Bearish Outlook Explained 🇪🇺🇦🇺
There is a high chance that EURAUD will continue falling next week.
A bearish breakout of a support line of a rising wedge pattern
suggests a strong bearish sentiment.
Expect a fall at least to 1.765
❤️Please, support my work with like, thank you!❤️
I am part of Trade Nation's Influencer program and receive a monthly fee for using their TradingView charts in my analysis.

BNB 4h CRYPTOCAP:BNB 4H
Rejected on the first breakout attempt, but structure is still on bullish flag.
Price is retesting the breakout zone + FVG support.
A strong bounce here could send BNB toward the next FVG resistance levels at $910-$940.
Pattern still valid as long as support holds.
Let’s see if #BNB delivers.

Gold: Closely Watch 4180 Resistance and 4131 SupportGold strengthened within a ranging structure yesterday, reaching 4173 before the U.S. session and setting a new weekly high, though overall volatility remained limited. This round of upward movement was mainly driven by a sharp rise in market expectations for a Fed rate cut in December. Considering U.S. economic data, the dollar’s performance, bond market dynamics, and the latest guidance from the Fed’s Beige Book, the outlook for gold remains optimistic. Despite some mixed economic signals, market confidence in gold has stayed firm. Most institutions project that the average price in 2026 will break above the 4000 mark, and Deutsche Bank has even raised its forecast from 4000 to 4450. The long-term trend is clearly bullish, but short-term corrections are inevitable.
Today happens to be Thanksgiving, so markets will close early, leading to lighter volatility. At present, gold continues to fluctuate and consolidate. The short-term minor resistance lies around 4180, with stronger resistance above 4200. From the secondary high around 4230, gold corrected downward and then rebounded from 4000 back toward the major resistance zone—this larger movement remains in line with expectations. After yesterday’s repeated consolidation, price action has now formed a converging triangle. Between today and tomorrow, we need to watch for potential spikes followed by pullbacks or deeper dips as part of the adjustment.
Silver has been extremely strong recently, providing some supportive spillover to gold. For short-term trading, our strategy over these two days remains primarily buying on dips, supplemented with selective short positions at higher levels.
Intraday, continue to focus on whether gold can hold above 4180, and then watch the 4200+ area. Below, the 4140–4130 region offers support; if this zone breaks, the key 4100 support should be closely monitored. For short-term setups, avoid chasing breakouts or selling into weakness. Although the market shows a bullish bias within the range, upward pushes often retreat, indicating that momentum is not overly strong. Such repeated back-and-forth movement is typical in a rebound cycle. It’s best to structure entries near support and resistance levels for more favorable risk-reward opportunities.

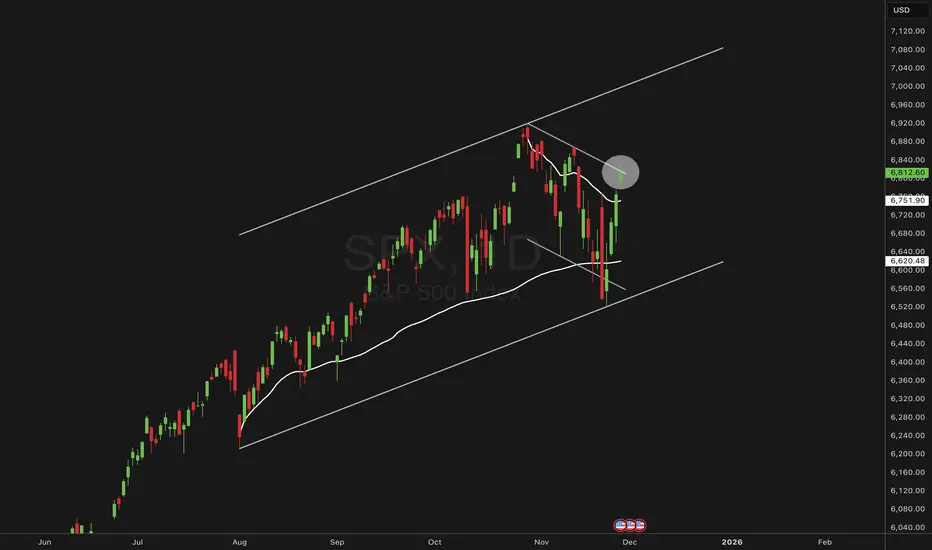
SPX | Testing the Upper Flag Line After AVWAP Shifts The index has steadied as broader sentiment firms, with markets leaning on softer inflation trends and a more patient Federal Reserve tone. That backdrop has helped risk appetite rotate back into equities after the recent pullback.
Technical Lens:
The chart shows SPX rebounding cleanly from the lower boundary of its broader bullish channel, which also aligns with the anchored VWAP drawn from the August 2025 swing low. That confluence provided a strong reaction zone. Price has since pushed through the anchored
VWAP set from the 29 October high, suggesting momentum is shifting back towards the upper side of the structure. The index now sits just beneath the upper boundary of the short-term bull flag, and this zone becomes an important area to monitor as it acts as the immediate ceiling.
Scenarios:
If the upper flag line gives way, the move could open room for continuation along the channel towards the next structural resistance zones.
If the flag line holds, the market may consolidate or retest the mid-channel levels, with the prior AVWAPs acting as nearby reference points.
Catalysts:
US GDP revisions, PCE inflation data and major tech earnings later this week may be the triggers that decide whether the index pushes through or pauses here.
Takeaway:
This upper flag boundary is the key inflection point for SPX, with the anchored VWAP shifts helping define the directional bias.
$ATOM 1H - Bull FlagNASDAQ:ATOM 1H Chart
Price is forming a clean bull flag right on top of the 15m FVG support zone.
A breakout above the flag resistance opens the path for the next leg up, targeting a strong +3% move.
#COSMOS #ATOM

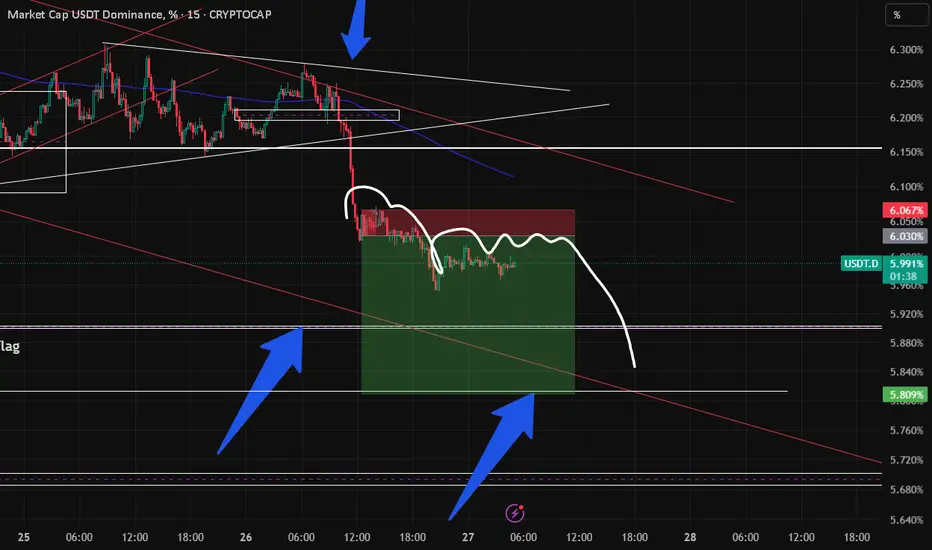
Ranging USDT.d and how it defines what happens next for BTCi stated yesterday that USDT.d will range in this zone till its convenient to drop to 5.809 without breaking out og the channel... this simply means it is going to play out the bull flag from 5.809 and btc will dump a lot from that point ... so as it stands, BTC is remaining below 96k before the dump... This can only be avoided if usdt.d breaks the lower trendline of the channel and cancels the bull flag
NZDJPY | RBNZ Signals End of Cutting Cycle – Watching Bull-Flag RBNZ’s decision to cut rates but signal a pause in further easing has shifted the macro tone for the Kiwi. Markets now see New Zealand as nearing the end of its cycle, which contrasts with Japan’s still-uncertain path as the BoJ balances weak domestic data with the risk of further currency stabilisation efforts.
Technical Lens:
NZDJPY has spent the past months forming a broad ascending structure, now testing the upper boundary of a bull-flag channel. The price has repeatedly respected the lower trend line and is leaning towards a breakout attempt at the top of the formation.
Scenarios:
If the top of the flag continues to hold, the pair may consolidate or rotate back into the channel.
If momentum carries the break, the move could extend towards the wider resistance band around 92, where the last major supply cluster sits.
Catalysts:
Shifts in Japanese risk sentiment, safe-haven flows, or any fresh signals from the BoJ could alter JPY dynamics quickly. Conversely, confirmation that RBNZ remains comfortable with a pause may keep rate-differential support in NZD’s favour.
Takeaway:
The focus is on whether NZDJPY can clear the upper boundary of this flag as the market adjusts to RBNZ’s “end-of-cuts” stance.

TWLO | Big Moves Coming After 3 Year Consolidation | LONGTwilio, Inc. engages in the development of communications software, cloud-based platforms, and services. It operates through Twilio Communications and Twilio Segments. The Twilio Communications segment includes the platforms Messaging and Voice. The Twilio Segment involves Segment, Engage, Flex, Email, and others. The company was founded by John Wolthuis, Jeffery G. Lawson, and Evan Cooke in March 2008 and is headquartered in San Francisco, CA.

SMCI - Bull Flag Breakout SetupSMCI formed a strong bullish impulse followed by a bull flag pattern.
A breakout above the flag structure may signal continuation if confirmed with strong price action.
Trade Plan:
• Entry: On breakout or retest
• Stop Loss: Below flag support
• TP1: Recent high
• TP2: Measured flagpole extension
This setup is worth monitoring for potential bullish continuation.
Disclaimer: This is not financial advice. For educational purposes only.

Gold continuation underway?On a 4 hour time frame, looking like we potentially completed a reacc model.
Price potentially continuing to retest and blow through highs.
Will be looking for entries on day trades in the green highlighted area if we start to squeeze.
Ultimate target will be the 1.61 fib of the range. (I use fibs as targets when we are running blue skies.
I will want to see us riding the 10EMA on the hour, entries will be made on the 1 min on flag breakouts while above and riding the 10EMA on the 1 min.

Don't Long Yet!Don't celebrate yet. I would not go long on BITSTAMP:BTCUSD until this bear flag on the daily is at least invalidated. Likely a few more days of consolidation.
If the bear flag validates, the first target is $73k and the second target is $63.6k. These targets are based off the fib retracement values of 1.27, and 1.68 respectively.

Clear Weekly Bull FlagNASDAQ:OPEN has a weekly bull flag. A break above the upper part for the flag will likely lead to upward momentum.
Based off Fibonacci, the first target is $13.75, and the second target is $17.38. The targets are based off the 1.27, and 1.68 fibs respectively.

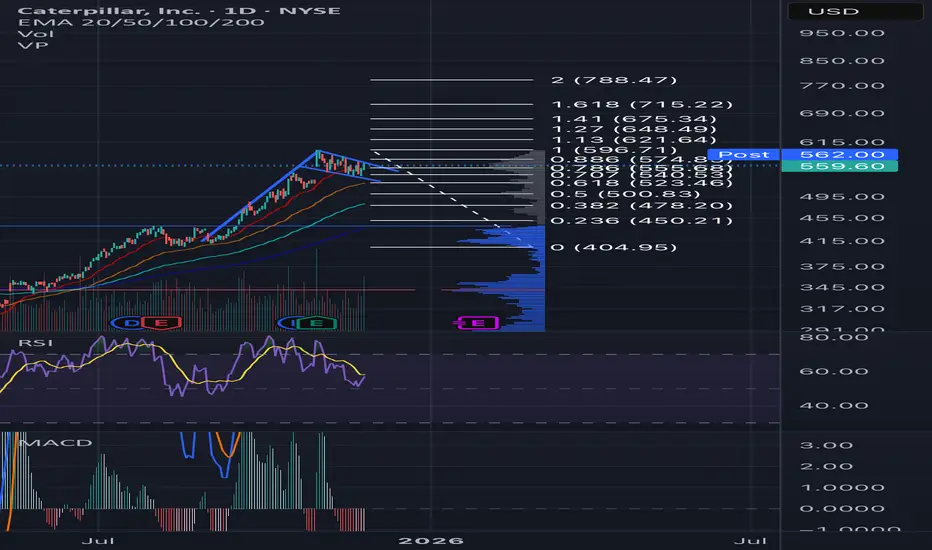
Daily Bull FlagNYSE:CAT produced a daily bull flag. A break above the upper resistance on the consolidation would indicate further upward momentum.
Using Fibonacci, the first target is $648 at the 1.27 fib, and the second target is $715 on the 1.68 fib.
GOLD Bullish Breakout! Buy!
Hello,Traders!
GOLD broke out of the bullish flag, confirming bullish momentum after absorbing sell-side liquidity. With structure shifting upward, price may extend toward the buy-side liquidity resting at the marked target level.Time Frame 5H.
Sell!
Comment and subscribe to help us grow!
Check out other forecasts below too!
Disclosure: I am part of Trade Nation's Influencer program and receive a monthly fee for using their TradingView charts in my analysis.

NZDUSD: Bearish Trend Continues 🇳🇿🇺🇸
NZDUSD is trading in a bearish trend on a daily.
The market finally completed a correctional movement yesterday,
forming a bearish imbalance candle and setting a new lower low
lower close with a confirmed BoS.
We can expect another wave lower.
Next support will be 0.56.
Look for selling after a completion of a pullback.
❤️Please, support my work with like, thank you!❤️
I am part of Trade Nation's Influencer program and receive a monthly fee for using their TradingView charts in my analysis.

PAEL analysis as a long-term stock!On a daily time frame, it shows a bearish divergence on the RSI 14. This might be ignored if it breaks the LH @ 55.4.
However, having good fundamentals intact, along with the Pole & Flag pattern and long bullish trend, makes it a good choice for the long-term portfolio. It can either be bought on Buy limit @ 48 or Buy Stop @ 54. For the safe side, it can be bought in two steps. First at Buy Stop and second at Buy Limit. Both values also comply with FVG (Fair Value Gap).
For swing trade, it would be a good buy @ 48, SL 42.7, TP 64 (1:3 RRR).
