Flag

Coinbase token DEGEN: Bull Flag signals potential 340% rallyAfter a significant 70% correction from its highs in May, DEGEN appears to be setting the stage for a strong bullish reversal. The above chart, prepared from observations on weekly and daily timeframes, indicates the correction has now concluded.
Support and Resistance
The former resistance level from March and April (2) has now been established as a support zone since early September. This "flip" from resistance to support is a classic technical signal.
Trend Reversal
A clear trend reversal is visible in both price action and the Relative Strength Index (RSI). Price action has broken out of its short-term downtrend channel, and the RSI has similarly broken above its own downtrend resistance, confirming renewed momentum.
Bull Flag pattern
A well defined bull flag pattern has formed on the daily chart. This is a continuation pattern that typically follows a strong, impulsive move (the flagpole). The current consolidation is the "flag," and it is expected to lead to another impulsive move equal in size to the first.
Price Target and Forecast
Flagpole Measurement: The first impulsive wave from its low to the recent high was approximately 340%. A repeat of this impulsive move from the base of the bull flag projects a price target of 1.5 cents. Assuming the next impulsive wave follows a similar duration to the first, we can anticipate this forecast is reached in approximately 35 days.
Conclusion
The technical setup for DEGEN is highly bullish. The combination of a confirmed support level, a trend reversal in both price and RSI, and the formation of a textbook bull flag pattern provides a high conviction long signal.
Is is possible price action continues to correct? Sure.
Is it probable? No
Ww
Disclaimer: This is for educational purposes and should not be considered financial advice. Always do your own research and manage your risk accordingly.

BULLISH ON XAUUSDBullish Momentum Ahead.
-Touch/Retest on the previous support.
-Im still expecting a drop before or after highlighted move (later on in the day if not week)
-With that being said im still expecting crazy market movement (fake outs;wicks etc)
-Bullish Confirmations:
4HR TF touch on rectangle support zone.
1HR TF new buy candle formed & closed above.
15MTF continuation flag.
-Anything can still happen; hence im expecting to types of entries.
Lets see....

RIO | Metals Miner Will Rise | LONGRio Tinto Plc engages in the exploration, mining, and processing of mineral resources. It operates through the following business segments: Iron Ore, Aluminium, Copper, and Minerals. The Iron Ore segment supplies iron ore mining and salt and gypsum production. The Aluminium segment produces bauxite, alumina and primary aluminum. The Copper segment offers gold, silver, molybdenum and other by-products. The Minerals includes businesses with products such as uranium, borates, salt and titanium dioxide feedstock together with coal operations. The Other Operations segment covers the curtailed Gove alumina refinery and Rio Tinto Marine operations. The company was founded in 1873 and is headquartered in London, the United Kingdom.

BTC long-Term Technical Analysis📍 Current Status:
Bitcoin is forming a Bullish Flag Pattern🎯
•Currently at the bottom of the pattern
•Key Support: $93,000 🛡️ (Flag Bottom)
•**Main Resistance**: $108,000 🚧 (Flag Top)
📊 Technical Signals:
•Bullish Flag pattern confirmed 📈
•RSI: Showing oversold bounce potential 💪
•Trading Volume: Consolidating at support ✅
•Fear & Greed Index: 22 - Extreme Fear Zone 🚨
🎯 Possible Scenarios:
•Bounce from pattern bottom → Target $108,000 🚀
•Break above flag → Targets:
· $116,000 🎯
· $132,000 📈
· $145,000 🏁 (Final Target)
•Pattern failure: Only if breaks below $93,000 ❌
⚡ Key Insights:
•This is the optimal entry zone within the bullish flag!
•Fear & Greed Index suggests potential reversal 📊
•Historical pattern success rate: ~75% ✅
•Potential 56% growth to final target 📊
⚠️ Risk Management:
•Stop Loss: Below $92,500 📌
•Take Profit Targets:
· $116,000 🎯
· $132,000 📈
· $145,000 🏁
💬 What's Your Analysis?
Do you confirm these signals?Share your thoughts! 👇

Presight AI (ADX: PRESIGHT) – Bullish Flag FormationPresight AI is showing a strong bullish flag pattern on the weekly chart after a sharp impulse move from the lows.
Price has been consolidating in a downward-sloping channel, forming a classic continuation structure.
📈 Technical Outlook:
Flag breakout confirmation above 3.80 AED may trigger the next leg higher.
Measured move target: 5.80–5.90 AED
Support zone: 3.40–3.50 AED
Stop loss: below 3.30 AED

S&P500 (US500): Important Breakout & Bullish Continuation
US500 likely completely a correctional movement,
breaking a resistance line of a bullish flag pattern on a 4H time frame.
I think that a bullish wave is going to start soon
and the market will reach at least to 6917 level.
❤️Please, support my work with like, thank you!❤️
I am part of Trade Nation's Influencer program and receive a monthly fee for using their TradingView charts in my analysis.

Gold Tries Another JumpThere is clear upward pressure coming to gold from silver. Perhaps another leg higher to 4270? I'm waiting for a breakout to enter position.

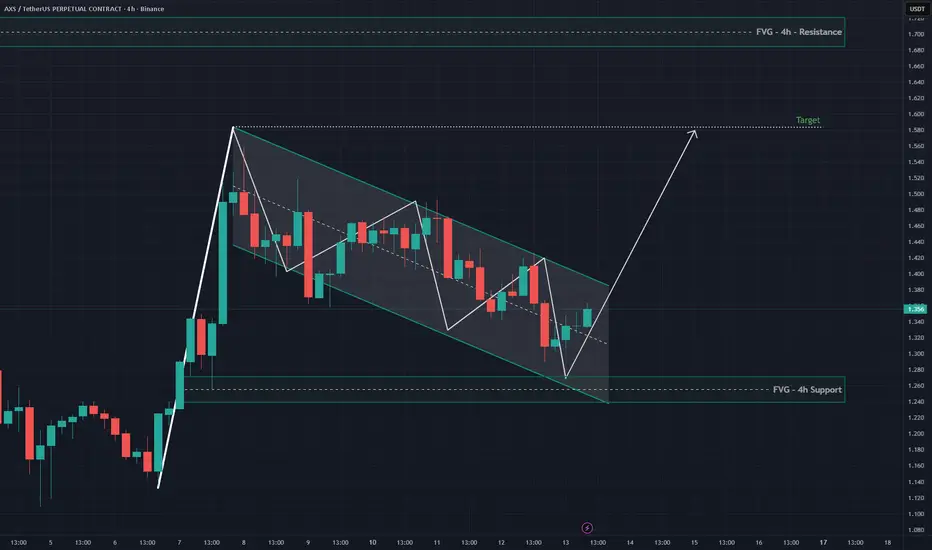
AXS NYSE:AXS 4H chart showing a falling channel structure, price just bounced perfectly from the 4h FVG support zone.
A potential bullish breakout could target the $1.58 area, aligning with the upper channel and 4h resistance zone.
Looks like smart money accumulation in progress.
#AXSUSDT #Crypto #YodaXCalls
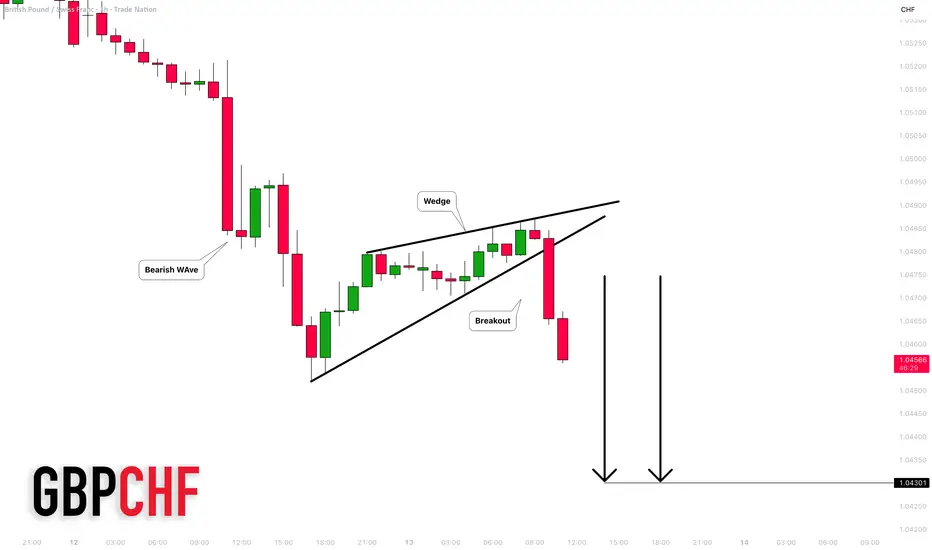
GBPCHF: Bearish Trend Continuation 🇬🇧🇨🇭
GBPCHF is trading in a strong downtrend.
A bearish breakout of a rising wedge pattern on an hourly time frame
indicates a highly probable trend continuation.
I expect a fall at least to 1.043 level.
❤️Please, support my work with like, thank you!❤️
I am part of Trade Nation's Influencer program and receive a monthly fee for using their TradingView charts in my analysis.
PEPE BUY!Hello friends
Due to the good growth we had, the price has corrected and formed a flag pattern and this pattern has been broken by buyers and now with risk capital management and in a stepwise manner, you can buy and move with it to the specified targets.
*Trade safely with us*

AUDCAD | Bullish SetupPrice looking hot here with multiple patterns in one.
Looking for a long term swing with some day trades in between.
Overall target 🎯0.93555

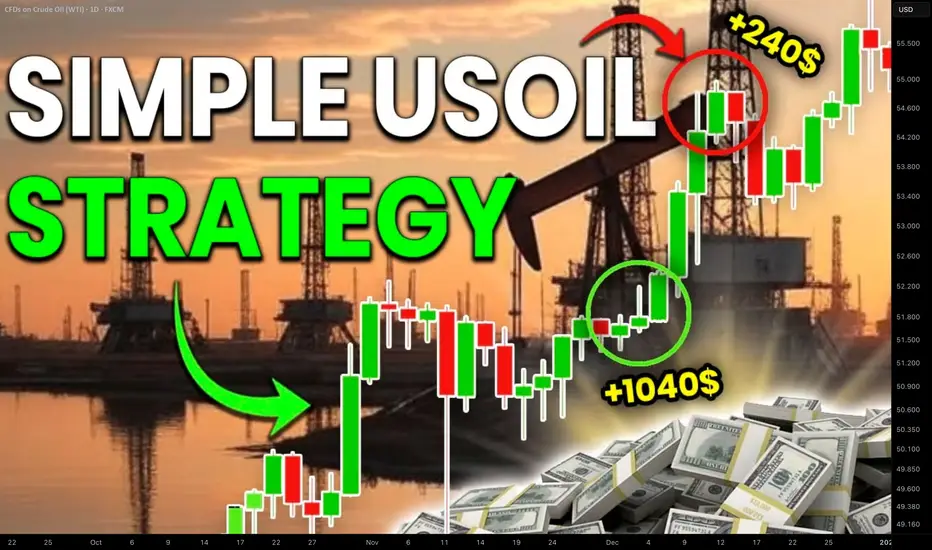
How to Trade Crude Oil with Smart Money Concepts SMC Explained
Smart Money Concepts is one of the most reliable techniques for trading WTI Crude Oil.
In this article, I will teach you a profitable SMC strategy for analysing and trading USOIL futures and CFD.
This simple strategy is based on an important event every SMC trader should know - a break of structure BoS.
In a bullish trend, the best break of structure will be based on a violation and a candle close above a current higher high.
It will signify a highly probable bullish continuation and provides a great opportunity to buy
Though you can spot a bullish break of structure on any time frame, the most reliable one is a daily.
After a formation of a new high, I suggest waiting for a short term intraday correctional movement.
With a high probability, the market will retest a recently broken structure and smart money will manipulate the market, pushing the price below that, making buyers close their positions.
Once the market starts retracing, analyze an hourly time frame. The price will need to establish an i ntraday minor bearish trend.
In this bearish trend, 2 trend lines should connect lower highs and lower lows composing an expanding, parallel or contracting channel - a bullish flag pattern.
Your best signal will be a breakout of a resistance line of the flag and a violation of the level of the last lower high - a bullish change of character of a liquidity grab.
It will confirm a completion of a correction.
Buy the market on a retest of the level of the last higher low, it will be your best entry.
Set your stop loss at least below a trend line and aim at the next strong daily resistance.
That will be a perfect model for trading break of structure on WTI Crude Oil.
We spotted such a setup in my trading academy on one of the live streams with my students.
WTI Crude Oil was trading in an uptrend on a daily time frame.
A bullish violation of the last Higher High and a candle close above that confirmed a Break of Structure BoS.
The price started a correctional movement then, and we spotted a bullish flag pattern on an hourly time frame.
The market completed a correction after grabbing a liquidity below a broken structure.
A bullish movement started then, and the price violated a resistance line of the flag and the level of the last lower high.
These 2 breakouts confirmed a completion of a correction and a resumption of a bullish trend.
We opened a buy position immediately on a retest of a broken level of the last lower high.
Stop loss was below a trend line, take profit was based on the closest key daily resistance.
And the price went straight to the target.
Break of Structure BoS will be useful for analysis, forecasting and trading WTI Crude Oil.
Combining that with top-down analysis and lower time frames confirmations will provide accurate signals and profitable trading setups.
Integrate a price model that I shared in your strategy, and good luck to you trading USOIL!
❤️Please, support my work with like, thank you!❤️
I am part of Trade Nation's Influencer program and receive a monthly fee for using their TradingView charts in my analysis.
OPEN | This Will Rip MUCH Higher | LONGOpendoor Technologies, Inc. engages in the operation of buying, selling, and trading of residential properties online. The company was founded by Eric Wu on December 30, 2013, and is headquartered in Tempe, AZ.

BITCOIN Weekly line charttells a story of 4 discernible patterns and 4 log targets.
1) The inverse head & shoulders to end the bear market
2) A broadening rising flag .... which at the time, many thought it was head and shoulder's top on the candle chart.
3) A small sideways flag
4) and the current frustrating broadening descending bull flag. Which has cause much grief to participants but will likely gives an explosive quick large moves.
As you can see putting the chart can help in identifying trends.. key highs and lows and also gives patterns that may not be visible on a candle chart.
Another tool in your toolbox.

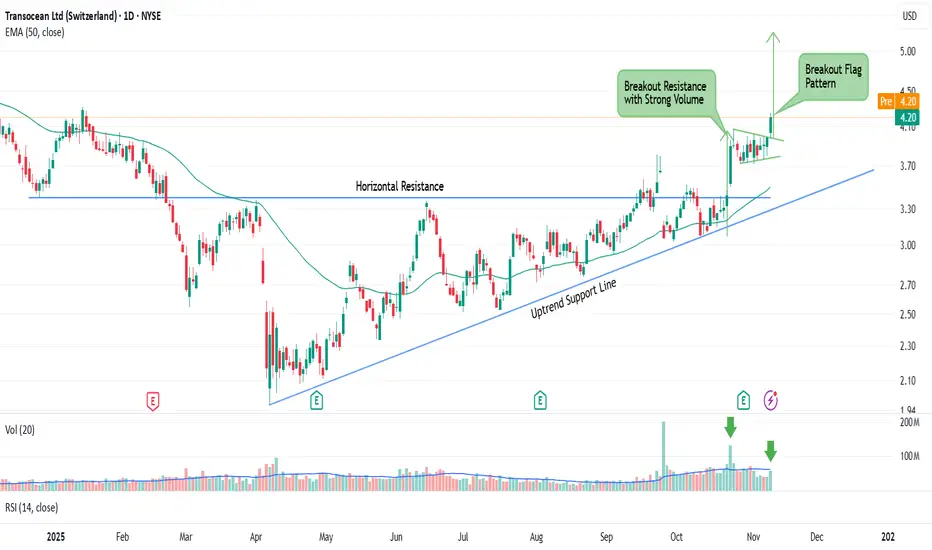
Transocean Ltd (RIG) – Bullish BreakoutSummary:
RIG has broken out of long consolidation and strong resistance at 3.40 with high volume , showing strong buyer interest.
After the breakout, price pulled back and formed a flag pattern , then broke out again yesterday , confirming bullish continuation .
Trading Plan:
Entry: 4.20
Support: 3.72
Target: 5.20
$WLFI 4H$WLFI 4H Analysis
A clear Bull Flag formation is developing after a strong impulsive move +35%.
The price is consolidating inside a descending channel, showing a healthy correction before the next potential leg up.
Breakout Zone: $0.156–$0.158
T1: $0.1762
T2: $0.1862
T3: $0.1950
Invalidation: Below $0.1483 (break of flag support)
If the breakout confirms with volume, we could see continuation toward the $0.19–$0.20 area, completing the flag projection.
#WLFI #BullFlag #Altcoins #WorldLibertyFi


GBPJPY | Flag Breakout in Focus – Eyeing 207.00–209.00Technical Lens:
GBPJPY continues to trade within a well-defined ascending channel, with recent consolidation forming a clean flag pattern following the prior impulsive advance. Price is now pressing against the upper boundary of that flag near 204.00, hinting that momentum may be building for a breakout.
Scenarios:
If price breaks above the flag resistance and confirms, the next technical targets sit around 207.00–209.00 — aligning with the upper bound of the broader channel and key Fibonacci projections.
If rejection occurs at current levels, a pullback toward 201.50–202.00 could see the lower flag boundary retested before any continuation attempt.
Takeaway:
GBPJPY remains in a constructive structure within its ascending channel. A confirmed breakout above the flag could see the pair extend toward 207.00–209.00, where the next resistance cluster awaits.

Bitcoin Recovery Setup: BTC Price Rebound Signal & Trade IdeaHey traders.
Short update for BTC and next movement.
Basically we moving in the bullish flag and according to some signals most-likely we going to see BTC going to the top of this channel.
Few reasons:
1) RSI crossed and confirmed (red circle marked)
2) Recovery of the whole market
Points to watch:
1) Low volumes - seems like we not going to break much this flag range (be careful)
2) Money can flow to altcoins - so BTC going to flat
If you want to trade, set up TP at the price around orange line and follow RM.
Share your insights in the comments

20% upside trade idea1) price channel
2) higher highs , higher lows on lower timefram
3) more volumes on up candles , less volumes of down candles .
4) out of horizontal consolidation
5) cup and handle type of appearance on diff timeframes.
keeping it short and sweet .. may be you can envision this
thanking you

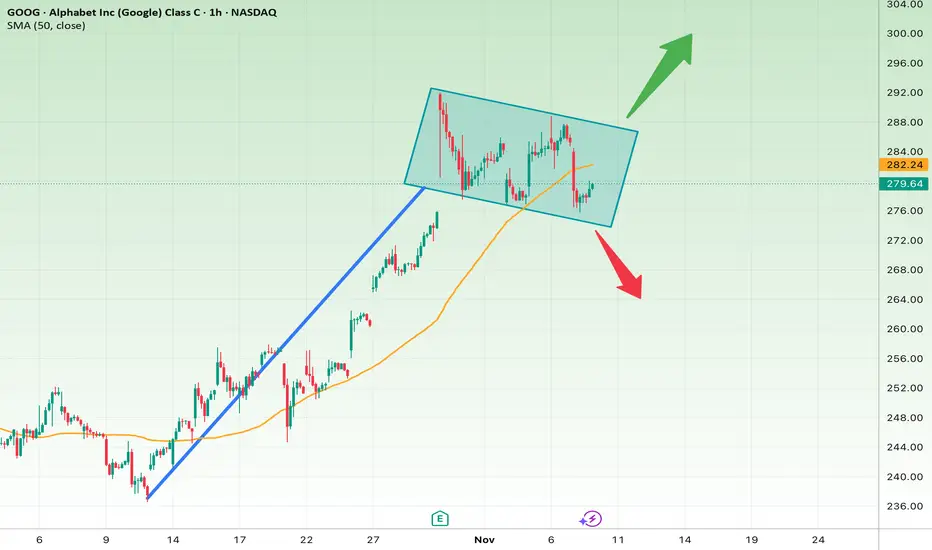
Google at a Critical Decision Point
Short-Term Analysis (1–7 days):
• The stock has entered a neutral channel, currently oscillating between $276 and $288.
• A breakout above the channel’s upper boundary would indicate a continuation of the short-term uptrend.
• Short-term upside target: around $295
• Short-term stop-loss: below $275
Long-Term Analysis (weeks to months):
• The long-term trend remains bullish, with the 50-hour moving average providing support.
• If the neutral channel breaks upward, a strong continuation toward around $310 is possible.
• If it breaks downward, a decline toward $265 is likely.
Summary:
Google stock is in a key decision-making range. Close monitoring is required in the short term, as a breakout from the channel will determine the long-term direction.