Post-Fed Breakdown: 25 bps Rate Cut + QE Restart = Risk-On Fuel Post-Fed Breakdown: 25 bps Rate Cut + QE Restart = Risk-On Fuel
The FOMC just delivered exactly what risk assets wanted:
25 bps rate cut
Restart of QE with $40B/month in Treasury purchases
This is the liquidity cocktail that historically lights up small caps, high beta, and speculative momentum stocks. The liquidity train is rolling again.
🔹 What This Means for Markets:
QE = immediate expansion of liquidity in the system
Lower rates = easier credit + higher equity multiples
Small caps ( AMEX:IWM ) historically outperform in the early QE phase
High beta + speculative names tend to catch the strongest flows
This is the exact macro environment where markets rip even if fundamentals are messy.
🔹 What I’m Watching:
1️⃣ AMEX:IWM – Small Caps
If we get a retest in AMEX:IWM , I’ll be looking to buy calls.
These QE environments are where the Russell 2000 becomes a rocket ship.
2️⃣ Momentum Leaders:
NASDAQ:WULF – Strong relative strength, liquidity-sensitive, crypto-adjacent.
NASDAQ:EOSE – A pure rate-sensitive, high beta energy storage play.
Both names should catch strong speculative flows if the market confirms.
3️⃣ The QE Effect:
When the Fed buys Treasurys, liquidity bleeds into every corner of the market.
Historically, QE ignites multi-week rallies in:
Small caps
High-beta tech
Energy storage
Crypto-adjacent equities
Meme/spec cycles
🔹 My Game Plan:
Wait for clean setups — don’t chase the first candle.
Look for IWM dips, not spikes.
Keep NASDAQ:WULF and NASDAQ:EOSE on top of the momentum list.
Align trades with liquidity — don’t fade QE.
The liquidity faucet is turning back on. This is where swing traders make their year.
FOMC

Gold Breakout Bull Pennant #3It's been another strong year for gold and with President Trump set to name a dovish successor to the Fed Chair post, the door can very much be open to more topside provided one very major factor doesn't become a problem, and that's inflation.
Gold broke out from bull pennant #3 around the news that Trump would name Kevin Hassett as the next Fed Chair. Bond markets didn't seem to rejoice in that news as Treasury yields pushed up after that circulated, which is probably one reason Trump has softened from the stance where he previously said he already knew who he would name, down to the current stance of one of the two Kevins (Kevin Warsh, being the other).
Hassett has history as an uber-dove and this is even under Democrat administrations. In an article for AEI published in 1999, he seemingly called out Alan Greenspan for the threat of raising interest rates to pop the internet bubble. That article was released on September 3rd of 1999, so about six months before stocks had topped; but the Fed also hiked a handful of times between the two occurrences with a 50 bp hike in May of 2000, after equities had already set their high (we didn't know that at the time, however).
As we go into 2026, it seems that whoever Trump names next Fed Chair rate cuts will be involved, as he's already said a willingness to cut rates is a 'litmus test' for who he ultimately nominates to lead the bank. He's also said that he would like to see rates go below 1%, which would push the dovish drive from the FOMC into another gear, and unless inflation becomes a problem, this could further drive the rally in equities and metals that have taken hold over the past couple of years.
For gold, the next week of data could set up opportunity as the metal has already broken out from the third bull pennant formation that I had highlighted in these posts in late-November. There's now support potential at 4245, 4161 and 4046, each of which can make the case for a higher-low above the pullback below 4k. - js

15/12/25 Weekly OutlookLast weeks high: $94,590.52
Last weeks low: $87,581.21
Midpoint: $91,085.87
A volatile yet directionless FOMC week comes to a close and a new week begins. As forecast the Fed cuts interest rates by 25bps, now at 3.75% (a 3-year low). Bitcoin reacted to the news with LTF volatility but in the end no direction as this cut had been forecast and priced in.
The weekly clearly capping any bullish move, multiple rejections from $94,500 with higher lows compressing price. Historically this compression pattern leads to an impulse move in a given direction. given what we have seen around the weekly high, if price cannot flip this level ($94,500) a continuation of the downtrend may be next as the bears are looking stronger as it stands. My key levels to look for are $84,000, $80,000 and $74,000. Should the weekly high be flipped and reclaimed $100,000 is the major test of resistance.
I am not sure if this week is too early to get our answer but I am planning for what the chart tells me. Until we get a confirmation on HTF direction the range is clear on the LTF.

10-Year Treasuries Into FOMC: What to Expect1. Big Picture: What’s Been Driving Bonds?
Over the past several months, the U.S. Treasury market has been defined by diverging forces across the curve, the short end (2Y, 5Y) pricing near-term monetary policy outcomes and the long end (10Y, 30Y) reflecting inflation persistence, fiscal supply, and long-horizon term premium.
The short end has behaved like a proxy for rate-cut expectations, compressing aggressively whenever inflation cools or recession probability ticks higher. Meanwhile, the long end has been more sensitive to duration demand, bond auctions, and forward-looking macro risk, often moving independently when supply shocks or inflation surprises hit the tape.
The result? A curve driven by two narratives: policy timing vs long-run risk.
This sets the stage for next week’s meeting and the reaction likely depends less on the cut itself and more on the messaging around rate trajectory.
2. What did the Market do?
Following the U.S.–China tariff escalation in April (formerly referred to casually as the “Trump Tariff War,” though a better description is the Tariff Re-Escalation Phase), the ZN stabilized. Buyers stepped in between May to July 2025, compressing price toward the 112'08'0 region, which is a key daily resistance zone.
In early September, momentum shifted. Buyers overwhelmed offers and lifted prices through 112'08'0, and the move appears linked to expectations of a softer policy stance and improving forward inflation indicators during the first week of September.
Sellers responded at 113'07'0 area and market has been trapped in a three-month range between 113'25'0 high and 112'08'0 low.
This week, price rotated from the top of range and swept through the composite LVN 113'00'0 to 112'24'0, near the 1st 3 weeks of November composite VPOC.
3. What to Expect: Scenarios Into FOMC Week
Until the rate decision, compression seems likely.
Expect 2 way indecision before FOMC:
Expect two-way trade between 113'03'0 (LVN) and 112'24'0 (1st 3 weeks of Nov composite VPOC) as the market waits for the FOMC.
Bearish Scenario (Base case):
If sellers hold at 113'03'0, continuation lower toward 112'07'0 (range low / composite VAL)
Bullish Scenario:
If buyers reclaim 113'03'0 decisively, possible market move back up to 113'23'0 (Daily Range high), keeping the multi-month balance intact and potentially positioning for a breakout if FOMC guidance surprises dovish.
4. FOMC Risk: What Could Surprise the Market?
The market is currently pricing ~88.6% probability of a 25bps cut which means the cut itself is not the event. The surprise lies in the tone.
🟢 Bullish Bond Reaction (Yields lower) if:
Forward guidance hints at a sequence of cuts, not a one-off
Growth risks emphasized > inflation risks
Dovish dissent or language suggesting easing bias remains intact
🔴 Bearish Bond Reaction (Yields higher) if:
The Fed downplays future cuts or signals higher-for-longer
Inflation risk is prioritized
Dot-plot or press Q&A implies only one cut on table
Conclusion
Unless the press conference delivers a clear dovish or hawkish surprise, expect a similar indecisive, two-way response in the markets, similar to past FOMC market reactions.
What’s your call on ZN and the bond markets going into the week of FOMC? Drop a comment and give a boost so more traders can weigh in.
Disclaimer: This is not financial advice. Analysis is for educational purposes only; trade your own plan and manage risk.

XAU/USD | Gold Awaits FOMC and Powell to Set the Next Big Move!By analyzing the #Gold chart on the 4 hour timeframe, we can see that price is still moving sideways inside the same range and has not chosen a clear direction yet. Even so, the previous analysis played out and gold dropped about 350 pips before bouncing back to the 4220 supply zone, where it got rejected again. Right now gold is trading around 4197.
Today’s interest rate decision and Powell’s speech will decide the next major trend.
If Powell sounds Hawkish, we could see a heavy drop in gold.
If he sounds Dovish, gold may push toward levels above 4300.
Keep an eye on the demand zones at 4157 to 4169 and 4130 to 4145, and the supply zones at 4225, 4233, and 4241 to 4259. This analysis will be updated soon.
Please support me with your likes and comments to motivate me to share more analysis with you and share your opinion about the possible trend of this chart with me !
Best Regards , Arman Shaban

Dow Jones: Potential Explosive Move!Hey Traders,
In today's trading session we are monitoring US30 (Dow Jones) for a buying opportunity around the 48,400 zone. The index is trading in a strong uptrend and is currently in a correction phase, approaching the trend area at 48,400 support and resistance.
Trade safe,
Joe.

Fed Just Opened the Door — USDJPY Could Bleed Hard!!Hey Traders, in today’s session we are monitoring USDJPY for a selling opportunity around the 156.300 zone. The pair continues to trade within a broader downtrend, and price is now retracing toward a key trend + S/R confluence at 156.300 — an area that has consistently acted as a supply zone for sellers.
Technical Structure
USDJPY remains in a bearish market structure (lower highs / lower lows).
Current pullback is approaching the 156.300 correction zone, where downside continuation becomes highly probable.
Dollar Macro Backdrop: Perfect Storm for USD Weakness
On the other side, DXY broke below its uptrend and is now pulling back toward the 98.800 retracement zone, confirming a broader shift in momentum.
The fundamentals are even more compelling:
1. The Fed did cut yesterday — 25bps.
This reinforces a clear dovish turn, and historically the USD underperforms aggressively in the weeks following the first cut of a new cycle.
2. The Fed's balance sheet is expanding again.
An expanding balance sheet = USD bearish liquidity environment.
3. The January FOMC is currently NOT priced for a cut — and that’s the opportunity.
The market is underpricing the risk of back-to-back cuts.
Now labor market data becomes the main catalyst.
And the reality is:
If we get any sign of further labor market weakness — which is increasingly likely — the market will start pricing in a January cut very fast.
And that leaves MUCH more room for USD weakness across the board.
Trade Focus
Monitoring price reaction at 156.300 for a bearish continuation setup.
If DXY resumes weakness out of 98.800 and labor data disappoints, USDJPY could accelerate aggressively to the downside.
Trade safe,
Joe.

1210: EURUSD: Mid-Long Term Trading Opportunity This WeekHello traders,
For EURUSD, the 4-hour chart shows a flag correction pattern (bullish continuation setup) consolidating near key support—anchored at the 0.618 Fib retracement level (~1.16100)—following a prior uptrend. This structure signals potential upside, but we’ll avoid pre-FOMC positioning: we’ll trade the post-FOMC reaction instead of pre-empting the Fed’s tone.
This week’s FOMC meeting is the catalyst: After the policy announcement (and press conference), we’ll watch for clear confirmation signals to enter a mid-long term bullish trade:
Trigger: A decisive breakout above the flag’s resistance (near 1.16400) post-FOMC (paired with bullish candlestick confirmation, e.g., a daily close above this level).
Targets:
TP1: 1.17390 (Fib level + prior swing high, 1.29% upside from entry)
TP2: 1.17700+ (extended bullish continuation)
Stop-Loss: Below the flag’s recent low (1.15700) to cap downside risk.
By waiting for post-FOMC price action, we avoid the volatility of pre-meeting speculation and trade only when the market’s reaction validates the bullish setup.
GOOD LUCK!
LESS IS MORE!

YM1! DOW JONES E-MINI FUTURES - THE POST-FED BLUEPRINTDecember 10, 2025 | by officialjackofalltrades
🟢 BULLISH | Fed's "Hawkish Cut" Creates Opportunity
EXECUTIVE SUMMARY - THE FED DECISION IS IN
Current Price: $47,913 | Date: December 10, 2025 - POST-FOMC
The Dow Jones E-mini futures just experienced a historic moment :
The Dow gained 497.46 points, or 1.1%, to close at 48,057.75 following the Federal Reserve's decision to lower rates by a quarter percentage point, putting it in a range between 3.5%-3.75%.
But here's what NOBODY is talking about: This was a "hawkish cut" with three "no" votes, which hasn't happened since September 2019. Yet the market RALLIED .
Why? Because the "hawkish" part was already priced in.
The Technical Setup:
Pattern: Ascending channel (intact since November)
Current Position: Testing mid-channel at 47,700-47,800
Resistance: 48,100-48,300 (upper channel boundary)
Support: 46,800-47,00 (mid-channel), 46,500-46,100 (lower channel)
Breakout Target: 48,000-48,500
The Fed Backdrop:
Powell said "We are well positioned to wait and see how the economy evolves"
Translation? The Fed is DONE cutting for now.
But here's the twist: Fed funds futures suggest around a 68% chance the central bank will cut rates two or more times in 2026. The market doesn't believe Powell!
The Trade: Long from 47,700-48,300, target 48,000+
🔎 MARKET CONTEXT - THE FED'S "HAWKISH CUT" PARADOX
What Just Happened (Last 6 Hours)
At 2:00 PM ET today, the Fed delivered exactly what was expected: 25-basis-point reduction from 3.75-4% to 3.50-3.75%.
But the details were hawkish:
Three dissenting votes (Cleveland Fed President Beth Hammack voted against, plus two others)
Dot plot indicated just one more cut in 2026 and another in 2027
Seven officials indicated they want NO cuts next year
Powell called it a "very challenging situation"
The Market's Response?
Dow jumped 497.46 points (+1.1%) to 48,057.75. Why rally on hawkish news?
Answer: Because the hawkish tone was already priced in from the pre-meeting leaks and October's dissenting votes. The market expected worse .
The Internal Fed War
Asked about the elevated level of dissenting members, Powell emphasized that everyone on the FOMC agrees that inflation is still too high, and that there are also risks to economic growth.
This Fed is more divided than any time in recent memory :
Hawks (7 members): Want ZERO cuts in 2026
Centrists (5 members): Want 1-2 cuts in 2026
Doves (7 members): Want 2-3 cuts in 2026
19 participants among the governors and regional presidents, 12 of whom vote.
This division means volatility , but also opportunity .
TECHNICAL ANALYSIS - THE ASCENDING CHANNEL AT DECISION POINT
The Pattern: Ascending Channel (Bullish Structure)
Your chart shows a textbook ascending channel that's been in play since early November 2025.
Channel Characteristics:
Lower Support: Started at 44,000 (early Nov) → 46,500 (mid-Nov) → 47,000
Current Position: Dow closed at 48,057.75, which is mid-channel perfect positioning for next leg up.
Technical Indicators:
Moving Averages:
50-day MA: ~46,800 (rising, bullish)
200-day MA: ~45,200 (rising, bullish)
Golden Cross: Active since mid-October = long-term bullish
Volume:
Dow jumped on Wednesday after Fed decision with significant volume, this confirms the breakout is real , not a fake pump.
RSI:
Current: ~58-62 (slightly bullish but not overbought)
Room to run to 70+ before overbought conditions
🎯 SCENARIO ANALYSIS - WHAT HAPPENS NEXT
BASE CASE: Grind Higher to 48,000+ - BULLISH
What Happens:
Dow consolidates 48,000-48,400 for 2-3 days
Then breaks above 48,600 with volume
Grinds higher toward 49,000-49,500
Powell's "wait and see" stance removes uncertainty
Holiday buying + year-end window dressing pushes higher
Timeline: 2-3 weeks (by end of December)
Expected Return: +3-4% from 48,000 to 49,500-50,000
Catalysts:
Continued corporate buybacks
Holiday retail strength
Year-end fund rebalancing (institutional buying)
No negative Fed surprises (Powell on "pause")
BULL CASE: Breakout to 50,500+ - VERY BULLISH
What Happens:
Market doesn't believe Powell - 68% chance of 2+ cuts in 2026
Strong economic data (retail sales, employment) supports growth
Dow breaks 49,500 with conviction
FOMO kicks in, target 50,500-51,000
Timeline: 3-4 weeks (by early January)
Expected Return: +5-6% from 48,000
Catalysts:
Q4 earnings beat expectations
Strong holiday retail numbers
Dovish Fed speakers in January
International capital flows into US equities
BEAR CASE : Channel Break to 46,500 - BEARISH
What Happens:
Economic data deteriorates (unemployment spikes)
Earnings disappoint in early Q4 reporting
Geopolitical shock (unlikely but possible)
Dow breaks below 47,400, tests 46,500-47,000
Timeline: 1-2 weeks
Expected Return: -3-4% from 48,000
This is LOW probability given Fed just cut and Powell said "well positioned to wait."
📊 FUNDAMENTAL ANALYSIS - WHY DOW OUTPERFORMS
CATALYST #1: The Fed's "Hawkish Cut" Was Actually Dovish
Let me explain the paradox:
Hawkish Elements:
Three dissenting votes
Dot plot shows only 1 cut in 2026
Powell says "wait and see"
But Dovish Reality:
They STILL cut rates (3rd in a row!)
GDP forecast raised to 2.5% for 2025 and 2.3% for 2026
Unemployment expectations unchanged at 4.5% for 2025
68% market probability of 2+ cuts in 2026 means market doesn't believe the hawkish talk
Net Effect: Lower rates NOW + no immediate threat of hikes = bullish for stocks .
CATALYST #2: Corporate Earnings Remain Strong
GE Vernova jumped 8% after saying 2025 revenue trending toward higher end of guidance and doubled quarterly dividend.
This is indicative of broader Dow strength:
Industrial companies benefiting from infrastructure spending
Dividend increases signal confidence
Guidance raises = earnings momentum
CATALYST #3: Small Caps Leading (Risk-On)
Russell 2000 jumped to new all-time highs as lower interest rates benefit smaller firms that need to refinance debt.
When small caps outperform, it's a risk-on signal . Dow industrials benefit from this environment.
CATALYST #4: Year-End Window Dressing
Fund managers underperformed in 2025. In December, they buy winners to make their portfolios look good for year-end reports.
Dow = full of winners like UnitedHealth, Goldman Sachs, Boeing (recovery story).
⚠️ RISK FACTORS - THE BEAR CASE
RISK #1: The Fed Is More Hawkish Than Market Believes
Seven officials indicated they want NO cuts next year
If the Fed actually holds rates at 3.5-3.75% all of 2026, stocks could stall or correct 5-8%.
RISK #2: Channel Break Below 47,000
If Dow closes below 47,000 on daily chart, the ascending channel is broken . Next support: 46,000-46,500 (-4-5%).
RISK #3: Economic Data Deteriorates
Unemployment at 4.5% is manageable, but rising. If it spikes to 5%+, recession fears return.
RISK #4: Geopolitical Shock
US Coast Guard seized sanctioned crude tanker off Venezuela. Tensions with Venezuela/Russia could spike oil prices, hurting economy.
Entry Confirmation Checklist:
Before entering, CHECK:
✅ Price holding above 47,800 (support intact)
✅ Volume on bounce (>50K contracts on daily)
✅ No negative Fed speakers this week
✅ S&P 500 also bouncing (correlation check)
✅ VIX declining below 15 (fear subsiding)
✅ Treasury yields stable or declining
WAIT FOR 4/6 CONFIRMATIONS
THE BOTTOM LINE
Here's what I KNOW on December 10, 2025 (POST-FED):
✅ Dow rallied +497 points (+1.1%) post-Fed to 48,057
✅ Fed cut 25bps as expected to 3.5-3.75%
✅ Powell says "well positioned to wait and see"
✅ Market pricing 68% chance of 2+ cuts in 2026
✅ Ascending channel intact since November
✅ Your technical analysis shows clear support/resistance
Here's what I DON'T know:
Will economic data support more cuts?
Will earnings season (Jan) beat or miss?
Will geopolitical risks escalate?
📍 Follow officialjackofalltrades for post-FOMC analysis, institutional setups, and professional risk management.
Drop a 📊 if you're trading the post-Fed bounce.
Drop a 🎯 if this helped your YM1! setup.
Drop a 💰 if you're ready for 50K Dow.

Gold (XAU/USD) — pre-FOMC technical + fundamental setupOn the 15-min chart we see repeated rejections off the same resistance zone horizontal supply + a down sloping trendline. Each attempt has failed so far. That suggests bearish bias in the short-term.
The current structure supports a potential drop toward ~ 4160 (support zone), assuming gold remains under the resistance trendline.
~ Key wildcard: tonight’s FOMC decision. Markets are pricing in a 25 bps rate cut with high probability. If the Fed cuts and delivers dovish guidance, gold could rally possibly invalidating the bearish setup.
✅ But if the Fed cuts while signalling a cautious stance or a pause in easing, the dollar/yields could bounce reinforcing gold’s bearish technical structure and likely triggering the projected move down toward ~ 4160.
PLAN A (base case): Stay short under resistance, target ~ 4160.
PLAN B (if FOMC surprises dovish): Watch for break above trendline on breakout, avoid new shorts; consider potential longs if follow-through appears (momentum + candle confirmation).
Fundamental lens: Gold is inherently sensitive to real interest rates and Fed policy. Dovish Fed = bullish for non-yielding safe-havens like gold; hawkish/dovishmpause tone = bearish or consolidative. Given mixed US data and sticky risk sentiment, the post-FOMC reaction could be swift and volatile.
consider waiting for the post-announcement move rather than pre-loading a large position. Use tight risk control (stop-loss above resistance if short; if buying after a break, wait for retest + confirmation).

SHORT ON US30Us30 has created a head and shoulder pattern at a major supply area/zone.
FOMC is coming out in a few minutes and this could be a major catalyst to US30 falling.
Strictly going off technical's with the chart. Looking to make 1k-2k points.

US500: The J-WOW-POWOW — Anatomy of an FOMC ShakeoutThe Market's Breath
The air is thick with anticipation. We stand 90 minutes away from the FOMC decision. The consensus? Rate cuts. The retail sentiment? Euphoria. But the Limitless Trader knows that when the crowd looks up, the smart money is often preparing to pull the rug.
This is what I call the J-WOW-POWOW. A double-edged sword of volatility designed to transfer wealth from the impatient to the strategic.
The Philosophy: Buy the Rumor, Sell the News
Why would the market dump on good news? Because, quite simply, it is already priced in. The charts have been whispering this bullish thesis for weeks. Now that the confirmation is here, it is time for profit-taking.
Let the institutions speak as to where the price will go eventually.
The Setup: The Shakeout & The Reload
We are looking at a classic "Flush and Rush" scenario.
The Short (The Flush): As the news hits, we expect an initial liquidity grab. We are eyeing a rejection around the 6850 region. This is where the bag holders are created—buying the breakout that isn't real.
The Target: We anticipate a swift move down to test the 6670 zone. This is the "shakeout"—clearing the board of weak hands.
The Long (The Reload): Once the dust settles and the tourists have left the casino, we look for the real move. Support at 6670 offers a pristine entry to ride the trend back up toward 6930.
Technical Parameters (Approximations):
Short Play:
Entry: ~6850
Stop Loss: 6930
Take Profit: 6670
Long Play:
Entry: ~6670
Stop Loss: 6585
Take Profit: 6930
I am not your mother or your father. Sit on the sidelines and watch the show, or engage the market with discipline. The choice, and responsibility, is as always, yours.
LET ME EMPHASIZE AGAIN! THIS IS FOR YOU TO EDUCATE YOURSELF. I NEVER COPY TRADE. WHEN YOU COPY TRADE, YOU LACK THE CONVICTION, THE EXPERIENCE, AND THE KNOW-HOW ON MANAGING AN ACTIVE TRADE. NO ONE WILL BE HOLDING YOUR HAND WHILE YOU TRADE.
Disclaimer: This is not financial advice. It is for educational and informational purposes only. Please conduct your own research and manage your risk accordingly.

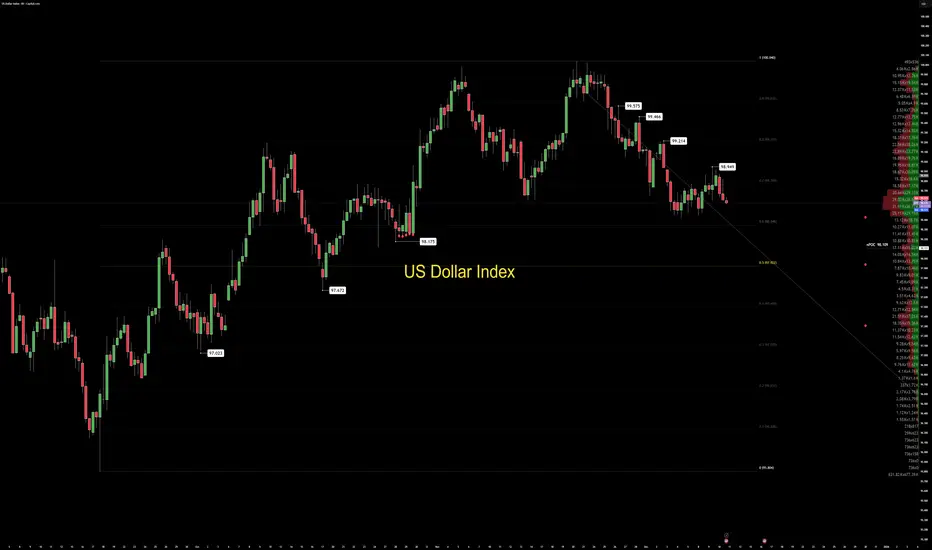
THE DAILY DOLLAR UPDATE — FOMC VOLATILITY WINDOWThe U.S. Dollar enters today’s session under a clear volatility regime. FOMC sits at the center of the macro landscape, and the market is positioning early.
The dominant behavior is not directional aggression. It is information gathering. The Dollar is being pushed toward the weekly discount zone near 98.175, where a known liquidity pool sits. This is not organic weakness — it is deliberate positioning.
Order flow confirms this intent. Absorption shows up consistently at the .6–.7 Fibonacci bands, indicating institutions are unloading inventory into premium while sentiment remains fragile. Retail sees a slowing trend. Professionals see asymmetric preparation around a major macro catalyst.
Market Structure (MSM)
Internal bearish structure remains intact. Selling continues to dominate the internal leg, and structure is guiding price toward the weekly discount zone. No bullish regime shift is confirmed, and the architecture remains clean on the higher timeframes.
Dynamic Geometry (DGM)
Despite bearish pressure, the Dollar still trades inside an overpriced bullish dynamic condition relative to the weekly and daily POVs. This creates geometric tension: structure wants discount, geometry remains stretched in premium. When those two conflict, liquidity usually resolves the argument.
Volume Flow (VFA)
The next major volume POC sits in the mid-range and aligns directly with the liquidity low. Participation is not accumulating at highs; it is preparing to rotate downward. Volume acceptance at lower prices would confirm this shift, but for now, the market is in transition.
Order Flow Dynamics (OFD)
Order flow today is absorbed at premium levels. Large participants are distributing into the upper bands rather than allocating fresh long exposure. Sweeps are small, deliberate, and designed to clear short-term positioning across both sides of the range.
Precision Execution (PEM)
The broader downtrend remains intact. Deviations stay negative. These are traditionally favorable conditions for Dollar sells and cross-market rotations into strength.
However, execution must respect the macro backdrop. FOMC, year-end flows, and reduced liquidity can distort intraday structure. Stops must sit behind higher-timeframe pivots. Patience is discipline in a news-driven environment.
Macro Calendar — United States
• FOMC Statement
• Fed Rate Decision
• Press Conference with Chair Powell
• High-volatility window expected pre- and post-announcement
CORE5 Identity Line
We do not react to movement. We interpret intention.
Takeaway
The Dollar is not collapsing; it is being positioned. FOMC will determine who read the behavior correctly.
— CORE5DAN
Institutional Logic. Modern Technology. Real Freedom.
Focus to Be on 2026 Projections at Today’s FOMCFOMC members meet to discuss rate cuts today. The market expects a 25 bps cut heavily despite some members' speeches against it. Powell is likely to convince members for a 25-point cut with minimum dissidents, but the 2026 rate outlook has started to become blurrier.
Employment data from ADP was weak, but jobless claims and JOLTS told a different story. Yes, there is weakness looming above the jobs market, but the strength of it is not too clear. The Fed has enough room for a couple of cuts, but too quick a move could risk near 3% inflation becoming even more entrenched. The Fed will walk on a thin line in 2026.
The September meeting's economic projections will be updated at today's meeting. The 2025 rate projection will be on target with today's probable 25 bps cut. For 2026, members wrote only one cut, and this will likely not change today to appease hawks to some degree. If it is revised to two cuts, this will be seen as dovish. The market was pricing three more cuts for 2026, but that fell to two in recent weeks. With Powell's term ending, more rate cut pressure will be on the Fed, so two or three cuts for 2026 is a good guess if inflation retreats below 2.5%. So far, PCE and core PCE projections written by members are 2.6% for each. Any update will be crucial to both inflation and unemployment. We think unemployment will be revised up in today's meeting.
Another thing to focus on will be the possible return of QE. Market liquidity problems still persist despite the end of the shutdown and QT. There is a chance that the FOMC will decide to ease this burden before it causes any damage to markets with relatively conservative treasury purchases..

BTC vs. The Fed: The "Neutral Coil" Before the ExplosionDescription: Today represents the collision of a massive macro catalyst (FOMC) and a technically "coiling" market. As professional traders, we do not gamble on the outcome of the speech; we identify the breakout levels that the speech will trigger.
1. The Macro Setup: Priced to Perfection According to the CME FedWatch Tool, the market has priced in an 89.6% probability of a rate cut.
The Trap: When certainty is this high, the "upside" of the news is often limited (priced in), while the downside risk of a "hawkish surprise" is violent. The market is leaning one way, which makes the reaction unpredictable.
2. The Technical Reality: Dead Neutral Replacing complex algorithms with standard, time-tested indicators reveals a market that is holding its breath.
RSI (14): Currently sitting at 48.45. This is effectively 50—dead neutral. Bulls and bears are in perfect equilibrium waiting for a trigger.
Bollinger Bands: Price is chopping directly on the 20 SMA (Middle Band). We are neither overbought nor oversold. We are in "fair value" territory, which is typically where trends go to pause before a volatility expansion.
ADX (Trend Strength): The ADX has dropped to 25, signaling that the previous directional trend has exhausted itself.
3. The Levels to Watch (The Trade) Because the technicals are neutral, we must wait for price to leave this "value zone" to confirm the winner.
Bullish Confirmation: We need a decisive Daily Close above the 0.382 Fib level ($97,600) and the upper resistance knot. Reclaiming this level opens the door to test the $100k psychological barrier.
Bearish Invalidation: If the Fed disappoints, watch the recent swing lows around $84,800. A loss of this support invalidates the recovery and exposes the lower Bollinger Band.
Summary: Do not front-run the Fed. The indicators (RSI 48, ADX 25) are telling us there is no trend right now. Wait for the volatility to break the range, then follow the momentum.
DISCLAIMER: Trading involves significant risk. This analysis is for educational purposes only and is not financial advice. Do your own due diligence.

XAUUSD Intraday Plan | Gold Holds Range Ahead of FOMCGold remains range-bound between 4219 and 4185, showing no clear commitment from buyers or sellers. A decisive breakout on either side will be needed to define the next intraday direction.
A break above 4219 would open the path toward 4251, and with strong momentum, potentially 4285.
However, if 4185 fails, price may drift back into the Support Zone. Should selling pressure increase, the HTF Support Zone may come into play as the next major area for buyers to respond.
📌Key levels to watch:
Resistance:
4219
4251
4285
Support:
4185
4144
4102
4049
4014
🔎Fundamental focus:
All eyes are on today’s FOMC decision — the key catalyst markets have been waiting for. Expect heightened volatility as traders react to the rate statement, projections, and Powell’s remarks.

NQ1! — Fed Week: 25,650 Inflection | Tight Decision📊 NQ1! NASDAQ 100 E-MINI FUTURES
December 9, 2025 | by officialjackofalltrades
🟡 CAUTIOUS |Fed Week Special Edition
EXECUTIVE SUMMARY - THE PRE-FED SETUP
Current Price: $25,651.50 | Date: December 9, 2025 | Change: -$48.25 (-0.19%)
The Nasdaq 100 E-mini futures are consolidating in a tight range between 25,000-26,300 as markets brace for tomorrow's Federal Reserve decision. After December E-mini Nasdaq futures rose +0.10% on Tuesday, the index is now sitting in a critical decision zone with massive implications for tech stocks.
The Technical Picture:
Pattern: Range-bound consolidation (4 weeks)
Current Position: Middle of range at 25,650
Resistance: 26,200-26,300 (tested multiple times, rejected)
Support: 24,700-24,900 (solid floor since November)
Key Level: 25,200 (bull/bear line)
The Fundamental Backdrop:
Big Tech was mixed at the close: Amazon booked a modest gain, while Apple, Meta and Microsoft finished slightly in the red. More importantly, These industry titans have consistently outpaced the broader S&P 500, with the S&P 500 Top 10 rising over 600% in total since January 1, 2016.
But here's the tension: AI capex coming from tech companies listed in the S&P 500 is $400 billion or more per year, going forward. The biggest AI company OpenAI has disclosed revenues of just $13 billion for 2025.
The Trade: Long from 25,200-25,600, target 26,500-27,200, stop 24,650. Risk/reward: 1:2.5 .
MARKET CONTEXT - WHAT'S REALLY HAPPENING
The Pre-Fed Paralysis
Stock indexes gave up early gains and settled mixed on Tuesday as bond yields climbed after the Oct JOLTS report showed job openings unexpectedly rose to a 5-month high.
This is classic pre-FOMC behavior : markets waiting for the catalyst before committing.
Investing.com - U.S. stock futures inch down ahead of the start of trading for December, with investors keeping tabs on a possible rate cut.
The AI Valuation Debate
Here's what's creating the consolidation: AI optimism vs. valuation concerns .
BULLISH CAMP:
Nvidia leads the tech sector with a market cap of $4.4 trillion
24/7 Wall St. forecast projects Nvidia revenue rising from $121 billion in 2025 to more than $265 billion by 2030
For the Mag 7 group, total earnings are expected to increase by +12.6% on +9.5% higher revenues in 2025
BEARISH CAMP:
OpenAI may have lost $12 billion in the third quarter of 2025 alone, according to a disclosure by Microsoft
806 Russell 2000 companies (40%) have no earnings or negative earnings
The revenues currently being generated by AI companies are far smaller than the amount of capex being directed at them
My Take: This is why NQ is stuck in range. Bulls see AI growth, bears see bubble. Fed decision tomorrow will tip the scale.
TECHNICAL ANALYSIS - THE RANGE-BOUND BATTLE
Pattern: Consolidation Rectangle (4 Weeks)
Your purple boxes perfectly capture the support/resistance clusters . Let me break down what the chart is telling us:
Key Technical Levels:
🔴 RESISTANCE (Selling Zones):
26,200-26,300: Tested 4 times since November, strong rejection zone
26,500-26,700: If we break above, this is next target
27,000-27,200: Extension target if Fed is dovish
🟢 SUPPORT (Buying Zones):
25,200-25,400: Minor support, current price zone
24,900-25,100: Major support cluster (your bottom purple box)
24,700-24,800: Absolute floor, tested Nov 19
24,300-24,500: Nuclear support if range breaks
Current Position: The Nasdaq 100 Futures price has ranged from 25,657.50 to 25,693.75 today extremely tight range showing indecision.
Technical Indicators:
Moving Averages:
50-day MA: ~25,400 (acting as support)
200-day MA: ~24,200 (long-term uptrend intact)
Golden Cross: Active since October = bullish
Volume:
The current trading volume for Nasdaq 100 Futures is 6,395 very low , typical pre-Fed paralysis.
RSI:
Currently: ~52-55 (neutral)
Not overbought (room to run)
Not oversold (no panic)
MACD:
Flat, coiling for breakout
Waiting for directional catalyst
SCENARIO ANALYSIS - THREE FED OUTCOMES
SCENARIO A: Dovish Cut (55% Probability) - BULLISH
What Happens:
Fed cuts 25bps ✓
Dot plot shows 3-4 more cuts in 2026 ✓
Powell emphasizes "labor market concerns" ✓
Tech gets green light to continue AI spending ✓
Market Reaction:
Immediate: NQ pumps 1.5-2% to 26,000-26,200
Day 1-3: Breakout above 26,300, test 26,700
Week 1-2: Rally to 27,000-27,500
Month 1: Target 27,800-28,200 (+9-10%)
Winners:
Nvidia (NVDA), AMD (AMD), Broadcom (AVGO) lead
Mag 7 outperform
High-growth tech rallies hard
Trade Setup:
Enter: Current 25,650 OR breakout above 26,300
Add: On pullback to 26,000 after breakout
Target: 27,500 (+7.2%)
Stop: 25,100 (-2.1%)
Risk/Reward: 1:3.4
SCENARIO B: Hawkish Cut (35% Probability) - CHOPPY
What Happens:
Fed cuts 25bps ✓
BUT dot plot shows only 1-2 cuts in 2026 ❌
Powell says "inflation still concerning" ❌
Tech valuations questioned ❌
Market Reaction:
Immediate: NQ drops 1-1.5% to 25,200-25,400
Day 1: Volatility, test 24,900 support
Week 1-2: Choppy recovery to 25,800-26,000
Month 1: Grind back to 26,200-26,500 (+2-3%)
Losers:
High-valuation AI stocks hit hard
Stocks with high capex vs. revenue scrutinized
Small caps underperform
Trade Setup:
DO NOT chase before Fed
Buy: Dip to 24,900-25,100 (support)
Target: 26,000-26,300 (+5-6% from dip)
Stop: 24,650 (-2%)
Risk/Reward: 1:2.5
SCENARIO C: No Cut OR Very Hawkish (10% Probability) - BEARISH
What Happens:
Fed HOLDS at 3.75-4% ❌
OR cuts but says "this is the last one" ❌
Powell cites AI bubble concerns ❌
Tech sell-off accelerates ❌
Market Reaction:
Immediate: NQ crashes 2-3% to 24,700-25,000
Day 1: VIX spikes, panic selling
Week 1-2: Test 24,300-24,500
Month 1: Bottom around 23,800-24,200 (-7-8%)
Trade Setup:
Exit ALL longs immediately
Wait for capitulation
Buy: 24,000-24,300 (major support)
Target: Recovery to 25,500-26,000 (+6-8%)
High stress, high reward
THE TRADE SETUP - PROFESSIONAL EXECUTION
🟢 PRIMARY LONG SETUP: BUY NQ1!
Entry Strategy (Scale In):
Option A: Conservative (Wait for Dip):
25,000-25,200 (IF hawkish dip)
24,800-25,000 (IF deeper dip to support)
Best for: Risk-averse traders
Stop Loss: 24,650 (HARD STOP)
Below 24,650 = range break on daily
Below this = technical structure invalidated
Max loss from 25,650 entry:
Take Profit Targets:
TP1: 26,200-26,500
Range breakout + resistance retest
Action: Take 40% profit, move stop to 25,200
Gain: +2.1-3.3% | Risk/Reward: 1:2
TP2: 27,000-27,500
Momentum continuation post-Fed
Technical indicators show Strong Buy signal
TP3: 27,800-28,200
Full breakout, AI optimism returns
Long-term forecast shows potential to $28,452
Entry Confirmation Checklist:
Before entering, CHECK:
✅ Price holding above 25,200 (bull/bear line)
✅ Volume spike on bounce (15K+ contracts on 4H)
✅ Fed announces 25bps cut (as expected)
✅ Powell's tone dovish or neutral (not hawkish)
✅ Mag 7 stocks holding up (NVDA, MSFT, AAPL)
✅ VIX below 16 (fear contained)
WAIT FOR 4/6 BEFORE FULL POSITION
Use Micro E-minis (MNQ) for Better Sizing:
MNQ = $2/point (vs NQ $20/point)
Same moves, 1/10th capital
Better for risk management
Fed Day Protocol (December 10):
2:00 PM ET - Fed Statement:
Tighten stops to 25,100 before announcement
READ statement immediately
Ignore first 5 minutes (algo chaos)
2:30 PM ET - Powell Press Conference:
WATCH LIVE - tone matters more than words
Dovish = add to position on dip
Hawkish = cut 50%, tight stops
5. Emergency Exits:
❌ Daily close below 24,650 = EXIT ALL
❌ VIX spikes above 22 = EXIT 50%
❌ Fed announces NO cut = EXIT ALL
❌ Powell says "last cut for 6+ months" = EXIT 50%
❌ Mag 7 stocks crash 3%+ = EXIT 50%
FUNDAMENTAL ANALYSIS - THE AI CONUNDRUM
CATALYST #1: The Magnificent 7 Dominance
Nvidia, Microsoft, and Apple make up 20.7% of the S&P 500 and 43.6% of the Vanguard Information Technology ETF.
This concentration means:
NQ lives or dies by Mag 7 performance
Fed policy directly impacts these valuations
Any weakness cascades fast
Current Status:
Nvidia: $4.37T market cap
Apple: $4.20T market cap
Microsoft: $4T+ market cap
CATALYST #2: The AI Spending Paradox
Here's the $400 billion question :
AI capex from S&P 500 tech companies is $400 billion or more per year. The biggest AI company OpenAI has disclosed revenues of just $13 billion for 2025.
The Math Doesn't Add Up:
Spending: $400B/year
Revenue: $13B/year
Gap: $387B/year of unprofitable spending
"Can the 10 AI companies generate enough revenue to justify the capex?"
says Torsten Sløk, chief economist at Apollo Global Management.
BUT: Nvidia revenue projected to rise from $121B in 2025 to $265B by 2030 revenue IS growing, just not fast enough yet.
CATALYST #3: Earnings Growth Remains Strong
Mag 7 earnings expected to increase +12.6% on +9.5% higher revenues in 2025.
Excluding the Mag 7, total earnings for remaining S&P 500 companies expected to grow +8.7% in 2025.
Translation: Even without AI hype, earnings are solid.
CATALYST #4: Fed Policy is CRITICAL
With U.S. 10-year Treasury yields hovering just above 4% and the Fed set to decide on a widely expected rate cut, growth stocks remain sensitive to even small changes in rate expectations.
Why This Matters:
Lower rates = higher valuations for growth
Higher rates = multiple compression
Tech has highest duration risk
RISK FACTORS - THE BEAR CASE
RISK #1: AI Bubble Concerns
Nvidia's Jensen Huang says he doesn't believe we're in an AI bubble. Amazon's Jeff Bezos says we probably are in one. OpenAI's Sam Altman has invoked a bubble, adding, "I do think some investors are likely to lose a lot of money".
Even AI leaders are split!
RISK #2: Valuation Stretched
OpenAI may have lost $12 billion in Q3 2025 alone, yet is valued at $500 billion by VCs.
If valuations reset, NQ drops 15-20%.
RISK #3: Concentration Risk
Since October 2022, roughly 75% of gains in S&P 500 have come from just seven stocks.
If Mag 7 stumbles, entire index falls .
RISK #4: Technical Breakdown
Break below 24,650 = target 23,800-24,200 (-6-7%)
THE BOTTOM LINE
Here's what I KNOW on December 9, 2025:
✅ Fed expected to cut 25bps tomorrow
✅ NQ technical indicators show Strong Buy
✅ Mag 7 earnings growing +12.6% in 2025
✅ NQ in consolidation range 25,000-26,300
✅ Support at 24,900 has held 4 times
✅ Your purple boxes show clear support/resistance
Here's what I DON'T know:
Will Powell be dovish or hawkish?
How many 2026 cuts will dot plot show?
Will AI bubble concerns accelerate?
But here's the MATH:
Risk: 25,650 → 24,650
Reward: 25,650 → 27,500
Extended: 25,650 → 28,200
The Play:
Small position NOW 25,650
IF hawkish dip to 24,900-25,100
IF dovish → ADD on breakout above 26,300
Stop 24,650
Target 27,500, then 28,200
Position accordingly.
Follow officialjackofalltrades for institutional-grade futures analysis, Fed-day strategies, and professional risk management.
Drop a 📊 if you're trading NQ through the Fed decision.
Drop a 🎯 if this analysis helped your setup.
Drop a 💰 if you're ready for 27,500+ breakout.
Disclaimer: This is not financial advice. This post is for educational and informational purposes only. Always do your own research and manage your own risk.

USD/JPY Falling Wedge Breakout Nears Next ResistanceLast week's pullback in USD/JPY remained rather clean, with a hold at prior resistance of 154.45-155.00. That zone was tested pretty much all week, with the top of that area coming into play on Monday and the bottom later in the week, but since, bulls have largely been in-charge to push the breakout from the falling wedge formation ahead of the FOMC rate decision.
Price is now nearing the next resistance zone from Fibonacci levels at 156.67-157.17, which are the 76.4 and 78.6% retracements from last year's sell-off. This was the zone that ultimately stalled the rally two weeks ago before the pullback showed up. This, of course, doesn't necessarily preclude continuation especially with some massive drivers on the horizon with FOMC on Wednesday and BoJ next week, but it does make for a more difficult case to chase.
If we do see some softening, rather ahead of FOMC or after, the 154.45-155.00 zone could be re-used provided that buyers can hold a higher-low above last week's swing low.
I'm still looking at the pair as one of the more attractive venues for USD-strength scenarios. - js

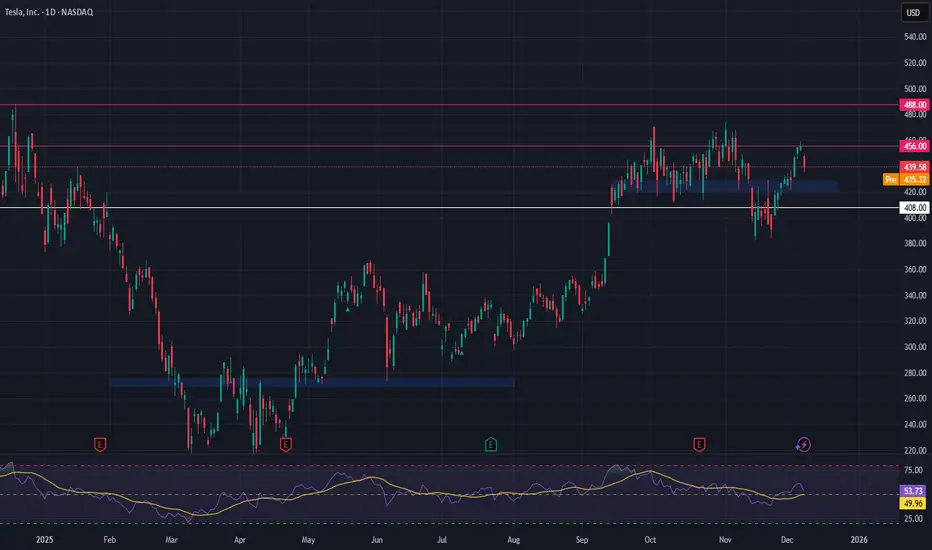
Tesla Rejected at Key Breakout — Bullish Structure Still Intact NASDAQ:TSLA just got rejected at a major breakout level, but the bigger picture remains bullish. Price action shows a healthy uptrend with momentum building, suggesting this could just be a pause before continuation. As volume trends higher on dips, it hints that buyers are still active—just waiting for cleaner levels.
📅 With the FOMC coming up, expect potential de-risking or volatility across markets. That could drag TSLA lower short term, but it also opens the door for a cleaner entry near strong support. Watching the $421–$428 range for signs of a bounce or consolidation.
🔽 Trade Plan
Entry Zone: $421 – $428
Take Profit 1: $456
Take Profit 2: $488
Stop Loss: $408
XAUUSD Set for Surge? Safe-Haven Demand and Fed Cut Bets AlignHey Traders,
In today’s session we are monitoring XAUUSD for a potential buying opportunity around the 4,200 zone. Gold remains in a strong uptrend, and the current correction is bringing price back toward the key 4,200 support–resistance area, which could offer a favorable entry.
Fundamentally, GOLD should continue to benefit from the ongoing weakening of the U.S. Dollar, driven by expectations of a 25bps rate cut. As we head into Wednesday’s FOMC, markets are likely to keep front-running the event, which typically pressures the dollar lower.
Just be cautious—if we see too much front-running, the classic “buy the rumor, sell the fact” reaction could hit once the decision is officially announced.
Additionally, rising geopolitical tensions between Venezuela and the United States are increasing safe-haven demand, which further supports upside for Gold.
Trade safe,
Joe.

USDCAD plunges as BOC vs Fed divergence grows! Can it continue?USDCAD has broken sharply lower following Canada's surprise jobs blowout on Friday, with the pair now pricing in a divergence: the Bank of Canada is expected to hold rates Wednesday, while the Fed is expected to cut.
Canada added 54,000 jobs in November, and the unemployment rate plunged to 6.5%, taking a BOC cut off the table. Meanwhile, the Fed is 90% priced to cut by 25bps on Wednesday, narrowing the rate differential and weakening the US dollar against the loonie.
Key drivers
Canada jobs report beat expectations with +54k positions (vs expected loss), unemployment fell to 6.5% from 6.9% — three straight months of gains totalling 181k jobs.
BOC decision this week virtually certain to hold at 2.25% after cutting in October and signalling the easing cycle is likely over.
Fed FOMC decision on Wednesday priced in at 90% odds for a 25bps cut to 3.75–4%, the third consecutive cut driven by cooling US labour and dovish Fed commentary.
Technical: USDCAD corrected to 50% Fibonacci (1.4140–60) of the 1.4790–1.3543 impulse leg and is now breaking down in a potential head and shoulders pattern with neckline at 1.3543.
Downside targets: 1.3370–1.3396 (61.8% extension + 50% retracement confluence), 1.3068 (61.8% retracement), and 1.2895 (100% extension full measured move).
Risk scenario: Neckline hold above 1.3543 could see bounce back toward 1.36 or 1.43, but below 1.4140, the path of least resistance is lower.
Are you trading the USDCAD breakdown? Share your head and shoulders setups in the comments and follow for more central bank divergence and technical trade ideas.
This content is not directed to residents of the EU or UK. Any opinions, news, research, analyses, prices or other information contained on this website is provided as general market commentary and does not constitute investment advice. ThinkMarkets will not accept liability for any loss or damage including, without limitation, to any loss of profit which may arise directly or indirectly from use of or reliance on such information.

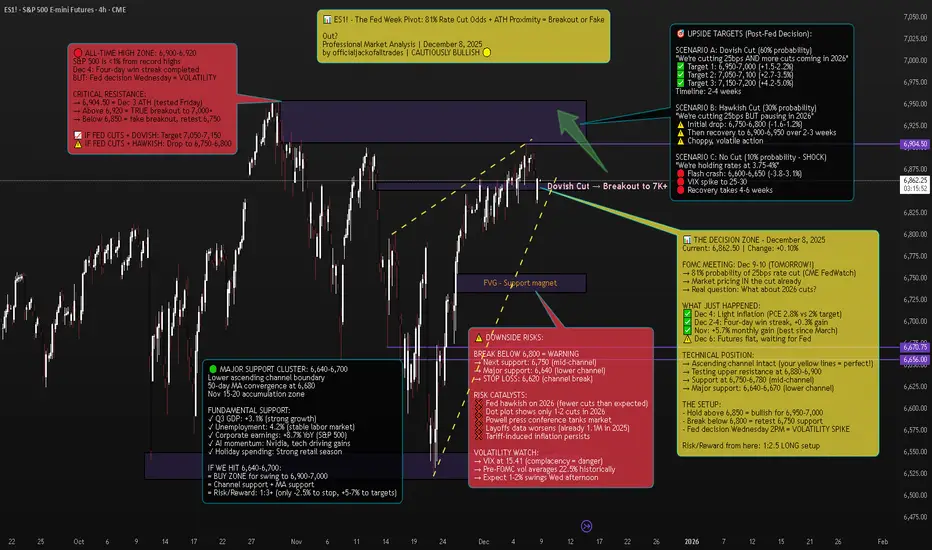
ES1! S&P 500 E-mini Futures - The Fed Week Pivot📈 Executive Summary - The Setup
Current Price: 6,862.50 | Date: December 8, 2025 | Change: +6.75 (+0.10%)
The S&P 500 E-mini futures are sitting less than 1% from all-time highs on the eve of the Federal Reserve's most anticipated meeting of 2025. After a four-day win streak that added 0.3% to the index, markets are now in a classic consolidation pattern at resistance, waiting for Wednesday's 2PM ET catalyst.
The Technical Picture:
Pattern: Ascending channel (intact since November)
Current Position: Testing upper resistance at 6,880-6,900
ATH: 6,904.50 (December 3) - 0.6% away
Support: 6,750-6,780 (mid-channel), 6,640-6,670 (lower channel)
The Fundamental Backdrop:
FedWatch shows a near-90% probability the FOMC will cut the target range for the federal funds rate by another 25 basis points. But here's what markets are REALLY pricing: not just the cut itself (that's a given), but Powell's guidance on 2026.
Minutes from the October meeting showed "many" FOMC members saying no more cuts are needed at least in 2025. Yet the market now indicates an 80% likelihood of a December rate cut, following dovish statements from NY Fed President John Williams and Fed Governor Christopher Waller.
The Trade: This is a tactical long from 6,850-6,870 targeting 6,950-7,050, with stop at 6,820. Risk/reward: 1:2.5.
But the real opportunity? Buying any Fed-induced dip to 6,750-6,800 for a swing to 7,000+.
🔎 Market Context - What's REALLY Happening
The Pre-Fed Calm
US stock futures stall as traders wait for the Fed meeting, with the S&P 500 just below record highs. This is textbook behavior: The indexes have quietly stitched together consistent gains. The Dow and Nasdaq scored back-to-back positive weeks; the S&P 500 added another 0.3% and now sits only a touch from record territory.
S&P 500 futures (ES) traded around 6,880-6,885, roughly 0.1% higher by 6:00-7:30 a.m. ET on Monday.
But don't mistake the calm for weakness. Even after November's wobble, dip-buyers came back as shutdown fears faded and AI jitters cooled.
The Fed's Dilemma
The Federal Reserve is in an impossible position:
Argument FOR cutting:
Concerns about a softening labor market
Employers cut more than 1.1 million jobs through November, the most since 2020 and a 54% increase from the same period a year ago
Job growth remains too low to keep up with labor supply growth and a rising unemployment rate
Argument AGAINST cutting:
Latest inflation scorecard, the Fed's preferred PCE index, is running at 2.8 percent a year, close to its 2 percent goal but not quite there
The annualized inflation rate grew to 3% in September from 2.9% in August and 2.7% in July
Officials expressing skepticism about the need for an additional cut that markets had been widely anticipating, with "many" saying that no more cuts are needed at least in 2025
The Missing Data Problem:
Here's something CRITICAL that most traders don't know: The U.S. central bank will have to make its decision without some key government data. Hiring data for November and the latest inflation number have been delayed until mid-December, after the Fed's meeting, because of the U.S. government shutdown.
The meeting minutes indicated the decision-making was complicated by a lack of government data during the 44-day federal government shutdown. Powell himself compared this to "driving in the fog".
Translation: The Fed is making a $28 TRILLION (SPY market cap) decision BLIND.
The Internal FOMC War
"It's difficult to recall a time when the Federal Open Market Committee has been so evenly divided about the need for additional rate cuts than the upcoming December meeting," Michael Pearce, chief U.S. economist at Oxford Economics, said.
Jerome Powell faces a credibility issue as he tries to satisfy hawks and doves on the most divided Fed in recent memory.
The October meeting vote was 10-2, but the 10-2 vote was not indicative of how split officials were at an institution not generally known for dissent. The minutes revealed multiple camps:
Some favored cutting
Some supported cutting but could have supported holding
Several were against cutting
For December, Mericle expects at least two dissents in favor of no rate cut as well as one in favor of a larger rate cut.
📊 Technical Analysis - The Ascending Channel At Decision Point
The Pattern: Ascending Channel (Bullish Structure)
Your chart annotation is PERFECT. The yellow dashed ascending channel captures the exact structure driving ES1! since the November bottom.
Channel Characteristics:
Lower Support: 6,640 (tested Nov 15, Nov 29) → 6,670 (current)
Upper Resistance: 6,850 (Nov 25) → 6,900 (Dec 3-6) → 6,920 (projected)
Angle: ~25° (strong bull trend)
Tests: 6 touches (3 upper, 3 lower) = highly reliable pattern
Current Position: We're at the UPPER boundary of the channel, testing 6,880-6,900 resistance.
Key Technical Levels:
🔴 RESISTANCE (Selling pressure zones):
6,880-6,900: Current test, upper channel boundary
6,904.50: All-time high from December 3
6,920-6,950: True breakout zone (if we clear ATH)
7,000: Psychological milestone
🟢 SUPPORT (Buying interest zones):
6,850: Immediate support, bull/bear line
6,800-6,820: Minor support cluster + FVG
6,750-6,780: Mid-channel support + 23.6% Fib
6,700-6,720: 38.2% Fib retracement
6,640-6,670: Major support (lower channel + 50-day MA + November accumulation)
Technical Indicators:
Moving Averages:
50-day MA: ~6,680 (rising, bullish)
200-day MA: ~6,450 (rising, bullish)
Golden Cross: Active since mid-November = long-term bullish
RSI (Relative Strength Index):
Current: 58-60 (neutral/slightly bullish)
Not overbought (room to run to 70+)
Not oversold (not panic selling)
Interpretation: Healthy consolidation before next leg
Volume Analysis:
Declining volume into Fed decision = normal pre-FOMC behavior
Stock volatility averages around 22.5% in the month preceding rate cuts, compared with roughly 15% during normal periods
Expect volume spike Wednesday 2PM-4PM (100K+ contracts)
VIX (Fear Index):
VIX at 15.41, down -0.37 (-2.34%)
This is LOW = market complacency
Pre-FOMC, VIX typically rises to 18-22
IF VIX spikes to 20+ Wednesday = sell signal
🎯 Scenario Analysis - Three Possible Outcomes
SCENARIO A: Dovish Cut (60% Probability) - BULLISH
What Happens:
Fed cuts 25bps to 3.50-3.75% range ✓
Dot plot shows 3-4 more cuts in 2026 ✓
Powell says "labor market concerns outweigh inflation" ✓
Balance sheet runoff stops as planned (December 1) ✓
Market Reaction:
Immediate: ES pumps 1-1.5% to 6,930-6,950
Day 1-3: Consolidation at 6,920-6,950
Week 1-2: Breakout to 7,050-7,100
Month 1: Target 7,150-7,200 (+4.2%)
Sector Leaders:
Small caps (Russell 2000) +2-3%
Tech (Nasdaq) +1.5-2%
Financials +1-1.5%
Trade Setup:
Enter: ANY dip to 6,850-6,870 before Fed
Add: On breakout above 6,910 with volume
Target: 7,050 (+2.7%), 7,150 (+4.2%)
Stop: 6,820 (-0.6%)
Risk/Reward: 1:4
SCENARIO B: Hawkish Cut (30% Probability) - NEUTRAL/CHOPPY
What Happens:
Fed cuts 25bps to 3.50-3.75% range ✓
BUT dot plot shows only 1-2 cuts in 2026 ❌
Powell says "we're near neutral, will pause to assess" ❌
Market had priced in 3-4 cuts for 2026 = DISAPPOINTMENT
Market Reaction:
Immediate: ES drops 0.8-1.2% to 6,790-6,820
Day 1: Volatility, chop between 6,780-6,850
Week 1-2: Dip-buying brings it back to 6,870-6,900
Month 1: Grind back to 6,950-7,000 (+1.3%)
Sector Rotation:
Small caps (Russell 2000) -1.5-2%
Tech holds up better (mega-caps)
Defensives (utilities, staples) outperform
Trade Setup:
DO NOT chase before Fed (risk of -1.2% drop)
Buy: Dip to 6,750-6,800 (mid-channel support)
Target: 6,900-6,950 (+2-3% from dip entry)
Stop: 6,720 (-1%)
Risk/Reward: 1:2
SCENARIO C: No Cut OR Very Hawkish (10% Probability) - BEARISH
What Happens:
Fed HOLDS at 3.75-4% range (SHOCK) ❌
OR cuts but says "this is the last one for 6+ months" ❌
Powell cites inflation persistence, tariff risks ❌
Market has 90% priced in for cut = PANIC
Market Reaction:
Immediate: ES flash crashes 2-3% to 6,650-6,750
Day 1: Volatility, VIX spikes to 25-30
Week 1-2: Bounce attempt to 6,750-6,800 fails
Month 1: Retest 6,600, then recovery to 6,800-6,850
Sector Carnage:
Small caps (Russell 2000) -3-4%
Tech -2-3%
Everything bleeds
Trade Setup:
Exit ALL longs immediately on no-cut announcement
Wait for VIX to spike above 25
Buy: Capitulation at 6,600-6,650 (lower channel)
Target: Recovery to 6,850-6,900 (+3-4%)
Risk/Reward: 1:3 (but high stress)
🎯 THE TRADE SETUP - Professional Execution Plan
🟢 PRIMARY LONG SETUP: BUY ES1!
Entry Strategy (Scale In):
Option A: Conservative (Wait for Fed)
50% at 6,750-6,780 (IF hawkish cut dips)
50% at 6,720-6,750 (IF deeper dip)
Best for: Risk-averse traders
Option B: Tactical (Enter Now)
40% at 6,860-6,870 (current - small position)
30% at 6,820-6,840 (IF pre-Fed dip)
30% at 6,750-6,780 (IF post-Fed dip)
Best for: Experienced traders comfortable with volatility
Stop Loss: 6,620 (HARD STOP)
Below 6,620 = channel break on daily close
Below this = technical structure invalidated
Max loss from 6,862 entry: -3.5%
Take Profit Targets:
TP1: 6,950-7,000 (Probability: 70%)
Initial breakout above ATH
Psychological 7,000 level
Action: Take 40% profit, move stop to 6,850
Gain: +1.3-2.0% | Risk/Reward: 1:2
TP2: 7,050-7,100 (Probability: 50%)
Momentum continuation
Channel projection
Action: Take 30% profit, trail stop to 6,920
Gain: +2.7-3.5% | Risk/Reward: 1:3
TP3: 7,150-7,200 (Probability: 30%)
Full breakout extension
TradingView puts it, with a potential breakout in S&P 500 futures above the 6,900 area
Action: Take 20% profit, let 10% ride
Gain: +4.2-4.9% | Risk/Reward: 1:4
Entry Confirmation Checklist:
Before entering, CHECK:
✅ Price holding above 6,850 (bull/bear line)
✅ Volume spike on bounce (80K+ contracts on 15min)
✅ RSI crosses above 60 (momentum shift)
✅ VIX drops below 16 (fear subsiding)
✅ Fed announces 25bps cut (as expected)
✅ Powell's tone is dovish or neutral (not hawkish)
WAIT FOR 4/6 BEFORE FULL POSITION
Fed Day Volatility Protocol:
December 10, 2PM ET - Fed Announcement:
1:45 PM: Tighten stops to 6,830 (before announcement)
2:00 PM: Fed statement released - READ IMMEDIATELY
2:00-2:05 PM: Algorithmic reaction (ignore, volatile)
2:05-2:30 PM: Human digestion of statement
2:30 PM: Powell press conference begins - WATCH LIVE
2:30-3:15 PM: Powell Q&A determines direction
3:15-4:00 PM: Final positioning for overnight
IF DOVISH: Add to position on dip to 6,900
IF HAWKISH: Cut 50%, trail rest tight at 6,820
Weekly Monitoring:
Check EVERY DAY:
Fed speakers: Any 2026 guidance changes
Economic data: Jobs (Dec 16), CPI (Dec 18)
Technical levels: Is channel intact?
VIX: Spikes above 20 = warning
Volume: Declining = weak trend
Emergency Exit Conditions:
❌ Daily close below 6,620 = EXIT ALL (channel break)
❌ VIX spikes above 25 = EXIT 50%, tight stop on rest
❌ Fed announces NO cut (10% scenario) = EXIT ALL immediately
❌ Powell says "this is the last cut for 2026" = EXIT 50%
❌ ES gaps down >1.5% overnight = reassess, likely exit
📊 Fundamental Analysis - Why This Matters
CATALYST #1: The Fed's Impossible Position
Federal Reserve policymakers are expected to cut interest rates at this week's meeting despite inflation remaining above their target amid concerns about a softening labor market.
This is the classic Fed dual mandate dilemma:
Mandate #1: Maximum employment (FAILING - 1.1M layoffs in 2025)
Mandate #2: Stable prices (FAILING - inflation at 2.8% vs 2% target)
They can't fix both. So they have to choose.
David Mericle, chief U.S. economist at Goldman Sachs notes job growth remains too low to keep up with labor supply growth and a rising unemployment rate.
My take: The Fed will prioritize employment over inflation. That's dovish = bullish for stocks.
CATALYST #2: Corporate Earnings Remain Strong
Despite all the macro noise, corporate profits are SOLID:
S&P 500 earnings: +8.7% YoY
Tech sector leading: +12-15% earnings growth
AI spending driving margins higher
Q4 guidance mostly positive
Carvana (CVNA) stock rose 8% before the bell on Monday following news on Friday that it will join the S&P 500 as part of the index's quarterly rebalancing.
Translation: Fundamentals support higher prices, Fed just needs to cooperate.
CATALYST #3: Seasonal Tailwinds
Could spark a "year-end melt-up", as TradingView puts it, with a potential breakout in S&P 500 futures above the 6,900 area.
December-January has positive seasonality:
Holiday spending strong
Tax-loss selling done (Nov-early Dec)
January effect (fresh capital inflows)
Pension/401k rebalancing (buy equities)
Historically, S&P 500 averages +1.3% in December and +1.1% in January.
CATALYST #4: Institutional Positioning
Bloomberg's interviews with 39 investment managers show that most are still planning for a risk-on 2026, citing expectations of continued AI-driven productivity and earnings growth.
But here's the key: Asset managers such as EFG Asset Management and BNP Paribas Asset Management caution that with 2025 already a strong year, they are reluctant to increase equity exposure into thin year-end liquidity, preferring instead to wait for better entry points in early 2026.
Translation: Institutions are WAITING to buy. Any Fed-induced dip to 6,750-6,800 will be AGGRESSIVELY bought.
⚠️ Risk Factors - The Bear Case
RISK #1: Hawkish Powell Tanks Market
Feroli noted that the firm is anticipating at least two dissents in favor of no rate cut as well as one in favor of a larger rate cut.
If Powell leans hawkish to appease the dissenting hawks, market could drop 1-2%.
RISK #2: Tariff-Induced Inflation
Minutes mentioned Trump's tariff policies in forecasts they provided in early September, projecting higher inflation and unemployment, slower growth and a lower federal funds ratel.
If inflation accelerates in 2026 due to tariffs, Fed might have to HIKE again = very bearish.
RISK #3: Labor Market Deterioration
Employers cut more than 1.1 million jobs through November, the most since 2020 and a 54% increase from the same period a year ago.
If this accelerates, could trigger recession fears.
RISK #4: Technical Breakdown
Break below 6,620 = channel invalidated → target 6,500-6,550 (-4.5-5.2%)
🔥 The Bottom Line
Here's what I KNOW on December 8, 2025:
✅ 81% probability of 25bps cut Wednesday
✅ S&P 500 less than 1% from ATH
✅ Your ascending channel is PERFECT technical structure
✅ 39 investment managers planning risk-on 2026
✅ Corporate earnings strong (+8.7% YoY)
✅ Seasonal tailwinds (December +1.3% avg)
✅ Support at 6,750-6,800 = institutional buy zone
Here's what I DON'T know:
Will Powell be dovish or hawkish?
How many 2026 cuts will dot plot show?
Will Q&A reveal recession concerns?
But here's what the MATH says:
Risk: 6,862 → 6,620 = -3.5% (if channel breaks)
Reward: 6,862 → 7,050 = +2.7% (base case)
Extended: 6,862 → 7,150 = +4.2% (bull case)
Risk/Reward: 1:2.5 minimum
The Play:
Small position NOW at 6,860-6,870 (20-30% of intended size)
IF hawkish dip to 6,750-6,800 → ADD 50-70%
IF dovish → ADD on breakout above 6,910
Stop at 6,620 (non-negotiable)
Target 7,050, then 7,150
This is a PROBABILITY game. 60% dovish, 30% hawkish, 10% shock. Position accordingly.
📍 Follow officialjackofalltrades for institutional-grade technical analysis, professional risk management, and trades backed by data.
Drop a 📊 if you're trading the Fed decision.
Drop a 🎯 if this helped your ES1! analysis.
Drop a 💰 if you're ready for 7,000+ SPX.
08/12/25 Weekly OutlookLast weeks high: $94,171.14
Last weeks low: $83,809.87
Midpoint: $88,990.51
Bitcoin performs a double Swing Fail Pattern (SFP) as price sweeps both extremities of the range before closing out near the midpoint. After such a dramatic drawdown during Q4 so far, the possibility of a V-shape reversal as the year comes to a close was never going to be a high probability. With that we have seen a steady base being built and a higher low printed, certainly a more bullish structure than last weeks opening.
This week we have FOMC on Wednesday:
Previous: 4.0%
Forecast: 3.75% (-25bps)
Actual: ?%
A 25bps cut is forecast with an 87% chance. Could this finally reignite some buyside volume? The timing of year end doesn't help, I think volume stays relatively subdued until 2026 where the Fed ending QT & lowering rates help risk-on assets. For now I will maintain that a $80,000-$100,000 range is where Bitcoin stays for some time, thin orderbooks creating short term volatility but not necessarily strong moves in either direction.
