Xrp (Ripple)Ripple
Xrp usdt Daily analysis
Time frame daily
Risk rewards ratio >3.2 👈👌
Target 3.2$
Ripple technical analysis ✅️
My last short position reached the target.
Head and shoulders pattern completed.
Now it is a good time to start
My critical area is red box that you see on the chart. It is very important area .
If Ripple can reach and break this resistance, we will have a good pump
But now 3 _3.2$ is a good target
Forecast

Crypto.com (CRO)Cro usdt Daily analysis
Time frame daily
Risk rewards ratio >5.3 👈👌
Nothing to say
Chart is clear
Red line is historical support line


Avalanche (avax)Avax usdt Daily analysis
Time frame daily
As you see on the chart , if decrease of avax stops on 17.5 $ the pattern (double bottom)will create.
So we will see the end of decreasing and avax will reach to 25$
On the other hand , if price breaks down and reach 15 EURONEXT:OR less , this pattern will failed

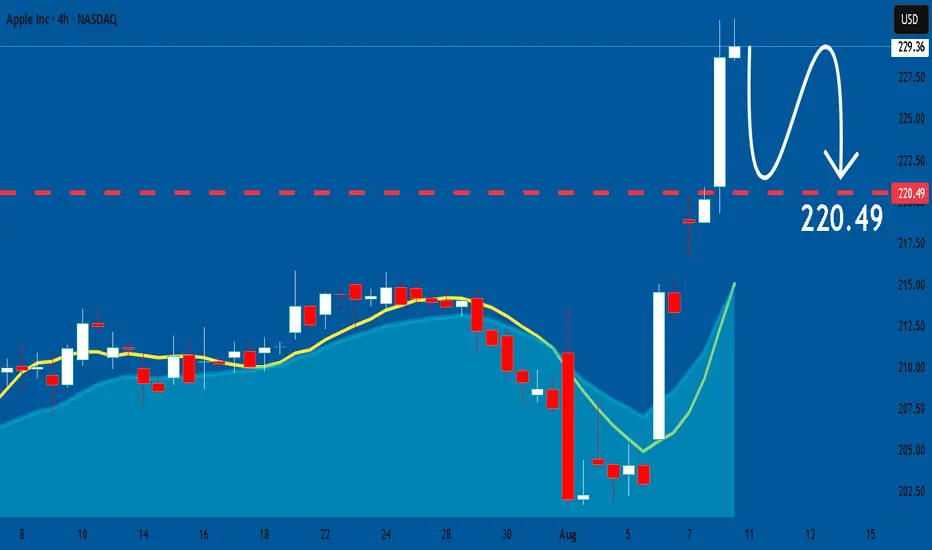
APPLE: Forecast & Trading Plan
Remember that we can not, and should not impose our will on the market but rather listen to its whims and make profit by following it. And thus shall be done today on the APPLE pair which is likely to be pushed down by the bears so we will sell!
Disclosure: I am part of Trade Nation's Influencer program and receive a monthly fee for using their TradingView charts in my analysis.
❤️ Please, support our work with like & comment! ❤️
EOSEoS usd daily analysis
Time frame daily
First target
Risk rewards ratio >2.2 👈
Second target
Risk rewards ratio >5.5 👈 👌
Eos is in the bottom of it's chart
It has no way except pump

LitecoinLtc usdt daily analysis
Time frame hourly
Risk rewards ratio >2.7👈👌
Short position
Target 100.5 $

USD/JPY BEARS ARE STRONG HERE|SHORT
Hello, Friends!
We are targeting the 145.012 level area with our short trade on USD/JPY which is based on the fact that the pair is overbought on the BB band scale and is also approaching a resistance line above thus going us a good entry option.
Disclosure: I am part of Trade Nation's Influencer program and receive a monthly fee for using their TradingView charts in my analysis.
✅LIKE AND COMMENT MY IDEAS✅

EURUSD Will Go Higher! Buy!
Please, check our technical outlook for EURUSD.
Time Frame: 9h
Current Trend: Bullish
Sentiment: Oversold (based on 7-period RSI)
Forecast: Bullish
The market is approaching a significant support area 1.164.
The underlined horizontal cluster clearly indicates a highly probable bullish movement with target 1.175 level.
P.S
Overbought describes a period of time where there has been a significant and consistent upward move in price over a period of time without much pullback.
Disclosure: I am part of Trade Nation's Influencer program and receive a monthly fee for using their TradingView charts in my analysis.
Like and subscribe and comment my ideas if you enjoy them!

Ethereum Eth usd daily analysis
Time frame 4hours
Risk rewards ratio =2 👈👌
Technical analysis 👇👇
As you can see in the chart, Ethereum has formed a double top(peak) pattern.
The distance from the top to the bottom has dropped by about 14%.
So, according to the double top pattern, we should have the same amount of drop from the bottom of the second peak. -14%again.
This Ethereum price decline has ended with a support level. (Dark blue box )
👉Which is a very important point.👈
On the other hand, according to Elliott wave counting, the 3-point correction wave has also ended and Ethereum is starting an impulse wave. ✔️
There is also news about the start of the Alt-Season, and we know that one of the factors for the start of the Alt-Season is negative sentiment towards the market.📉📉
and now most analysts and traders expect a price decline, which can be good news for buyers.👌👍

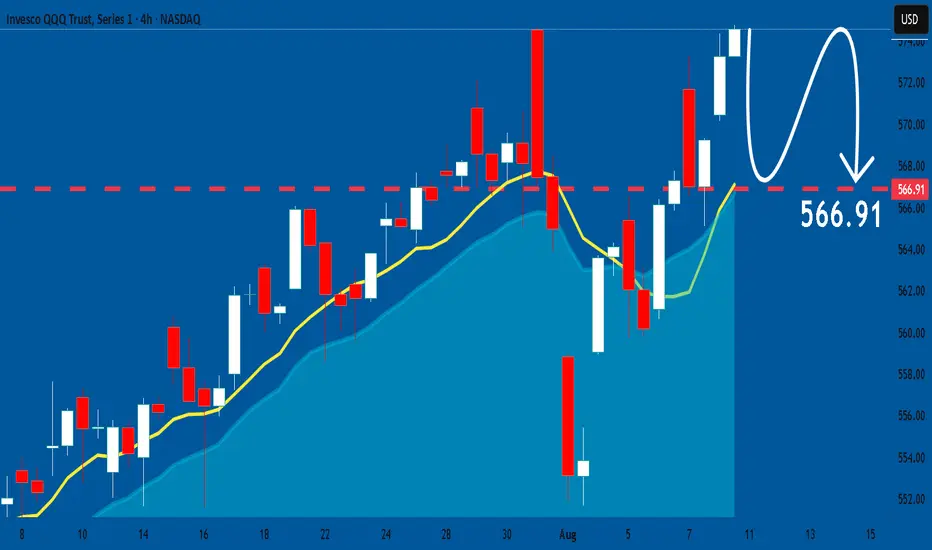
QQQ: Bearish Continuation is Highly Probable! Here is Why:
Looking at the chart of QQQ right now we are seeing some interesting price action on the lower timeframes. Thus a local move down seems to be quite likely.
Disclosure: I am part of Trade Nation's Influencer program and receive a monthly fee for using their TradingView charts in my analysis.
❤️ Please, support our work with like & comment! ❤️
NG1! BUYERS WILL DOMINATE THE MARKET|LONG
NG1! SIGNAL
Trade Direction: long
Entry Level: 2.996
Target Level: 3.043
Stop Loss: 2.964
RISK PROFILE
Risk level: medium
Suggested risk: 1%
Timeframe: 1h
Disclosure: I am part of Trade Nation's Influencer program and receive a monthly fee for using their TradingView charts in my analysis.
✅LIKE AND COMMENT MY IDEAS✅

DogecoinDoge usdt Daily analysis
Time frame 4hours
Risk rewards ratio >2
Dogecoin always has a good volume in the market
Investors know that Musk is interested in Dogecoin, and this is a positive point for this currency. The currency was created as a joke but found its place and now Doge has drawn a clear path for itself and for enthusiasts.
The price is now fluctuating in an ascending triangle. It's very dangerous if market crashed down but I think sentiment of market is positive after Trump.
Of course we must be careful
So my target is not dreamy
I am watching the market and waiting for suitable time to enter again for higher target on 0.73 $

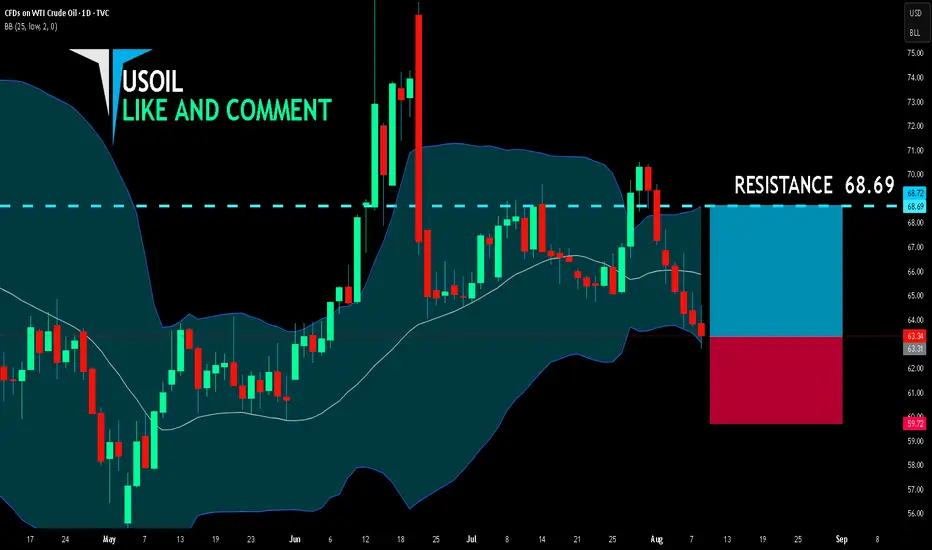
USOIL BEST PLACE TO BUY FROM|LONG
USOIL SIGNAL
Trade Direction: long
Entry Level: 63.31
Target Level: 68.69
Stop Loss: 59.72
RISK PROFILE
Risk level: medium
Suggested risk: 1%
Timeframe: 1D
Disclosure: I am part of Trade Nation's Influencer program and receive a monthly fee for using their TradingView charts in my analysis.
✅LIKE AND COMMENT MY IDEAS✅
AUD/USD SHORT FROM RESISTANCE
Hello, Friends!
We are now examining the AUD/USD pair and we can see that the pair is going up locally while also being in a uptrend on the 1W TF. But there is also a powerful signal from the BB upper band being nearby, indicating that the pair is overbought so we can go short from the resistance line above and a target at 0.644 level.
Disclosure: I am part of Trade Nation's Influencer program and receive a monthly fee for using their TradingView charts in my analysis.
✅LIKE AND COMMENT MY IDEAS✅

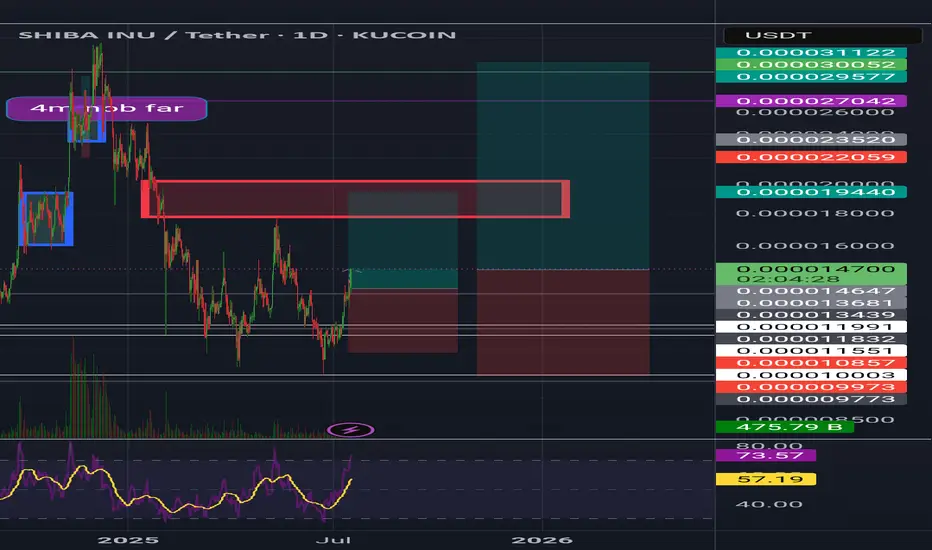
Shiba inuShib usdt Daily analysis
Time frame daily
First target = 0 00001944$
Risk rewards ratio =2 👈👌
Second target = 0.00003
Risk rewards ratio >3.5 👈 👌
The red box that you can see on the screen is very important resistance area.
If Shiba breaks it strongly, second target will be reach
BITCOIN Will Move Lower! Short!
Take a look at our analysis for BITCOIN.
Time Frame: 4h
Current Trend: Bearish
Sentiment: Overbought (based on 7-period RSI)
Forecast: Bearish
The price is testing a key resistance 116,484.20.
Taking into consideration the current market trend & overbought RSI, chances will be high to see a bearish movement to the downside at least to 114,249.78 level.
P.S
The term oversold refers to a condition where an asset has traded lower in price and has the potential for a price bounce.
Overbought refers to market scenarios where the instrument is traded considerably higher than its fair value. Overvaluation is caused by market sentiments when there is positive news.
Disclosure: I am part of Trade Nation's Influencer program and receive a monthly fee for using their TradingView charts in my analysis.
Like and subscribe and comment my ideas if you enjoy them!

GBPJPY Is Very Bullish! Long!
Here is our detailed technical review for GBPJPY.
Time Frame: 12h
Current Trend: Bullish
Sentiment: Oversold (based on 7-period RSI)
Forecast: Bullish
The market is testing a major horizontal structure 198.776.
Taking into consideration the structure & trend analysis, I believe that the market will reach 200.007 level soon.
P.S
Overbought describes a period of time where there has been a significant and consistent upward move in price over a period of time without much pullback.
Disclosure: I am part of Trade Nation's Influencer program and receive a monthly fee for using their TradingView charts in my analysis.
Like and subscribe and comment my ideas if you enjoy them!

Bitget token ( BGB)Bgb usdt Daily analysis
Time frame 4hours
BgB is bitget exchange token
OT has unbelievable growth before yesterday
7days 81%
30days 366%
90 days 623%
YTD 1164%
Today, this growth stopped ✋️ and fell down 10%
I think we have two price to enter 7.3$ and 6$
But here is a problem
If you want to buy this token , only bitget , bitfinix and mexc exchanges are seller , not famous exchanges like Binance and kraken and...
This problem when you want to trade bgb will be a big problem.
So you have to be careful.👌👌

AptusApt usdt Daily analysis
Time frame 4hours
Risk rewards ratio >1.8 👈👌
Technical analysis 👇
After a correction, ApTuS is gathering energy to start an upward movement.🕰🕰
The price has fallen to the gray uptrend line.
This gray line, which acts as a support, as well as another support level marked in dark blue on the chart, have created very strong support.
According to Elliott Wave Analysis, the three-point Elliott wave pattern has ended and we are now ready to start the impulse waves.
The volume chart gives us signs that an accumulation is forming in this area.
We conclude that, considering the three factors mentioned above,
1. The price is in a strong support area,
2. The Elliott wave correction has ended, and 3. Volume chart shows an accumulation area
👇👇👇👇
Based on this, we conclude that the right point and time for a price will increase and good Risk rewards ratio ~2 for traders 👌


tron (TRX)trx usdt daily analyses
time frame 4 hours
risk riwards ratio > 3.5 (woooow)
****** ( My condolences to those who lost their lives in the California fires.) *******
there is no volume in the market yet.
RSI is in the bottom of chart
price is in the down side of triangle and sellers couldn't break the support line ( 0.225$)
I set LS on the down of another support line on 0.195$
if we hear a good news about cryptocurrency market or tron , maybe a pump happens and good benefit for traders.
be careful for stop hunters. in this situations

Graphlinq (GLQ)Glq usdt Daily analysis
Time frame daily
Risk rewards ratio >3.2 👈👌
As I said
As I said, the blue rectangle you see on the chart is an important area. The price has touched the historical trendline and the RSI indicator is at the bottom.
What more sign do you want?
Enjoy 300% profit
