Quantitative Trading Models in Forex: A Deep DiveQuantitative Trading Models in Forex: A Deep Dive
Quantitative trading in forex harnesses advanced algorithms and statistical models to decode market dynamics, offering traders a sophisticated approach to currency trading. This article delves into the various quantitative trading models, their implementation, and their challenges, providing insights for traders looking to navigate the forex market with a data-driven approach.
Understanding Quantitative Trading in Forex
Quantitative trading, also known as quant trading, in the forex market involves using sophisticated quantitative trading systems that leverage complex mathematical and statistical methods to analyse market data and execute trades. These systems are designed to identify patterns, trends, and potential opportunities in currency movements that might be invisible to the naked eye.
At the heart of these systems are quantitative trading strategies and models, which are algorithmic procedures developed to determine market behaviour and make informed decisions. These strategies incorporate a variety of approaches, from historical data analysis to predictive modelling, which should ensure a comprehensive assessment of market dynamics. Notably, in quantitative trading, Python and similar data-oriented programming languages are often used to build models.
In essence, quantitative systems help decipher the intricate relationships between different currency pairs, economic indicators, and global events, potentially enabling traders to execute trades with higher precision and efficiency.
Key Types of Quantitative Models
Quantitative trading, spanning diverse markets such as forex, stocks, and cryptocurrencies*, utilises complex quantitative trading algorithms to make informed decisions. While it's prominently applied in quantitative stock trading, its principles and models are particularly significant in the forex market. These models are underpinned by quantitative analysis, derivative modelling, and trading strategies, which involve mathematical analysis of market movements and risk assessment to potentially optimise trading outcomes.
Trend Following Models
Trend-following systems are designed to identify and capitalise on market trends. Using historical price data, they may determine the direction and strength of market movements, helping traders to align themselves with the prevailing upward or downward trend. Indicators like the Average Directional Index or Parabolic SAR can assist in developing trend-following models.
Mean Reversion Models
Operating on the principle that prices eventually move back towards their mean or average, mean reversion systems look for overextended price movements in the forex market. Traders use mean reversion strategies to determine when a currency pair is likely to revert to its historical average.
High-Frequency Trading (HFT) Models
Involving the execution of a large number of orders at breakneck speeds, HFT models are used to capitalise on tiny price movements. They’re less about determining market direction and more about exploiting market inefficiencies at micro-level time frames.
Sentiment Analysis Models
These models analyse market sentiment data, such as news headlines, social media buzz, and economic reports, to gauge the market's mood. This information can be pivotal in defining short-term movements in the forex market, though this model is becoming increasingly popular for quantitative trading in crypto*.
Machine Learning Models
These systems continuously learn and adapt to new market data by incorporating AI and machine learning, identifying complex patterns and relationships that might elude traditional models. They are particularly adept at processing large volumes of data and making predictive analyses.
Hypothesis-Based Models
These models test specific hypotheses about market behaviour. For example, a theory might posit that certain economic indicators lead to predictable responses in currency markets. They’re then backtested and refined based on historical data to validate or refute the hypotheses.
Each model offers a unique lens through which forex traders can analyse the market, offering diverse approaches to tackle the complexities of currency trading.
Quantitative vs Algorithmic Trading
While quant and algorithmic trading are often used interchangeably and do overlap, there are notable differences between the two approaches.
Algorithmic Trading
Focus: Emphasises automating processes, often using technical indicators for decision-making.
Methodology: Relies on predefined rules based on historical data, often without the depth of quantitative analysis.
Execution: Prioritises automated execution of trades, often at high speed.
Application: Used widely for efficiency in executing repetitive, rule-based tasks.
Quantitative Trading
Focus: Utilises advanced mathematical and statistical models to determine market movements.
Methodology: Involves complex computations and data analysis and often incorporates economic theories.
Execution: May or may not automate trade execution; focuses on strategy formulation.
Application: Common in risk management and strategic trade planning.
Implementation and Challenges
Implementing quantitative models in forex begins with the development of a robust strategy involving the selection of appropriate models and algorithms. This phase includes rigorous backtesting against historical data to validate their effectiveness. Following this, traders often engage in forward testing in live market conditions to evaluate real-world performance.
Challenges in this realm are multifaceted. Key among them is the quality and relevance of the data used. Models can be rendered ineffective if based on inaccurate or outdated data. Overfitting remains a significant concern, where systems too closely tailored to historical data may fail to adapt to evolving market dynamics. Another challenge is the constant need to monitor and update models to keep pace with market changes, requiring a blend of technical expertise and market acumen.
The Bottom Line
In this deep dive into quantitative trading in forex, we've uncovered the potency of diverse models, each tailored to navigate the complex currency markets with precision. These strategies, rooted in data-driven analysis, may offer traders an edge in decision-making.
*Important: At FXOpen UK, Cryptocurrency trading via CFDs is only available to our Professional clients. They are not available for trading by Retail clients. To find out more information about how this may affect you, please get in touch with our team.
This article represents the opinion of the Companies operating under the FXOpen brand only. It is not to be construed as an offer, solicitation, or recommendation with respect to products and services provided by the Companies operating under the FXOpen brand, nor is it to be considered financial advice.
Forex

AUDUSD: Bullish Continuation After Breakout 🇦🇺🇺🇸
AUDUSD is going to rise more following a bullish breakout
of a key daily/intraday horizontal resistance.
Next goal - 0.66
❤️Please, support my work with like, thank you!❤️
I am part of Trade Nation's Influencer program and receive a monthly fee for using their TradingView charts in my analysis.

BTC/USD Short Setup – Breakdown from Bear Flag Edge🚀||| 👆Your Boost is appreciated in Advance👆 |||🚀
Thesis: Bitcoin is trading within a well-defined descending channel, potentially forming a bear flag on the higher time frame. Price is currently hovering just below the key resistance zone near $108,600 (“The Edge”), failing to reclaim the upper boundary of the flag.
==================================================================
Entry: 🔻 Short at $106,850 – Price is rejecting the upper channel resistance and failing to break above “The Edge”
Stop-Loss: 🔺 $109,000 – Above the recent swing high and invalidation of the flag structure
Take-Profit 1: ✅ $104,700 🎯
Take-Profit 2: ✅ $102,400 🎯
Optional extended:
TP4: $98,000 – Full measured move of the flag breakdown
Risk-Reward Ratio: ~1:1 to 1:4 depending on target
====================================================================
#MJTrading
#BTCUSD #Bitcoin #CryptoTrading #ShortSetup #BearFlag #TechnicalAnalysis #PriceAction #MarketStructure #SwingTrade #TradingView

BITCOIN BEARS ARE GAINING STRENGTH|SHORT
BITCOIN SIGNAL
Trade Direction: short
Entry Level: 106,743.04
Target Level: 99,806.18
Stop Loss: 111,349.12
RISK PROFILE
Risk level: medium
Suggested risk: 1%
Timeframe: 1D
Disclosure: I am part of Trade Nation's Influencer program and receive a monthly fee for using their TradingView charts in my analysis.
✅LIKE AND COMMENT MY IDEAS✅

Potential bearish drop?CAD/JPY has reacted off the pivot which is a pullback resistance and could drop to the 1st support which is also a pullback support..
Pivot: 105.84
1st Support: 104.33
1st resistance: 106.80
Risk Warning:
Trading Forex and CFDs carries a high level of risk to your capital and you should only trade with money you can afford to lose. Trading Forex and CFDs may not be suitable for all investors, so please ensure that you fully understand the risks involved and seek independent advice if necessary.
Disclaimer:
The above opinions given constitute general market commentary, and do not constitute the opinion or advice of IC Markets or any form of personal or investment advice.
Any opinions, news, research, analyses, prices, other information, or links to third-party sites contained on this website are provided on an "as-is" basis, are intended only to be informative, is not an advice nor a recommendation, nor research, or a record of our trading prices, or an offer of, or solicitation for a transaction in any financial instrument and thus should not be treated as such. The information provided does not involve any specific investment objectives, financial situation and needs of any specific person who may receive it. Please be aware, that past performance is not a reliable indicator of future performance and/or results. Past Performance or Forward-looking scenarios based upon the reasonable beliefs of the third-party provider are not a guarantee of future performance. Actual results may differ materially from those anticipated in forward-looking or past performance statements. IC Markets makes no representation or warranty and assumes no liability as to the accuracy or completeness of the information provided, nor any loss arising from any investment based on a recommendation, forecast or any information supplied by any third-party.

GBP/CAD SELLERS WILL DOMINATE THE MARKET|SHORT
GBP/CAD SIGNAL
Trade Direction: short
Entry Level: 1.872
Target Level: 1.866
Stop Loss: 1.876
RISK PROFILE
Risk level: medium
Suggested risk: 1%
Timeframe: 1h
Disclosure: I am part of Trade Nation's Influencer program and receive a monthly fee for using their TradingView charts in my analysis.
✅LIKE AND COMMENT MY IDEAS✅

Bullish momentum to extend?AUD/CAD has bounced off the pivot and could potentially rise to the 1st resistance which lines up with the 161.8% Fibonacci extension.
Pivot: 0.8938
1st Support: 0.8905
1st Resistance: 0.9009
Risk Warning:
Trading Forex and CFDs carries a high level of risk to your capital and you should only trade with money you can afford to lose. Trading Forex and CFDs may not be suitable for all investors, so please ensure that you fully understand the risks involved and seek independent advice if necessary.
Disclaimer:
The above opinions given constitute general market commentary, and do not constitute the opinion or advice of IC Markets or any form of personal or investment advice.
Any opinions, news, research, analyses, prices, other information, or links to third-party sites contained on this website are provided on an "as-is" basis, are intended only to be informative, is not an advice nor a recommendation, nor research, or a record of our trading prices, or an offer of, or solicitation for a transaction in any financial instrument and thus should not be treated as such. The information provided does not involve any specific investment objectives, financial situation and needs of any specific person who may receive it. Please be aware, that past performance is not a reliable indicator of future performance and/or results. Past Performance or Forward-looking scenarios based upon the reasonable beliefs of the third-party provider are not a guarantee of future performance. Actual results may differ materially from those anticipated in forward-looking or past performance statements. IC Markets makes no representation or warranty and assumes no liability as to the accuracy or completeness of the information provided, nor any loss arising from any investment based on a recommendation, forecast or any information supplied by any third-party.

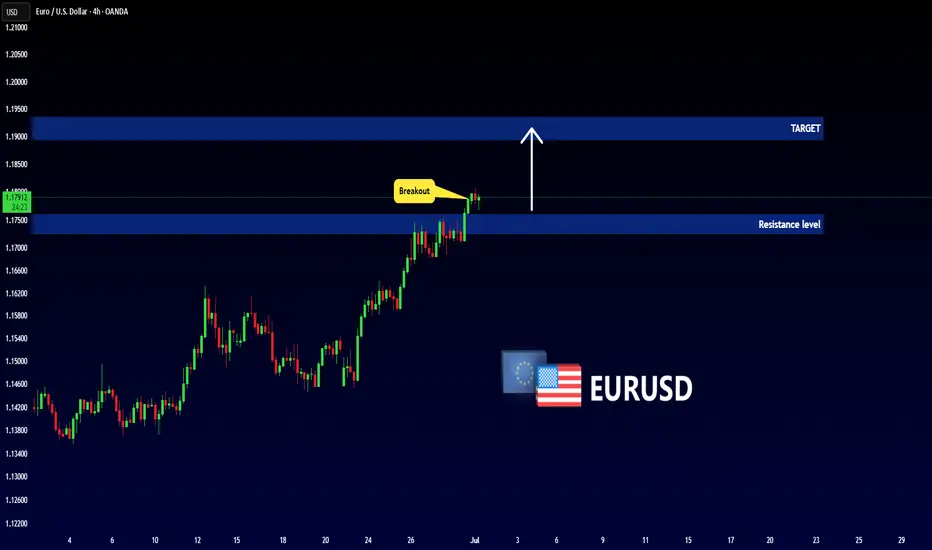
EURUSD - Important Breakout !Hello Traders !
The EURUSD price broke the resistance level (1.17255 - 1.17602).
This key level becomes new support!
So, I expect a bullish move🚀
________________
TARGET: 1.18950🎯
GBP/JPY BULLISH BIAS RIGHT NOW| LONG
Hello, Friends!
It makes sense for us to go long on GBP/JPY right now from the support line below with the target of 198.556 because of the confluence of the two strong factors which are the general uptrend on the previous 1W candle and the oversold situation on the lower TF determined by it’s proximity to the lower BB band.
Disclosure: I am part of Trade Nation's Influencer program and receive a monthly fee for using their TradingView charts in my analysis.
✅LIKE AND COMMENT MY IDEAS✅

XAUUSD Analysis – 01/07: Gold Sees a Rebound Amid USD WeaknessXAUUSD Analysis – 01/07: Gold Sees a Rebound Amid USD Weakness – Is a Recovery on the Cards?
As we enter the new month, gold prices are showing signs of recovery after a significant drop, primarily driven by the weakening of the US Dollar. However, despite some positive momentum, the path to sustained growth remains uncertain.
💵 USD Weakness Fuels Gold's Potential Rebound
Recent US economic data shows a slight decrease in consumer spending, which has led to speculation that the Federal Reserve may ease interest rate hikes in the near future.
This, in turn, has contributed to a weaker USD, providing an opportunity for gold to recover slightly.
⚖️ The Federal Reserve's Role Remains Critical
The markets are awaiting further clues on the Federal Reserve's next moves, especially with the ongoing debate about the potential direction of interest rates.
While the recent economic data isn't weak enough to force a policy reversal, it hasn't been strong enough to give the Fed the confidence to continue its hawkish stance either.
🧠 What Does This Mean for Traders?
Gold is responding to macroeconomic factors but still lacks a clear, strong trend.
Volatility remains high, with sharp price fluctuations occurring after key economic and political announcements. This uncertainty suggests gold might not yet have the momentum for a definitive break-out or trend reversal.
🔶 Summary:
Gold is starting to recover after a tough month but the outlook remains cautious.
Buyers are hoping for a Fed rate cut, while sellers are banking on the USD's strength.
Traders should stay vigilant, waiting for clear confirmation before making major moves.
📊 Key Levels to Watch:
Resistance Levels: 3358 – 3360 – 3364 – 3375 – 3380
Support Levels: 3300 – 3290 – 3280 – 3275
🎯 Trading Strategy:
🔵 Buy Zone:
Entry: 3310 – 3315
SL: 3300
TP: 3320 – 3330 – 3340 – 3350 – 3360
🔴 Sell Zone:
Entry: 3370 – 3375
SL: 3380
TP: 3360 – 3350 – 3340 – 3325
⚠️ Final Thoughts:
With USD weakness persisting, gold may continue its rebound, but the market remains uncertain.
Keep an eye on macroeconomic data and geopolitical events, as they will likely shape gold's next move.

GBP/NZD BEST PLACE TO BUY FROM|LONG
Hello, Friends!
Bullish trend on GBP/NZD, defined by the green colour of the last week candle combined with the fact the pair is oversold based on the BB lower band proximity, makes me expect a bullish rebound from the support line below and a retest of the local target above at 2.267.
Disclosure: I am part of Trade Nation's Influencer program and receive a monthly fee for using their TradingView charts in my analysis.
✅LIKE AND COMMENT MY IDEAS✅

EURGBP: Strong Bullish Confirmation 🇪🇺🇬🇧
EURGBP is going to continue rising in an uptrend
that the pair established at the end of May.
A completion of a consolidation and a formation of a new local Higher High
indicate a highly probable bullish continuation soon.
Next resistance - 0.8605
❤️Please, support my work with like, thank you!❤️
I am part of Trade Nation's Influencer program and receive a monthly fee for using their TradingView charts in my analysis.

BTC - Consolidation, Manipulation & DistributionMarket Context
The current price action unfolds within the broader structure of a bullish leg that began after a sharp reversal near 97,000. This impulsive rally created a clear Fair Value Gap on the 4-hour chart—left behind as price surged upward with minimal resistance. Following this move, the market entered a consolidation phase, forming a range that has now broken to the upside. This kind of breakout often attracts breakout traders, but in this case, the context signals something more calculated.
Buy Side Liquidity Sweep Following Consolidation
The breakout above the consolidation range led directly into a Buy Side Liquidity Sweep, as price ran the highs just above the marked range. These highs acted as a magnet for liquidity—stop losses from short sellers and buy stops from breakout traders were likely pooled in that area. The quick rejection following this sweep suggests the move was not backed by genuine demand, but rather served the purpose of liquidity collection by larger players.
Manipulation and Distribution
This is a textbook example of manipulation into liquidity. Price was engineered to move upward into a zone of interest, taking out the Buy Side Liquidity before sharply reversing. The strong rejection signals distribution—institutions likely offloaded positions into the influx of late buyers. This kind of pattern often precedes a larger markdown, particularly when followed by lower timeframe bearish structure breaks.
Unfilled Fair Value Gap as a Draw
Beneath the price lies an unfilled Fair Value Gap, a zone of imbalance left behind by the earlier impulsive move. These areas often act as magnets for price, especially once liquidity objectives to the upside have been completed. Now that the sweep has occurred and distribution is underway, there is a strong probability that price will begin to seek rebalancing within this Gap. The area between 104,000 and 103,500 stands out as a high-probability target for the next leg down.
Execution Insight
If you're looking to enter short, it may be wise to wait for confirmation on a lower timeframe—such as a bearish break of structure or an internal Gap forming during the retracement. A 5-minute timeframe can often give early signs of rejection or supply stepping in. Being patient and allowing the market to reveal intent is crucial, especially after liquidity-driven moves like this.
Final Thoughts
Price doesn’t move randomly—it seeks liquidity and fills inefficiencies. This chart beautifully illustrates that logic, from engineered consolidation to a manipulative sweep, and now potentially toward rebalancing.
If you found this breakdown helpful, I’d really appreciate a like—it helps support the work and keeps this kind of content going. Let me know in the comments what you think, or if you’re seeing it differently. I'm always up for a good discussion.

#USOIIL #WTI 1H📈 #USOIL 1H Buy Setup – Liquidity Sweep in Play
Crude Oil is consolidating after a sharp decline, forming a potential setup for a liquidity sweep below the current range, followed by a bullish reversal. We're anticipating a fakeout move to grab sell-side liquidity before price targets the Fair Value Gap (FVG) and premium supply zone above.
🟩 Buy Limit: 64.50 / 64.00
🎯 Targets: 70.00 → 72.00+
❌ Stop Loss: 63.00
This setup offers high risk-to-reward potential if the liquidity sweep plays out as expected. Monitor price action closely at the buy zone.
#CrudeOil #WTI #SmartMoney #TradingStrategy

Gold price analysis July 1On the D1 chart, the price has recovered positively when the candle closed above 50% of the decrease range of last Friday's session. This shows that buying power is returning and a new uptrend is forming, with the target heading towards the GAP zone around 3363.
Today's trading strategy:
Prioritize buying (BUY) if the price has a correction to the support zone of 3300.
Sell strategy should only be implemented at important resistance zones, with short-term profit expectations because the main trend is leaning towards the uptrend.
Important technical levels:
Support: 3300 - 3337 - 3360
Resistance: 3334 - 3348 - 3363

Another RR2 Position On EURUSDThesis: EUR/USD is showing signs of exhaustion near the 1.1800 psychological resistance, with price rejecting the upper band of a recent range.
Entry: 🔻 Sell at 1.17883 (current price action confirms rejection)
Stop-Loss: 🔺 1.17943 – Above recent swing high and psychological resistance
Take-Profit: ✅ 1.17767 – Targeting the lower bound of the recent range and prior support
Risk-Reward Ratio: ~1:2 – High conviction setup with tight risk and extended downside potential

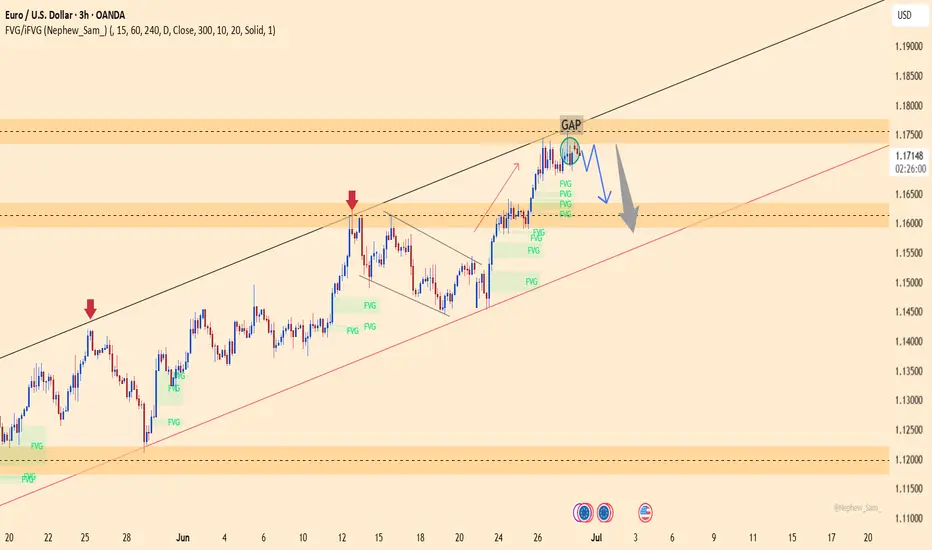
EURUSD – Bearish Pressure IntensifiesEURUSD is currently facing rejection at the GAP resistance area near 1.17350, combined with a lower high structure forming within the ascending channel. Price action shows clear signs of weakness after filling the GAP, and the aligned FVG zones below suggest a potential for deeper downside.
If the price remains capped below 1.17350, there is a high probability of a pullback toward the 1.16300 support area — which aligns with the long-term ascending trendline. A break below this level could extend the bearish move toward the deeper region near 1.14500.
Supporting Fundamentals:
Strong US Core PCE → reinforces expectations that the Fed will keep rates higher for longer.
Weak EU manufacturing PMI → puts pressure on the euro.
FOMC minutes and NFP — if hawkish — could strengthen the USD and weigh further on EURUSD.
XAUUSD – Technical pullback before a breakout?On the 4H chart, gold is consolidating just below the descending trendline after a correction from $3,389 to the support zone at $3,252. The current price structure suggests continued range-bound movement between $3,252 and $3,318 before a potential breakout. If price breaks above the trendline, the next target could be the resistance zone at $3,389.
From a news perspective, the easing of Iran–Israel tensions has slightly reduced safe-haven demand, putting short-term pressure on gold. However, the US dollar remains at a 3-year low, and concerns over the US government’s $3.3–3.9 trillion tax reform package are fueling fears of a widening deficit—both of which support a bullish outlook for gold.
In summary, watch how price reacts to the trendline. A confirmed breakout could send gold surging toward the $3,389 zone.

July Seasonality Patterns For Index, Metals and ForexSeasonality can be a useful tool if used wisely (and in context) with current sentiment and news flows. Seasonality really is a backwards looking indicator that can easily be overpowered by key macro drivers. But its strength comes in to play when seasonality aligns with the macro landscape.
With that in mind, I share my seasonality matrix for indices, metals and USD FX pairs to highlight potential patterns for July, then wrap up with an update on my Nasdaq 100 analysis.
Matt Simpson, Market Analyst at City Index and Forex.com.

Gold Trading Strategy for 500 Pips !Dear friends!
The exit from the bearish channel has led to an impressive price increase. At the time of writing, the financial market is trading above the $3,300 mark. The uptrend is very strong as it consolidates at high levels with stable trading activity on the 2-hour time frame.
Therefore, the upcoming reports on US employment and manufacturing are highly anticipated. This has contributed to the market being hotter than ever. The price increase is expected to reach $3,385, if the Fed signals monetary policy easing. What do you think about this? Do you agree with me?

Gold (XAUUSD) – July 1 Analysis📍 H4 Key LH Zone: 3348.500 – 3350.500
This is a major decision zone.
Current market structure:
🔸 M15 is in an uptrend with confirmed ChoCh + BoS
What to watch:
We’re approaching the H4 LH supply zone — now we observe how price behaves here.
🔹 If price breaks above this H4 LH zone:
→ HTF and LTF trends align to the upside
→ Potential continuation of the bullish move
🔹 If price respects and stays below this LH zone:
→ Then this recent up-move could be a pullback
→ We may see a new low forming — so be cautious
📍 M15 Zones for Long Setup (if confirmed):
• 3309.500 – 3312.500 (Order Block Zone)
• 3302.500 – 3304.600 (Demand Zone)
We will watch these levels closely.
If price respects these zones and gives M1 confirmation (ChoCh + BoS) — we’ll plan for long entries accordingly.
📖 Let structure guide your decisions. Let price speak first.
📘 Shared by @ChartIsMirror
Author of The Chart Is The Mirror — a structure-first, mindset-grounded book for traders

EURJPY Readies Triangle Breakout w/ Elliot WaveOANDA:EURJPY has formed a Triangle Pattern with a Rising Support and Resistance Zone @ 169.5 - 169.7 area.
After the False Breakout last week on Friday, we see Price falls back within the Pattern and finds strong Resistance from the zone.
Now based from the High - to Low - to Lower High where price made a 50% - 61.8% Retracement, we can plot the Trend Based-Fib Tool that suggests with the change of trend ( Price printing a Lower High ) we can expect Lower Prices to come and potentially a Bearish Breakout to the pattern!
First we will want to see where the next Lower Low will be ( currently @ 168.934 ) then wait for a Retracement to a favorable Fibonacci Level based from the Lower High to Lower Low.
Fundamentally, the EUR will have CPI Flash Estimates on Tuesday, and multiple Services PMI on Thursday with ECB President Lagarde speaking Tuesday and Wednesday. This could add volatility!!
Stay Tuned!

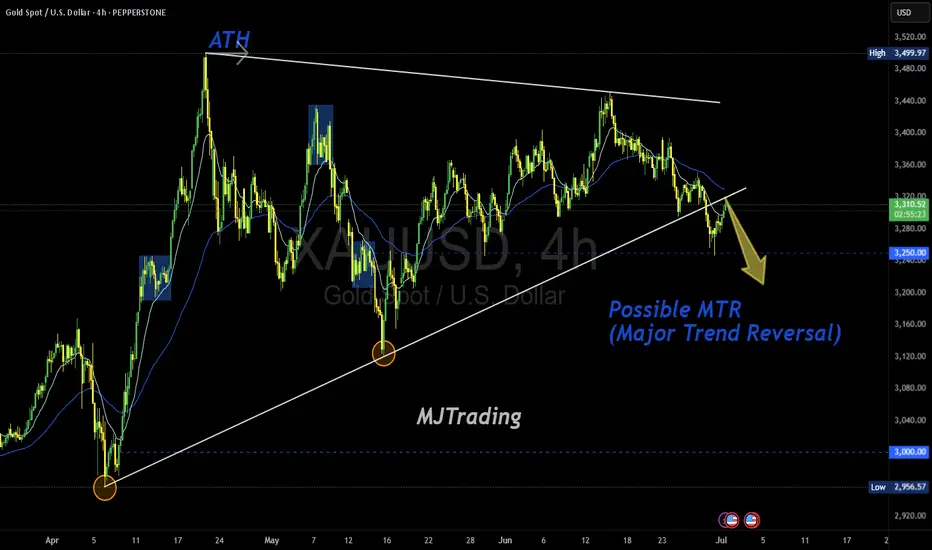
Possible MTR in Play (TBC)Gold has printed a textbook structure for a potential Major Trend Reversal (MTR) off the ATH zone, with a clean rejection and a shift in character. The descending trendline from the top aligns with lower highs, while the ascending base from April is now under pressure.
📌 Key Levels to Watch:
3,280.0 – neckline of the potential MTR
3,250.00 – psychological magnet and structural support
3,000.00 – major downside target if the reversal confirms
🧠 “Markets top on euphoria, not logic.” If price breaks and retests the neckline with momentum, the MTR thesis gains traction. Until then — TBC.
#XAUUSD #Gold #MajorTrendReversal #MTR #PriceAction #TechnicalAnalysis #GoldBears #ATHRejection #TrendShift #MJTrading