SILVER Sellers In Panic! BUY!
My dear friends,
Please, find my technical outlook for SILVER below:
The price is coiling around a solid key level - 35.993
Bias -Bullish
Technical Indicators: Pivot Points Low anticipates a potential price reversal.
Super trend shows a clear buy, giving a perfect indicators' convergence.
Goal - 36.378
About Used Indicators:
The pivot point itself is simply the average of the high, low and closing prices from the previous trading day.
Disclosure: I am part of Trade Nation's Influencer program and receive a monthly fee for using their TradingView charts in my analysis.
———————————
WISH YOU ALL LUCK
Forex

NZD/CHF Heist Blueprint: Snag the Kiwi vs. Franc Profits!Ultimate NZD/CHF Heist Plan: Snag the Kiwi vs. Franc Loot! 🚀💰
🌍 Greetings, Wealth Raiders! Hola! Ciao! Bonjour! 🌟
Fellow money chasers and market bandits, 🤑💸 let’s dive into the NZD/CHF "Kiwi vs. Franc" Forex heist with our 🔥Thief Trading Style🔥, blending sharp technicals and solid fundamentals. Follow the charted strategy for a long entry, aiming to cash out near the high-risk ATR zone. Watch out for overbought signals, consolidation, or a trend reversal trap where bearish robbers lurk. 🏴☠️💪 Seize your profits and treat yourself—you’ve earned it! 🎉
Entry 📈
The vault’s open wide! 🏦 Grab the bullish loot at the current price—the heist is live! For precision, set Buy Limit orders on a 15 or 30-minute timeframe, targeting a retest of the nearest high or low.
Stop Loss 🛑
📍 Place your Thief SL at the recent swing low on a 4H timeframe for day trades.
📍 Adjust SL based on your risk tolerance, lot size, and number of orders.
Target 🎯
Aim for 0.50400 or slip out early to secure your loot! 💰
Scalpers, Listen Up! 👀
Stick to long-side scalps. Got big capital? Jump in now! Smaller stacks? Join swing traders for the robbery. Use a trailing SL to lock in your gains. 🧲💵
NZD/CHF Market Intel 📊
The Kiwi vs. Franc is riding a bullish wave, fueled by key drivers. Dig into the fundamentals, macro trends, COT reports, sentiment, intermarket analysis, and future targets for the full scoop. 🔗👇
⚠️ Trading Alert: News & Position Safety 📰
News drops can shake the market! To protect your loot:
Skip new trades during news releases.
Use trailing stops to secure profits and limit losses. 🚫
Join the Heist! 💥
Support our robbery plan—hit the Boost Button! 🚀 Let’s stack cash with ease using the Thief Trading Style. 💪🤝 Stay sharp for the next heist plan, bandits! 🤑🐱👤🎉

BTCUSD – Major Decision Point at The Edge📍 By: MJTrading |||
Bitcoin has rallied sharply from ~$98K and is now testing a critical confluence zone — the top of the descending channel and a strong supply area, known as "The Edge."
EMAs are turning up, supporting bullish momentum
⏳ What’s Next?
At this stage, two scenarios emerge:
⚠️ This is a make-or-break zone:
🟩 Breakout above the channel signals trend reversal → next resistance: $111K
🟨 Rejection leads to a move back to the $103K or $100K levels
This setup offers a high-RR opportunity for both breakout traders and mean reversion players.
🧠 Trade the reaction at the edge, not the prediction.
Thanks for your attention...
Share your thoughts...
—
#BTCUSD #Bitcoin #CryptoTrading #TheEdge #BreakoutOrBounce #CryptoSetup #DescendingChannel #SmartMoney #TechnicalAnalysis #PriceAction #SwingTrade #EMA #RiskReward #MJTrading #4hChart #TrendDecision #SupplyZone

US500 Will Go Up! Long!
Take a look at our analysis for US500.
Time Frame: 1D
Current Trend: Bullish
Sentiment: Oversold (based on 7-period RSI)
Forecast: Bullish
The market is testing a major horizontal structure 6,165.52.
Taking into consideration the structure & trend analysis, I believe that the market will reach 6,451.04 level soon.
P.S
The term oversold refers to a condition where an asset has traded lower in price and has the potential for a price bounce.
Overbought refers to market scenarios where the instrument is traded considerably higher than its fair value. Overvaluation is caused by market sentiments when there is positive news.
Disclosure: I am part of Trade Nation's Influencer program and receive a monthly fee for using their TradingView charts in my analysis.
Like and subscribe and comment my ideas if you enjoy them!

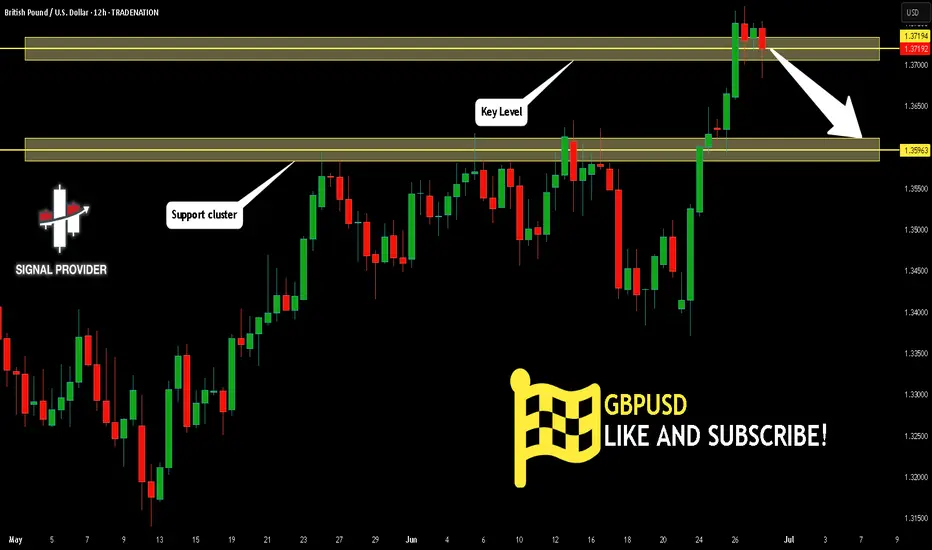
GBPUSD Will Move Lower! Short!
Please, check our technical outlook for GBPUSD.
Time Frame: 12h
Current Trend: Bearish
Sentiment: Overbought (based on 7-period RSI)
Forecast: Bearish
The market is approaching a key horizontal level 1.371.
Considering the today's price action, probabilities will be high to see a movement to 1.359.
P.S
We determine oversold/overbought condition with RSI indicator.
When it drops below 30 - the market is considered to be oversold.
When it bounces above 70 - the market is considered to be overbought.
Disclosure: I am part of Trade Nation's Influencer program and receive a monthly fee for using their TradingView charts in my analysis.
Like and subscribe and comment my ideas if you enjoy them!
NG1! BEARS ARE GAINING STRENGTH|SHORT
NG1! SIGNAL
Trade Direction: short
Entry Level: 3.737
Target Level: 3.205
Stop Loss: 4.089
RISK PROFILE
Risk level: medium
Suggested risk: 1%
Timeframe: 1D
Disclosure: I am part of Trade Nation's Influencer program and receive a monthly fee for using their TradingView charts in my analysis.
✅LIKE AND COMMENT MY IDEAS✅

EUR/NZD SELLERS WILL DOMINATE THE MARKET|SHORT
Hello, Friends!
EUR/NZD pair is trading in a local uptrend which we know by looking at the previous 1W candle which is green. On the 17H timeframe the pair is going up too. The pair is overbought because the price is close to the upper band of the BB indicator. So we are looking to sell the pair with the upper BB line acting as resistance. The next target is 1.915 area.
Disclosure: I am part of Trade Nation's Influencer program and receive a monthly fee for using their TradingView charts in my analysis.
✅LIKE AND COMMENT MY IDEAS✅

Master Your Edge: It’s Not About Just Being Right
Most traders obsess over being right on every trade. But the truth is, consistent profitability doesn’t come from perfect predictions—it comes from disciplined risk management.
Mark Douglas reminds us:
“Trading is not about being right or wrong. It’s about how much you make when you’re right and how much you lose when you’re wrong.”
Focus less on proving yourself right, and more on protecting your capital when you’re wrong. That’s how professionals thrive in uncertain markets.
#MJTrading
#TradingPsychology #MarkDouglas #ForexMindset #TraderMindset #EURUSD #TradingQuotes #ForexLife #RiskManagement #TradingDiscipline #ForexEducation #ChartOfTheDay #PriceAction #MindOverMarkets
USDJPY Potential UpsidesHey Traders, in tomorrow's trading we are monitoring USDJPY for a buying opportunity around 144.400 zone, USDJPY is trading in an uptrend and currently is in a correction phase in which it is approaching the trend at 144.400 support and resistance area.
Trade safe, Joe.

EURUSD: Support & Resistance Analysis for Next Week 🇪🇺🇺🇸
Here is my latest structure analysis
and important supports & resistances for EURUSD for next week.
Consider these structures for pullback/breakout trading.
❤️Please, support my work with like, thank you!❤️
I am part of Trade Nation's Influencer program and receive a monthly fee for using their TradingView charts in my analysis.

AUD/USD: The Rebound TradeThe Australian dollar (also known as the Aussie Battler) looks set to continue its recent bounce. Inflation is now under control and monetary easing will continue to support aggregate demand across the economy. While rate cuts are dovish, the underlying economy is still strong and, as we will explain below, the fiscal situation is shaping up better than expected. Stability is in.
The real action, though, is in the US. Unemployment is creeping up. Jobless claims are ticking higher. Existing home sales are falling. The US consumer is feeling the pinch. That puts pressure on the Fed. Rate cuts are back in the conversation. Markets are already pricing in the first move later this year. The US dollar is losing its grip.
AUD/USD recently tested its 200 day moving average and held firm. That’s more than just a technical level. It’s a psychological line in the sand. The Aussie held its ground.
There’s more. Australia’s fiscal position is likely to come in stronger than expected. Mining exports are holding up. Volumes are rising. That supports the budget bottom line and underpins the Aussie’s credibility as a resource backed currency. This is in stark contrast to most of the developed world, where peers are running large deficits.
This isn’t just about central banks. The global economy is shifting gears. China is stabilising. Industrial demand is returning. Commodity prices are finding a floor. That’s key for the Aussie. It’s still a commodity linked currency. As iron ore and copper pick up, the AUD should follow.
There’s a window here. Over the next twelve months, the AUD has room to move higher, testing the 0.7000 range. Not because Australia is booming, but also because the US is slowing. The Fed is running out of steam. That flips the dynamic. We’re moving from USD strength to USD softness.
The setup is clear. A soft landing in the US. A stable China. Commodities firming. And an RBA on hold. That’s a cocktail for AUD strength.
The bounce has just begun.
The forecasts provided herein are intended for informational purposes only and should not be construed as guarantees of future performance. This is an example only to enhance a consumer's understanding of the strategy being described above and is not to be taken as Blueberry Markets providing personal advice.

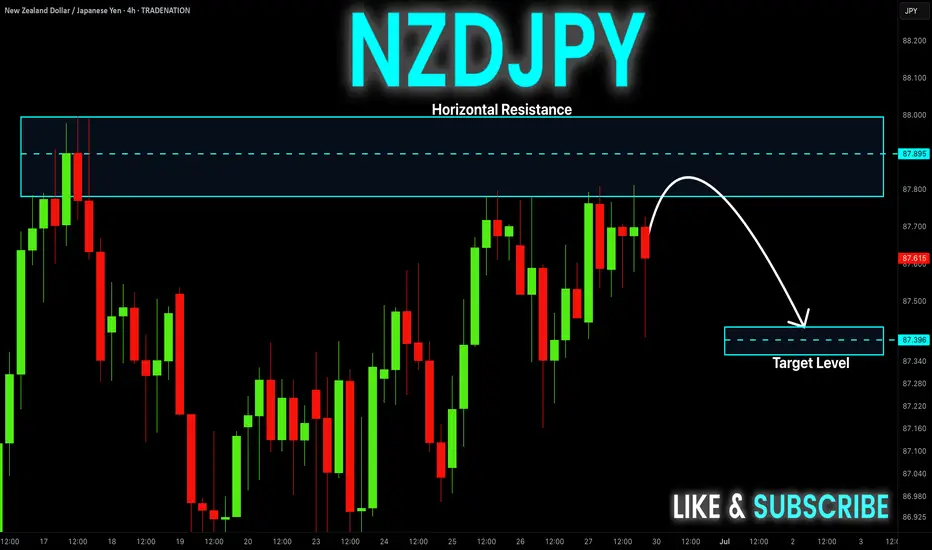
NZD-JPY Potential Short! Sell!
Hello,Traders!
NZD-JPY is slowly approaching
A horizontal resistance level
Around 87.994 so despite
The strong uptrend
We will be expecting a
Local bearish pullback on Monday
Sell!
Comment and subscribe to help us grow!
Check out other forecasts below too!
Disclosure: I am part of Trade Nation's Influencer program and receive a monthly fee for using their TradingView charts in my analysis.
GBP_CHF RISKY LONG|
✅GBP_CHF fell down sharply
But a strong support level was hit at 1.0932
Thus as a rebound is already happening
A move up towards the target of 1.0970 shall follow
LONG🚀
✅Like and subscribe to never miss a new idea!✅
Disclosure: I am part of Trade Nation's Influencer program and receive a monthly fee for using their TradingView charts in my analysis.

NZD_JPY SHORT FROM RESISTANCE|
✅NZD_JPY is set to retest a
Strong resistance level above at 88.000
After trading in a local uptrend for some time
Which makes a bearish pullback a likely scenario
With the target being a local support below at 87.341
SHORT🔥
✅Like and subscribe to never miss a new idea!✅
Disclosure: I am part of Trade Nation's Influencer program and receive a monthly fee for using their TradingView charts in my analysis.

CHF-JPY Local Long! Buy!
Hello,Traders!
CHF-JPY is trading in a strong
Uptrend and the pair made a
Bullish breakout from the bullish
Triangle pattern and is now seems
To be consolidating above the
Support cluster around 180.740
So we are bullish biased and
We will be expecting a further
Bullish move up on Monday
Buy!
Comment and subscribe to help us grow!
Check out other forecasts below too!
Disclosure: I am part of Trade Nation's Influencer program and receive a monthly fee for using their TradingView charts in my analysis.

AUD_NZD LOCAL LONG|
✅AUD_NZD is trading along the rising support line
And as the pair is going up now
After the retest of the line
I am expecting the price to keep growing
To retest the supply levels above at 1.0789
LONG🚀
✅Like and subscribe to never miss a new idea!✅
Disclosure: I am part of Trade Nation's Influencer program and receive a monthly fee for using their TradingView charts in my analysis.

Gold Extends Decline Amid Easing Safe-Haven DemandGold continues its downward trajectory as safe-haven sentiment weakens. Geopolitical tensions between Iran and Israel appear to be easing following a ceasefire agreement, reducing the perceived need for defensive assets such as gold.
At the same time, the market is reassessing its expectations regarding U.S. monetary policy. With the Federal Reserve unlikely to cut interest rates in the near term—and concerns about inflation resurfacing due to potential tax policy changes under former President Donald Trump—gold is facing a dual source of short-term pressure.
Investor sentiment is currently shifting toward riskier assets, as capital flows increasingly favor equities over gold. This risk-on environment has further eroded demand for traditional safe havens.
From a technical perspective, gold failed to break above the $3,350 level, signaling waning bullish momentum. This may indicate the onset of a short-term corrective phase.
On the political front, recent remarks by Donald Trump—including the possibility of a long-term diplomatic solution with Iran and discussions around replacing Fed Chair Jerome Powell—have introduced additional volatility into global financial markets.
Furthermore, according to market data I have reviewed, gold sales in the second quarter have shown signs of slowing. Buyers are becoming more cautious amid elevated price levels, while many investors are choosing to take profits, contributing to an increasingly two-sided market dynamic.
Despite this, I maintain a positive medium- to long-term outlook for gold. The U.S. dollar is currently at its weakest point in three and a half years, offering significant support. Notably, central banks managing over $5 trillion in assets are planning to increase their gold reserves within the next one to two years—a strong structural driver for gold’s long-term growth.
In summary, I believe gold is currently experiencing short-term corrective pressure due to a combination of geopolitical developments, interest rate expectations, and shifting investor sentiment. However, its long-term outlook remains solid, supported by a weaker dollar, global macroeconomic risks, and continued central bank accumulation.

USD-CHF Will Fall! Sell!
Hello,Traders!
USD-CHF keeps falling down
And the pair broke the key
Horizontal level of 0.8090
Decisively so we are bearish
Biased and we will be expecting
A further move down next week
Sell!
Comment and subscribe to help us grow!
Check out other forecasts below too!
Disclosure: I am part of Trade Nation's Influencer program and receive a monthly fee for using their TradingView charts in my analysis.

NZDUSD Hits Channel Top Bearish Momentum BuildingNZDUSD pair has touched a key resistance zone near the top of its rising channel and is showing early signs of rejection. This technical inflection point aligns with weakening New Zealand economic sentiment and renewed strength in the US dollar. The stage is set for a bearish rotation, with several support targets now in focus if momentum continues to build to the downside.
📉 Current Bias: Bearish
NZDUSD has failed to break above the 0.6085–0.6090 resistance area, marking repeated rejections at the channel’s upper boundary. Price action and structure suggest a potential move back toward 0.6000 and deeper levels such as 0.5960 and 0.5910 if support fails.
🔍 Key Fundamentals:
RBNZ on Hold and Dovish Leaning: The Reserve Bank of New Zealand has paused its tightening cycle, with Governor Orr signaling no urgency to hike further amid weakening domestic demand and subdued inflation momentum.
US Dollar Support: The USD is gaining traction amid Fed officials maintaining a hawkish hold tone, and with markets paring back bets on near-term rate cuts due to sticky inflation and resilient labor data.
NZ Economic Weakness: New Zealand’s growth has stagnated, with recent trade and retail data underwhelming. Business sentiment remains subdued, adding to downside Kiwi pressure.
⚠️ Risks to the Trend:
Soft US Data: Any major downside surprise in upcoming US labor market or inflation figures could reignite Fed rate cut bets and weigh on the dollar, lifting NZDUSD.
China Rebound: As China is a major trading partner for New Zealand, any strong recovery signs or stimulus headlines out of Beijing could buoy NZD on improved trade expectations.
Unexpected RBNZ Hawkishness: If the RBNZ pivots back to a more aggressive tone due to inflation persistence, NZD could find renewed strength.
📅 Key News/Events Ahead:
US PCE Inflation (June 28): Core metric closely watched by the Fed; any surprise will directly impact USD flows.
NZIER QSBO Survey (July 2): Offers insight into New Zealand business confidence.
US ISM Manufacturing & NFP (July 1–5): Major USD drivers with implications for broader market sentiment.
⚖️ Leader or Lagger?
NZDUSD is currently a lagger, often following directional shifts in USD majors like EURUSD and AUDUSD. However, due to its sensitivity to Chinese data and Fed rate expectations, it may accelerate moves once broader USD sentiment is established.
🎯 Conclusion:
NZDUSD looks poised for a bearish pullback from the channel top, with a confluence of macro and technical factors suggesting pressure toward 0.6000, 0.5960, and potentially 0.5910. While downside momentum builds, attention must remain on US data, China headlines, and RBNZ commentary for any sentiment shift. Bears hold the upper hand for now, but risk events ahead could challenge the momentum.

EUR-NZD Bullish Bias! Buy!
Hello,Traders!
EUR-NZD is trading in a
Strong uptrend and the pair
Is printing higher highs and
Higher lows while breaking
Important key levels such
As 1.9270 which is now
A support and the pair
Is consolidating above the
New support so we are
Bullish biased and we will
Be expecting a further move
Further up on Monday
Buy!
Comment and subscribe to help us grow!
Check out other forecasts below too!
Disclosure: I am part of Trade Nation's Influencer program and receive a monthly fee for using their TradingView charts in my analysis.


Bitcoin Bounced Right Where It ShouldBitcoin continues to respect the script — breakout, clean retest, and now holding strong.
The 50 EMA has been a reliable dynamic support throughout the entire uptrend, and once again, it helped catch the recent dip. Price has now successfully retested the breakout zone and is starting to bounce.
Structure looks healthy, momentum is building, and unless the support fails, the next leg up could be just around the corner.
Simple setups. No noise. Just trend.
DYOR, NFA

USOIL: Long Trading Opportunity
USOIL
- Classic bullish pattern
- Our team expects retracement
SUGGESTED TRADE:
Swing Trade
Buy USOIL
Entry - 65.03
Stop - 62.60
Take - 69.73
Our Risk - 1%
Start protection of your profits from lower levels
Disclosure: I am part of Trade Nation's Influencer program and receive a monthly fee for using their TradingView charts in my analysis.
❤️ Please, support our work with like & comment! ❤️
