Nasdaq Hits New ATH at $22,570 – Eyes Now on $23,200 and $24,000By analyzing the #Nasdaq chart on the weekly timeframe, we can see that the index followed our previous analysis perfectly, hitting the $22,400 target and printing a new all-time high at $22,570!
Momentum remains strong and bullish, and we expect price to continue climbing toward the next targets. Based on the original projection, upcoming targets are $23,200 and $24,000.
Stay tuned for the next update!
Please support me with your likes and comments to motivate me to share more analysis with you and share your opinion about the possible trend of this chart with me !
Best Regards , Arman Shaban
Forex

EURCAD My Opinion! SELL!
My dear friends,
Please, find my technical outlook for EURCAD below:
The instrument tests an important psychological level 1.6006
Bias - Bearish
Technical Indicators: Supper Trend gives a precise Bearish signal, while Pivot Point HL predicts price changes and potential reversals in the market.
Target - 1.5978
About Used Indicators:
Super-trend indicator is more useful in trending markets where there are clear uptrends and downtrends in price.
Disclosure: I am part of Trade Nation's Influencer program and receive a monthly fee for using their TradingView charts in my analysis.
———————————
WISH YOU ALL LUCK

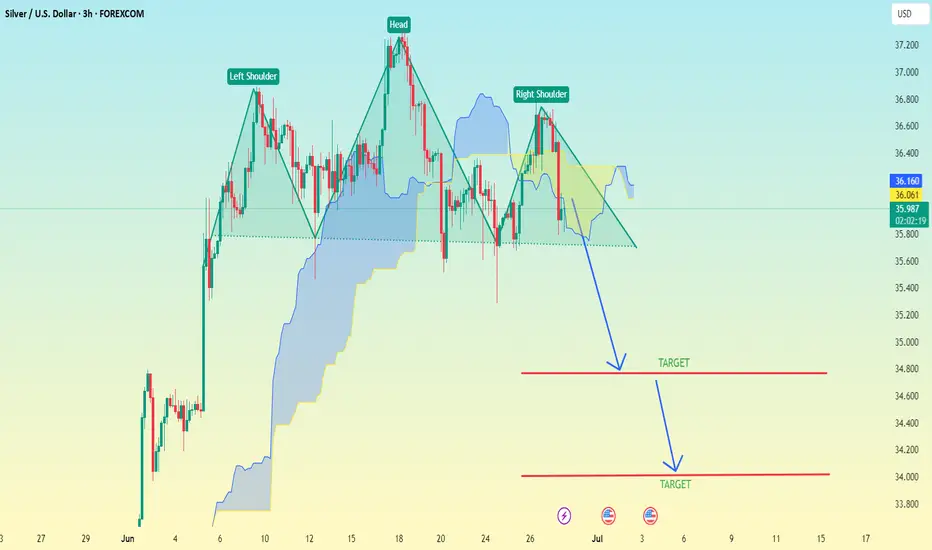
(XAG/USD – Silver vs USD–3h timeframe) Head and Shoulder Pattern(XAG/USD – Silver vs USD – 3h timeframe), a Head and Shoulders pattern is clearly marked, which is a bearish reversal signal.
Key Details:
Pattern: Head and Shoulders
Neckline: Approximately at the 35.90–36.00 level
Breakout Direction: Down
Measured Move Target Method: To estimate the target, subtract the height from the head to the neckline from the neckline level.
---
Target Estimation:
Head High: ~36.95
Neckline Level: ~35.90
→ Difference: 36.95 - 35.90 = 1.05
Target 1 (conservative): 35.90 - 1.05 = 34.85
Target 2 (aggressive): Based on the secondary arrow and extended support, it's pointing toward ~34.00–34.20
---
📉 Final Targets:
✅ First Target: 34.85
✅ Second Target: 34.00–34.20 (if bearish momentum continues)
Let me know if you want stop-loss or risk management levels included.
GOLD Trading Opportunity! BUY!
My dear subscribers,
GOLD looks like it will make a good move, and here are the details:
The market is trading on 3270.6 pivot level.
Bias - Bullish
My Stop Loss - 3260.7
Technical Indicators: Both Super Trend & Pivot HL indicate a highly probable Bullish continuation.
Target - 3289.4
About Used Indicators:
The average true range (ATR) plays an important role in 'Supertrend' as the indicator uses ATR to calculate its value. The ATR indicator signals the degree of price volatility.
Disclosure: I am part of Trade Nation's Influencer program and receive a monthly fee for using their TradingView charts in my analysis.
———————————
WISH YOU ALL LUCK

SELL: USDJPY 144.75 Trade Recommendation – 1H Chart🎯 Trade Setup:
Sell Entry Zone: 144.75 – 144.78
Stop Loss (SL): 145.15
Take Profit (TP): 142.60
Risk:Reward Ratio (R:R): Approx. 1:4 → Excellent for swing or intraday setups
📊 Technical Analysis Breakdown:
1. Strong Resistance Zone – High Reversal Probability:
The 144.75–144.78 zone:
A clear historical resistance area with multiple rejections in the past
Converges with the SMA 89 (red line) → acts as a strong dynamic resistance
Price has consistently formed lower highs around this region → showing selling pressure is building
2. Volume Analysis – Distribution Signals:
Volume slightly increased as price approached the resistance but did not accompany a breakout
No “breakout volume” → Indicates possible distribution phase, not accumulation → Favoring SELL positions
3. Price Action & Pattern:
The structure is forming lower highs – a key sign of bearish momentum
After the sharp rejection from the 145.22 zone (June 26), the market has shifted toward a bearish correction cycle
4. Target Area – Key Support:
142.60 is a well-defined support level:
Matches a previous major low
Corresponds with a high-liquidity zone from prior trading sessions
Ideal area to take profit before any potential bounce
⚠️ Risk Management Notes:
Trade confirmation increases if you see bearish candlestick signals (e.g., bearish engulfing, pin bar) in the entry zone
Exit immediately if price breaks and closes above 145.15 with strong volume – that invalidates the bearish setup

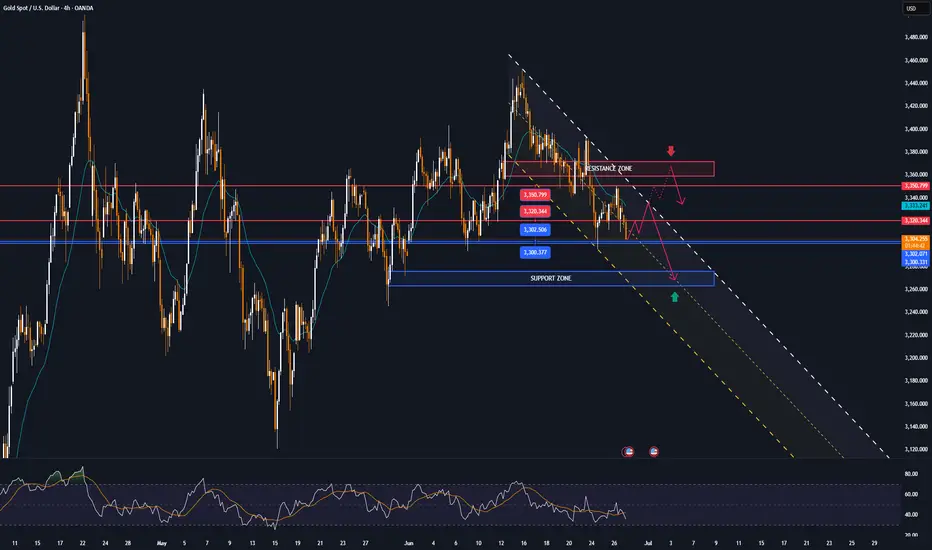
GOLD recovers, capped by $3,350, trend viewOANDA:XAUUSD recovered then weakened as it failed to break above $3,350, supported by a weaker dollar and market uncertainty sparked by reports that U.S. President Donald Trump could replace Federal Reserve Chairman Jerome Powell in September or October. The reports raised concerns about the future independence of the Federal Reserve, boosting demand for safe-haven gold.
On Wednesday, Trump called Powell “terrible” and said he was considering three or four candidates to replace him. Meanwhile, the Wall Street Journal reported that Trump was even considering announcing a potential successor as early as September or October.
The current market narrative is that once Trump nominates a new Fed chair, market expectations will tend to favor a more “dovish” Fed. This could lead to a weaker US dollar, higher long-term US Treasury yields and higher stock prices.
Forexlive points out that this story may be more an emotional reaction than a result of objective and rational thinking. The policy of the FOMC (Federal Open Market Committee) is decided not only by the Fed Chairman but also by a majority vote of the 12 voting members (including 7 directors and 5 regional Fed presidents). The Fed Chairman does have a lot of influence, but he does not have absolute control over monetary policy. The Fed was originally designed to be independent of political pressure.
Moreover, even if Trump nominates the next chairman, there is no guarantee that this will automatically lead to a rate cut. In fact, Powell was also nominated by Trump, but his monetary policy decisions are still based on professional judgment rather than serving Trump's wishes.
So, in the worst case, the market could face policy uncertainty as differences between FOMC members increase and more disagreements emerge. Currently, there are fewer moderate members on the committee, while neutral or hawkish members dominate.
Markets are now focused on personal consumption expenditure (PCE) data due later today (Friday) for further clues on whether the Federal Reserve will cut interest rates.
On the geopolitical front, a ceasefire between Israel and Iran appeared to be in place on Wednesday after Trump hailed a swift end to the 12-day conflict at the NATO summit and said he would seek a commitment from Iran to abandon its nuclear ambitions in talks next week.
Technical Outlook Analysis OANDA:XAUUSD
On the daily chart, after gold recovered and reached the initial target at 3,350 USD, the nearest resistance is also the price point of the EMA21 noted for readers in the previous publication.
However, the recovery momentum is currently weakening, specifically at the time of writing, the gold price is falling below 3,320 USD. Gold falling below 3,320 USD provides conditions for a possible decline with the next target around 3,302 - 3,300 USD, which is the area of the 0.382% Fibonacci retracement confluence with the lower edge of the price channel.
In terms of momentum, the RSI is heading down and breaking below 50, which should be considered an initial bearish signal.
Overall, gold does not have a clear long-term trend as the uptrend is still the main trend, while the momentum is showing signs of decline.
But personally, I am still leaning towards the uptrend, and continue to look for positions to buy.
Finally, the notable positions will be listed as follows.
Support: 3,302 – 3,300 USD
Resistance: 3,320 – 3,350 – 3,371 USD
SELL XAUUSD PRICE 3367 - 3365⚡️
↠↠ Stop Loss 3371
→Take Profit 1 3359
↨
→Take Profit 2 3353
BUY XAUUSD PRICE 3272 - 3274⚡️
↠↠ Stop Loss 3268
→Take Profit 1 3280
↨
→Take Profit 2 3286
USD_CHF BEARISH BREAKOUT|SHORT|
✅USD_CHF broke the key structure level of 0.8050
While trading in a strong downtrend
Which makes me bearish
And I think that after the retest of the broken level is complete
A bearish continuation will follow
SHORT🔥
✅Like and subscribe to never miss a new idea!✅
Disclosure: I am part of Trade Nation's Influencer program and receive a monthly fee for using their TradingView charts in my analysis.

USDCAD Strongest long-term Sell in the market right now.At the beginning of the year (January 15, see chart below), we made an unpopular bearish call at the time, hinting that the USDCAD pair was approaching its Resistance Zone, hence a multi-year Top was in order:
As you can see, the moment the price hit that Resistance Zone, it got instantly rejected and a new Bearish Leg started, which has extended up to this day. This time we view this on the 1M time-frame where the Support levels are more clearly illustrated.
More particularly, the 1M MA50 (blue trend-line) poses as the first one, in fact it has been holding since September 2022. Our Target is still located at 1.26000, which is marginally above the 0236 Fibonacci level, which has been the 1st Target during both previous Bearish Legs. Also it is where the 1M MA200 (orange trend-line) is headed to, and there are high chances of a long-term bounce there.
-------------------------------------------------------------------------------
** Please LIKE 👍, FOLLOW ✅, SHARE 🙌 and COMMENT ✍ if you enjoy this idea! Also share your ideas and charts in the comments section below! This is best way to keep it relevant, support us, keep the content here free and allow the idea to reach as many people as possible. **
-------------------------------------------------------------------------------
Disclosure: I am part of Trade Nation's Influencer program and receive a monthly fee for using their TradingView charts in my analysis.
💸💸💸💸💸💸
👇 👇 👇 👇 👇 👇

EURUSD – Waiting for Deeper Liquidity Sweep into Extreme POIExpecting EURUSD to sweep liquidity below 1.1660 and drop into the Extreme POI (~1.1600–1.1640). Watching for lower timeframe reversal signals to go long. Targeting 1.1732 initially, extended target near 1.1790. Invalidation below 1.1580.

HelenP. I Gold will rebound up from trend line to $3400 levelHi folks today I'm prepared for you Gold analytics. After looking at this chart, we can see how the price after a prolonged consolidation inside a large wedge pattern, XAUUSD, approached the ascending trend line again - this line has acted as a key support several times in the past. This time is no exception: the price reacted to it with a bullish bounce. We can see a confluence here — trend line support coincides with the lower boundary of the wedge and the local support zone at 3270 - 3250 points. Now the price is trading above this line, showing early signs of recovery. Given the symmetry of this structure and past behavior, I expect gold to continue rising from current levels. The nearest major obstacle lies in the resistance zone around 3400 - 3420, which acted as a turning point before. That’s why my current goal is set at the 3400 level. If bulls hold the trend line, we may see a steady move toward this key resistance. Given the trend line reaction, wedge structure, and current momentum, I remain bullish and expect further growth. If you like my analytics you may support me with your like/comment ❤️
Disclaimer: As part of ThinkMarkets’ Influencer Program, I am sponsored to share and publish their charts in my analysis.

GOLD Will Grow! Long!
Here is our detailed technical review for GOLD.
Time Frame: 1h
Current Trend: Bullish
Sentiment: Oversold (based on 7-period RSI)
Forecast: Bullish
The market is trading around a solid horizontal structure 3,290.38.
The above observations make me that the market will inevitably achieve 3,315.54 level.
P.S
We determine oversold/overbought condition with RSI indicator.
When it drops below 30 - the market is considered to be oversold.
When it bounces above 70 - the market is considered to be overbought.
Disclosure: I am part of Trade Nation's Influencer program and receive a monthly fee for using their TradingView charts in my analysis.
Like and subscribe and comment my ideas if you enjoy them!

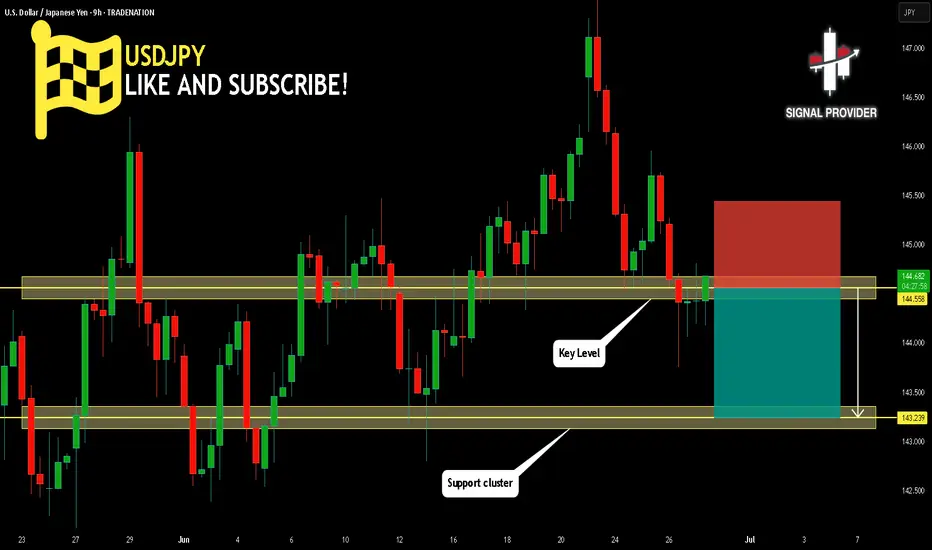
USDJPY Will Go Lower From Resistance! Sell!
Take a look at our analysis for USDJPY.
Time Frame: 9h
Current Trend: Bearish
Sentiment: Overbought (based on 7-period RSI)
Forecast: Bearish
The market is testing a major horizontal structure 144.558.
Taking into consideration the structure & trend analysis, I believe that the market will reach 143.239 level soon.
P.S
Overbought describes a period of time where there has been a significant and consistent upward move in price over a period of time without much pullback.
Disclosure: I am part of Trade Nation's Influencer program and receive a monthly fee for using their TradingView charts in my analysis.
Like and subscribe and comment my ideas if you enjoy them!
EURGBP Will Go Higher! Long!
Here is our detailed technical review for EURGBP.
Time Frame: 9h
Current Trend: Bullish
Sentiment: Oversold (based on 7-period RSI)
Forecast: Bullish
The market is approaching a significant support area 0.852.
The underlined horizontal cluster clearly indicates a highly probable bullish movement with target 0.856 level.
P.S
The term oversold refers to a condition where an asset has traded lower in price and has the potential for a price bounce.
Overbought refers to market scenarios where the instrument is traded considerably higher than its fair value. Overvaluation is caused by market sentiments when there is positive news.
Disclosure: I am part of Trade Nation's Influencer program and receive a monthly fee for using their TradingView charts in my analysis.
Like and subscribe and comment my ideas if you enjoy them!

US Dollar Index (DXY) – Testing Long-Term Channel SupportBy MJTrading:
Chart Overview:
The US Dollar Index has now approached a major technical confluence zone that could define the next directional move. Price is pressing into the Danger Zone near the lower boundary of a multi-year descending channel, with an Ultimate Oversell Target sitting just below.
🔹 Key Technical Highlights:
Long-Term Down Channel (Daily & Weekly):
The DXY has respected this structure for several years.
Price is currently challenging the lower boundary, a zone where reactions often occur.
Danger Zone (~95–96):
A historically reactive area.
Prior demand and channel floor converge here.
Ultimate Oversell Target (~89–90):
Marked as a deeper potential exhaustion area if the channel fails.
Moving Averages:
15 EMA ~97.8
60 EMA ~99.3
Price remains below both EMAs, confirming persistent bearish momentum.
🔹 Potential Scenarios:
Scenario A (Green Path):
A bounce off current support could trigger a relief rally back toward 98–100, targeting the mid-channel and EMAs.
Scenario B (Red Path):
A breakdown below ~95 could accelerate selling pressure, aiming for the Ultimate Oversell Target (~89).
🔹 How I See It:
This is a high-risk inflection zone. Any bullish setups here remain counter-trend and require confirmation via strong reversal signals. Conversely, a decisive breakdown could have significant implications for USD pairs and commodities.
💡 Notes:
This chart includes the weekly inset view for broader context.
Keep risk management tight in this volatile area.
🔹 Reminder:
This idea is for educational purposes only—not financial advice.
💬 How are you positioning around the USD? Share your thoughts and charts below!
#Hashtags:
#MJTrading #DXY #USDollarIndex #Dollar #Forex #TechnicalAnalysis #TradingView #ChartAnalysis #PriceAction #FX #USD #Majors #DollarWeakness #DollarStrength #SupportAndResistance #TrendAnalysis #MarketOutlook

BITCOIN SHORT FROM RESISTANCE
BITCOIN SIGNAL
Trade Direction: short
Entry Level: 107,066.16
Target Level: 99,786.09
Stop Loss: 111,861.76
RISK PROFILE
Risk level: medium
Suggested risk: 1%
Timeframe: 1D
Disclosure: I am part of Trade Nation's Influencer program and receive a monthly fee for using their TradingView charts in my analysis.
LIKE AND COMMENT MY IDEAS

EUR/JPY BEARS WILL DOMINATE THE MARKET|SHORT
EUR/JPY SIGNAL
Trade Direction: short
Entry Level: 169.041
Target Level: 165.789
Stop Loss: 171.204
RISK PROFILE
Risk level: medium
Suggested risk: 1%
Timeframe: 9h
Disclosure: I am part of Trade Nation's Influencer program and receive a monthly fee for using their TradingView charts in my analysis.
LIKE AND COMMENT MY IDEAS

AUDCHF - ShortI have been short on AUDCHF for a few days. Here's my breakdown:
Technical:
- Descending channel
- Strong resistance on the upper channel line
- Potential descending triangle forming, suggesting continuation of this downtrend
- Following the overall trend of this pair, which is bearish
Fundamental:
- Risk off mood globally, CHF is a safe haven currency
- Dovish RBA
- Commodity pressure on AUD
- SNB stability

EUR/USD Pair Hits Yearly HighEUR/USD Pair Hits Yearly High
Yesterday, the EUR/USD exchange rate rose above the 1.1700 level for the first time this year. The last time one euro was worth more than 1.70 US dollars was in autumn 2019.
The main driver behind the euro’s rise is the weakening dollar, largely due to decisions made by the Trump administration. This week alone, the EUR/USD pair has gained more than 2%, partly as a result of escalating tensions between the US President and the Chair of the Federal Reserve.
According to Reuters, Trump called Powell “terrible” and said he had three or four candidates in mind for the top job at the Fed. It was also reported that Trump had considered selecting and announcing a replacement for Powell by September or October (his current term officially runs until May 2026).
Technical Analysis of the EUR/USD Chart
Price movements are forming an upward channel (highlighted in blue), with the following observations:
→ Midweek, the price consolidated around the channel’s median line (as indicated by arrow 1);
→ It then broke through the 1.6300 level with strong bullish momentum (shown by arrow 2), a level that had acted as resistance earlier in the month;
→ The long upper wicks on the candles forming yesterday’s highs (circled) suggest increased selling pressure near the upper boundary of the channel.
Given this, we could assume that in the short term, the price might form a new consolidation zone around the median line above the 1.6300 level. Significant fundamental catalysts would be required to break the developing upward trend.
This article represents the opinion of the Companies operating under the FXOpen brand only. It is not to be construed as an offer, solicitation, or recommendation with respect to products and services provided by the Companies operating under the FXOpen brand, nor is it to be considered financial advice.

USD/CHF SENDS CLEAR BULLISH SIGNALS|LONG
Hello, Friends!
The BB lower band is nearby so USD-CHF is in the oversold territory. Thus, despite the downtrend on the 1W timeframe I think that we will see a bullish reaction from the support line below and a move up towards the target at around 0.801.
Disclosure: I am part of Trade Nation's Influencer program and receive a monthly fee for using their TradingView charts in my analysis.
LIKE AND COMMENT MY IDEAS

USD/JPY BEARS ARE GAINING STRENGTH|SHORT
Hello, Friends!
Bearish trend on USD/JPY, defined by the red colour of the last week candle combined with the fact the pair is overbought based on the BB upper band proximity, makes me expect a bearish rebound from the resistance line above and a retest of the local target below at 143.964.
Disclosure: I am part of Trade Nation's Influencer program and receive a monthly fee for using their TradingView charts in my analysis.
LIKE AND COMMENT MY IDEAS

XPTUSD 1W:While Everyone Watches Gold, Platinum Quietly Wakes UpGold gets the headlines — but platinum just broke two years of silence with a clean, high-volume breakout from a symmetrical triangle on the weekly chart. And this isn’t noise — this is the structural shift traders wait for.
Price has been coiled inside a compressing wedge since early 2022. Equal highs. Equal lows. Stop hunts both ways. The classic “shake out before take off.” Now? The breakout is in. And the weekly candle closed above resistance with volume confirmation. Oh, and while we're at it — the 50MA just crossed above the 200MA, signaling a long-term trend reversal.
Target? Measure the triangle height: ~398 points. That projects a breakout target of 1440 USD, which aligns perfectly with previous institutional rejection zones.
But this isn’t just about the chart.
🔹 South Africa, the top global supplier, is struggling with energy and production cuts;
🔹 The Fed is pausing rate hikes — the dollar weakens, metals rally;
🔹 Demand from hydrogen tech, clean energy, and industrial catalysts is on the rise.
Translation? Smart money has been accumulating. The move from 965–1070 was just the ignition. The drive hasn’t started yet.
So while everyone fights over gold highs, platinum sits at the base of a move no one's prepared for — except those who know how accumulation ends.
🧭 Key support: 965–985
📍 Resistance zone: 1150–1180
🎯 Measured target: 1440+

XAUUSD: Gold's Muted Ascent Below $3350 XAUUSD: Gold's Muted Ascent Below $3350 – Navigating Key Levels Amidst USD Weakness!
Hello TradingView Community!
Let's delve into the intricate world of Gold (XAUUSD) today. The yellow metal is showing a subtle positive bias, largely influenced by a weaker US Dollar, yet a decisive bullish breakout above the $3350 mark remains elusive.
🌍 Macroeconomic Landscape: Forces Shaping Gold's Path
Gold has maintained a slight positive stance for the second consecutive day, but it's struggling to find significant follow-through, staying below the $3350 level in early European trading.
USD Under Pressure – A Tailwind for Gold: The primary driver for Gold's recent strength is the weakening US Dollar. Reports suggesting President Trump is considering replacing Fed Governor Jerome Powell have sparked concerns about the US central bank's future independence. This speculation has fueled market expectations for further Fed rate cuts this year, pushing the USD to its lowest point since March 2022, thereby providing support for non-yielding assets like Gold.
Cautious Outlook Prevails: Despite USD weakness, a definitive bullish trend for Gold is not yet confirmed. The ongoing ceasefire between Israel and Iran holds firm, with prevailing optimism limiting significant safe-haven rallies. This complex environment necessitates caution before confirming a definitive bottom for Gold or positioning for a substantial recovery from levels below $3300.
Key Data Ahead: Traders are keenly awaiting upcoming US macroeconomic data and speeches from FOMC members. These insights will be crucial in influencing XAU/USD, particularly ahead of Friday's pivotal US Personal Consumption Expenditures (PCE) Price Index release.
📊 XAUUSD Technical Outlook: Pinpointing Strategic Zones
Based on recent technical analysis (referencing image_e9d325.png for key levels), Gold is in a consolidation phase after a recent sharp decline, trading around the $329X mark. Price action below shorter-term moving averages suggests either lingering bearish pressure or an accumulation phase.
Strong Support Zones (Potential Buy Areas): Critical demand areas are identified around 3294.414, 3276.122, and notably 3264.400. These levels are crucial for potential price bounces.
Key Resistance Zones (Potential Sell Areas): Significant supply zones are found at 3313.737, 3321.466, 3330.483, and 3341.947. These are points where selling pressure may emerge.
🎯 XAUUSD Trading Plan: Your Actionable Strategy
Here's a breakdown of the strategic entry and exit points for your XAUUSD trades:
BUY ZONE (Strong Support - Long-Term Bias):
Entry: 3266 - 3264
SL: 3270
TP: 3280 - 3284 - 3290 - 3295 - 3300 - 3305 - 3310 - 3320
BUY SCALP (Quick Buy at Intermediate Support):
Entry: 3284 - 3282
SL: 3278
TP: 3288 - 3292 - 3296 - 3300 - 3305 - 3310 - 3320 - 3330
SELL ZONE (Key Resistance):
Entry: 3331 - 3333
SL: 3337
TP: 3326 - 3320 - 3316 - 3310 - 3305 - 3300
SELL SCALP (Quick Sell at Near Resistance):
Entry: 3313 - 3315
SL: 3320
TP: 3310 - 3305 - 3300 - 3295 - 3290 - 3280
⚠️ Key Factors to Monitor Closely:
US Macro Data: Friday's US Personal Consumption Expenditures (PCE) Price Index is paramount for market direction.
FOMC Member Speeches: Any official comments on monetary policy or inflation outlook will significantly impact USD and Gold.
Geopolitical Stability: Developments related to the Israel-Iran ceasefire can influence safe-haven demand.

BTC - Double Top after Liquidity Sweep?Price has recently executed a Buy Side Liquidity Sweep just above the previous high. This type of move often signals a potential shift in market direction, especially when followed by signs of exhaustion or failure to push higher. In this case, price has formed a double top near the 106,600 level, a classic sign of weakening bullish momentum and hesitation at a key resistance area.
Following the Sweep, the projection suggests a possible rejection from this region, leading to a corrective move to rebalance the inefficiencies left behind by the sharp upward impulse. These inefficiencies are marked as Fair Value Gaps —areas where price moved too quickly, leaving imbalanced zones between buyers and sellers. The market tends to return to these areas over time as it seeks equilibrium.
The first Gap lies just below the 0.28 Fibonacci retracement and may serve as an initial area for a reaction. If price slices through this level without meaningful support, attention shifts to the second Gap, which aligns closely with the 0.50 to 0.618 retracement zone. This region is historically significant for pullbacks and could offer a temporary pause or bounce.
Should the move extend further, the third and deepest Gap, located between the 0.618 and 0.65 levels , becomes a key area of interest. It marks a critical rebalancing zone that could attract stronger buying interest. If this area fails to hold, the 0.786 retracement level sits just below and may act as a final point for support before any broader directional change.
For refined entries, traders can watch lower timeframes like the 5-minute chart. Look for signs of weakness, such as an inverted Gap or a lower-timeframe break in structure, to time positions with tighter risk. This allows participation in the broader move while maintaining tactical precision.
The confluence of a Buy Side Liquidity Sweep, a double top , and multiple Gaps below provides a clear framework for a potential downside play. As always, let the price action lead.
Patience, confirmation, and context are key to executing with confidence.
