Gold Pullback to Resistance – Bearish Setup in PlayOANDA:XAUUSD is staging a modest technical rebound after a strong breakdown, currently retesting the confluence zone of resistance and EMA on the 1H chart. This area around 3,351 USD marks a key selling region where bearish momentum may resume.
On the macro front, traders are eyeing the upcoming Core PCE data — the Fed’s preferred inflation gauge. A higher-than-expected reading could boost the US dollar and reinforce downward pressure on gold prices.
Technically, the recent breakdown followed by a retest of structure suggests bearish continuation. If gold fails to break above resistance, it may drop first toward the 3,304 USD zone (TP1) and potentially extend to the key support near 3,250 USD (TP2).
All eyes should be on how price reacts to resistance. A confirmed rejection could offer a high-probability short opportunity.
Forex

BTCUSD : HUGE FALL AHEAD ? Sell at 106200 or below
Stoplos : 113000
Target : 100000, 90000
BTCUSD struggling hard to make new highs. Retest of 90k level expected.

Bullish bounce off pullback support?The Loonie (USD/CAD) has bounced of the pivot and could rise to the 1st resistance which acts as a pullback resistance.
Pivot: 1.3674
1st Support: 1.3599
1st Resistance: 1.3793
Risk Warning:
Trading Forex and CFDs carries a high level of risk to your capital and you should only trade with money you can afford to lose. Trading Forex and CFDs may not be suitable for all investors, so please ensure that you fully understand the risks involved and seek independent advice if necessary.
Disclaimer:
The above opinions given constitute general market commentary, and do not constitute the opinion or advice of IC Markets or any form of personal or investment advice.
Any opinions, news, research, analyses, prices, other information, or links to third-party sites contained on this website are provided on an "as-is" basis, are intended only to be informative, is not an advice nor a recommendation, nor research, or a record of our trading prices, or an offer of, or solicitation for a transaction in any financial instrument and thus should not be treated as such. The information provided does not involve any specific investment objectives, financial situation and needs of any specific person who may receive it. Please be aware, that past performance is not a reliable indicator of future performance and/or results. Past Performance or Forward-looking scenarios based upon the reasonable beliefs of the third-party provider are not a guarantee of future performance. Actual results may differ materially from those anticipated in forward-looking or past performance statements. IC Markets makes no representation or warranty and assumes no liability as to the accuracy or completeness of the information provided, nor any loss arising from any investment based on a recommendation, forecast or any information supplied by any third-party.

Bullish bounce?USD/JPY is falling towards the pivot which is an overlap support and could bounce to the 1st resistance that lines up with the 23.6% Fibonacci retracement.
Pivot: 144.35
1st Support: 143.09
1st Resistance: 145.29
Risk Warning:
Trading Forex and CFDs carries a high level of risk to your capital and you should only trade with money you can afford to lose. Trading Forex and CFDs may not be suitable for all investors, so please ensure that you fully understand the risks involved and seek independent advice if necessary.
Disclaimer:
The above opinions given constitute general market commentary, and do not constitute the opinion or advice of IC Markets or any form of personal or investment advice.
Any opinions, news, research, analyses, prices, other information, or links to third-party sites contained on this website are provided on an "as-is" basis, are intended only to be informative, is not an advice nor a recommendation, nor research, or a record of our trading prices, or an offer of, or solicitation for a transaction in any financial instrument and thus should not be treated as such. The information provided does not involve any specific investment objectives, financial situation and needs of any specific person who may receive it. Please be aware, that past performance is not a reliable indicator of future performance and/or results. Past Performance or Forward-looking scenarios based upon the reasonable beliefs of the third-party provider are not a guarantee of future performance. Actual results may differ materially from those anticipated in forward-looking or past performance statements. IC Markets makes no representation or warranty and assumes no liability as to the accuracy or completeness of the information provided, nor any loss arising from any investment based on a recommendation, forecast or any information supplied by any third-party.

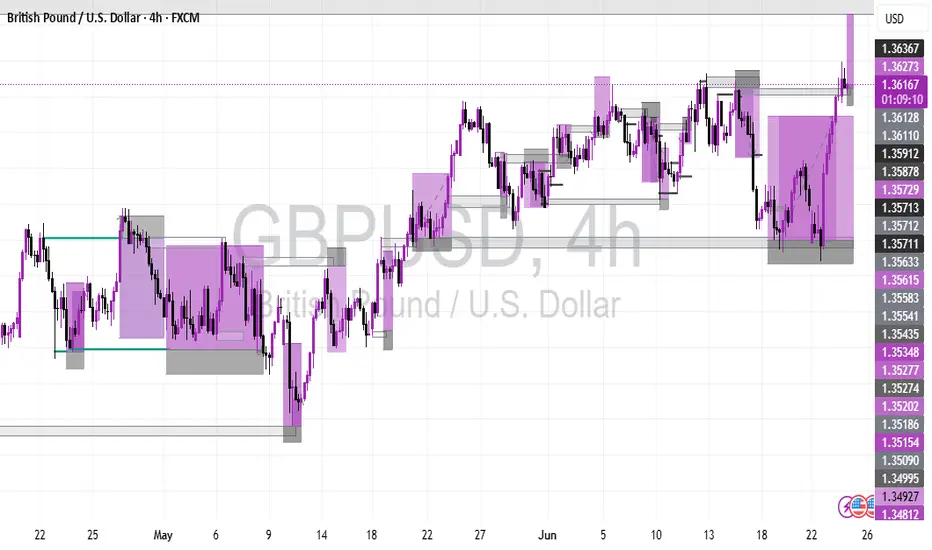
Bearish reversal off pullback resistance?The Cable (GBP/USD) is reacting off the pivot and could drop to the 1st support which is a pullback support.
Pivot: 1.3632
1st Support: 1.3533
1st Resistance: 1.2711
Risk Warning:
Trading Forex and CFDs carries a high level of risk to your capital and you should only trade with money you can afford to lose. Trading Forex and CFDs may not be suitable for all investors, so please ensure that you fully understand the risks involved and seek independent advice if necessary.
Disclaimer:
The above opinions given constitute general market commentary, and do not constitute the opinion or advice of IC Markets or any form of personal or investment advice.
Any opinions, news, research, analyses, prices, other information, or links to third-party sites contained on this website are provided on an "as-is" basis, are intended only to be informative, is not an advice nor a recommendation, nor research, or a record of our trading prices, or an offer of, or solicitation for a transaction in any financial instrument and thus should not be treated as such. The information provided does not involve any specific investment objectives, financial situation and needs of any specific person who may receive it. Please be aware, that past performance is not a reliable indicator of future performance and/or results. Past Performance or Forward-looking scenarios based upon the reasonable beliefs of the third-party provider are not a guarantee of future performance. Actual results may differ materially from those anticipated in forward-looking or past performance statements. IC Markets makes no representation or warranty and assumes no liability as to the accuracy or completeness of the information provided, nor any loss arising from any investment based on a recommendation, forecast or any information supplied by any third-party.

Could the Fiber reverse from here?The price is reacting off the pivot which is a pullback resistance and could drop from this level to the 1st 50% Fibonacci support.
Pivot: 1.1631
1st Support: 1.1552
1st Resistance: 1.1677
Risk Warning:
Trading Forex and CFDs carries a high level of risk to your capital and you should only trade with money you can afford to lose. Trading Forex and CFDs may not be suitable for all investors, so please ensure that you fully understand the risks involved and seek independent advice if necessary.
Disclaimer:
The above opinions given constitute general market commentary, and do not constitute the opinion or advice of IC Markets or any form of personal or investment advice.
Any opinions, news, research, analyses, prices, other information, or links to third-party sites contained on this website are provided on an "as-is" basis, are intended only to be informative, is not an advice nor a recommendation, nor research, or a record of our trading prices, or an offer of, or solicitation for a transaction in any financial instrument and thus should not be treated as such. The information provided does not involve any specific investment objectives, financial situation and needs of any specific person who may receive it. Please be aware, that past performance is not a reliable indicator of future performance and/or results. Past Performance or Forward-looking scenarios based upon the reasonable beliefs of the third-party provider are not a guarantee of future performance. Actual results may differ materially from those anticipated in forward-looking or past performance statements. IC Markets makes no representation or warranty and assumes no liability as to the accuracy or completeness of the information provided, nor any loss arising from any investment based on a recommendation, forecast or any information supplied by any third-party.

Overlap resistance ahead?The US Dollar Index (DXY) is rising towards the pivot, which is an overlap resistance and could reverse to the 1st support that lines up with the 127.2% Fibonacci extension.
Pivot: 98.50
1st Support: 97.21
1st Resistance: 99.30
Risk Warning:
Trading Forex and CFDs carries a high level of risk to your capital and you should only trade with money you can afford to lose. Trading Forex and CFDs may not be suitable for all investors, so please ensure that you fully understand the risks involved and seek independent advice if necessary.
Disclaimer:
The above opinions given constitute general market commentary, and do not constitute the opinion or advice of IC Markets or any form of personal or investment advice.
Any opinions, news, research, analyses, prices, other information, or links to third-party sites contained on this website are provided on an "as-is" basis, are intended only to be informative, is not an advice nor a recommendation, nor research, or a record of our trading prices, or an offer of, or solicitation for a transaction in any financial instrument and thus should not be treated as such. The information provided does not involve any specific investment objectives, financial situation and needs of any specific person who may receive it. Please be aware, that past performance is not a reliable indicator of future performance and/or results. Past Performance or Forward-looking scenarios based upon the reasonable beliefs of the third-party provider are not a guarantee of future performance. Actual results may differ materially from those anticipated in forward-looking or past performance statements. IC Markets makes no representation or warranty and assumes no liability as to the accuracy or completeness of the information provided, nor any loss arising from any investment based on a recommendation, forecast or any information supplied by any third-party.

NZD_CAD SHORT FROM RESISTANCE|
✅NZD_CAD will soon retest a key resistance level of 0.8320
So I think that the pair will make a pullback
And go down to retest the demand level below at 0.8267
SHORT🔥
✅Like and subscribe to never miss a new idea!✅
Disclosure: I am part of Trade Nation's Influencer program and receive a monthly fee for using their TradingView charts in my analysis.

GOLD MARKET ANALYSIS AND COMMENTARY - [Jun 23 - Jun 27]This week, after opening at $3,369/oz, OANDA:XAUUSD prices fluctuated within a fairly narrow range, from only $3,340-$3,374/oz, and closed at $3,368/oz. The fact that gold prices closed this week close to the opening price shows that investors are hesitant in the current context.
The reason why gold prices are still fluctuating within a narrow range this week is because US President Donald Trump gave Iran a 2-week deadline to consider negotiating an end to the conflict with Israel, even though the Israel-Iran conflict is still raging.
In addition, on June 12, the Fed kept interest rates unchanged at 4.25% - 4.5%, while adjusting its forecast for US GDP growth lower and raising its estimate for near-term inflation. Fed Chairman Jerome Powell acknowledged that tariffs would push up prices and weigh on economic activity. Although two rate cuts are expected before the end of the year, Powell said the Fed may wait for more clarity before cutting rates.
Next week, the Fed Chairman will hold two semiannual monetary policy hearings before the US House and Senate committees on Tuesday and Wednesday. If Fed Chairman Powell hints at a rate cut in September 2025, the USD could fall against other major currencies, causing gold prices to rise next week. Conversely, if the Fed Chairman emphasizes that they will continue to prioritize controlling inflation and is in no hurry to cut interest rates, the USD will rise, thereby pushing gold prices down next week.
📌Technically, the gold price on the H4 and D1 charts is stuck between the range of 3295-3450, which is an important support level around 3295, and the resistance level at 3450.
The current price is moving sideways and accumulating in smaller time frames, and the trend has not been clearly defined when it has not broken through the above two resistance levels.
There are two scenarios for gold.
In the long-term framework, if it breaks through the 3450 zone and breaks the trend at the same time, it is expected that the gold price will set a new high.
In the case that the gold price trades below the 3300 round resistance, and at the same time the 3295 support zone is broken, it is easy to form a head and shoulders pattern on the H4 chart.
Notable technical levels are listed below.
Support: 3,350 – 3,320 – 3,300USD
Resistance: 3,371 – 3,400 – 3,435 – 3,500USD
SELL XAUUSD PRICE 3412 - 3410⚡️
↠↠ Stop Loss 3416
BUY XAUUSD PRICE 3294 - 3296⚡️
↠↠ Stop Loss 3290

Nothing more beautiful than thisgbpusd has shown an uptrend for the past few months, did you get the picture?
AUD/JPY at Risk of Breakdown as Bullish Momentum FadesAUD/JPY failed to follow through on a bullish breakout above 94.00, despite initial signs of strength from a bullish hammer and inverted H&S pattern. The pair has since printed a bearish engulfing candle on the daily chart to take prices near the lows of its range of the past week.
With the 1-hour RSI (2) hitting oversold levels, a minor bounce is possible, but risks remain skewed to the downside. A break beneath 93.70 would confirm a range breakdown and open the door to a deeper pullback towards the high-volume node (HVN) at 93.85.
Matt Simpson, Market Analyst at City Index and Forex.com.

AUD-CAD Will Go Down! Sell!
Hello,Traders!
AUD-CAD made a retest
Of the wide horizontal
Resistance around 0.8934
And we are already seeing a
Local bearish reaction so
We will be expecting a
Further bearish move down
Sell!
Comment and subscribe to help us grow!
Check out other forecasts below too!
Disclosure: I am part of Trade Nation's Influencer program and receive a monthly fee for using their TradingView charts in my analysis.

Nikkei to continue in the upward move?NIK225 - 24h expiry
Short term RSI has turned positive. Further upside is expected.
Risk/Reward would be poor to call a buy from current levels.
A move through 38750 will confirm the bullish momentum.
The measured move target is 39500.
We look to Buy at 38500 (stop at 38200)
Our profit targets will be 39250 and 39500
Resistance: 39000 / 39250 / 39500
Support: 38500 / 38250 / 38000
Risk Disclaimer
The trade ideas beyond this page are for informational purposes only and do not constitute investment advice or a solicitation to trade. This information is provided by Signal Centre, a third-party unaffiliated with OANDA, and is intended for general circulation only. OANDA does not guarantee the accuracy of this information and assumes no responsibilities for the information provided by the third party. The information does not take into account the specific investment objectives, financial situation, or particular needs of any particular person. You should take into account your specific investment objectives, financial situation, and particular needs before making a commitment to trade, including seeking advice from an independent financial adviser regarding the suitability of the investment, under a separate engagement, as you deem fit.
You accept that you assume all risks in independently viewing the contents and selecting a chosen strategy.
Where the research is distributed in Singapore to a person who is not an Accredited Investor, Expert Investor or an Institutional Investor, Oanda Asia Pacific Pte Ltd (“OAP“) accepts legal responsibility for the contents of the report to such persons only to the extent required by law. Singapore customers should contact OAP at 6579 8289 for matters arising from, or in connection with, the information/research distributed.

Fed speak - Not broken, not cutting “Don’t fix what isn’t broken” seems to be the Fed’s current stance. Two Fed officials made that clear over the last 24 hours.
Vice Chair for Supervision Michael Barr warned that tariffs could fuel inflation by lifting short-term expectations, triggering second-round effects, and making inflation more persistent.
New York Fed President John Williams echoed that view, noting that tariff-driven inflation is “likely to get stronger in the months ahead.” He also called policy “well positioned” and said the Fed needs more data before making any move.
EUR/USD has formed a rising wedge pattern on the daily chart—typically a bearish structure that warns of a potential reversal. Price action has narrowed, building two clear tops. The downside target from the wedge could potentially be 1.1066 initially, and possibly down to 1.0732 if bearish momentum accelerates.

Gold Holding Strong – Eyes on $3400 and Beyond! (READ)By analyzing the gold chart on the 4-hour timeframe, we can see that after our last analysis, the price corrected down to $3341, then rallied back up to $3399. Currently, gold is trading around $3373, and if it manages to hold above $3355, we can expect further upside movement.
Potential bullish targets are $3400, $3417, $3450, and $3468.

Nasdaq Surges on Ceasefire Hopes – New All-Time Highs Ahead?By analyzing the #Nasdaq chart on the weekly timeframe, we can see that the index experienced a strong rally following the ceasefire announcement between Iran and Israel, climbing as high as 22,200 so far. If the ceasefire holds and tensions continue to ease, we could see a new all-time high for the Nasdaq.
Potential bullish targets for this move are 22,400, 23,200, and 24,000.
Please support me with your likes and comments to motivate me to share more analysis with you and share your opinion about the possible trend of this chart with me !
Best Regards , Arman Shaban

Market next target ⚠️ Disruption Analysis – BTC/USDT
1. False Bullish Narrative
The chart labels the structure as “Bullish”, yet recent price action shows:
A strong rejection near 106,000.
Followed by multiple red candles with increasing volume — a common sign of sell pressure re-entering the market.
The bullish label may be premature or misleading based on this momentum shift.
2. Bearish Structure Developing
The price is starting to form a lower high after the sharp drop.
The outlined path resembles a head-and-shoulders pattern in early development, often preceding a bearish breakdown.
The breakdown could lead directly to the "Target" zone or even below if momentum increases.
3. Volume Divergence
The volume spike during the pump was not sustained. Post-spike, volume is declining on green candles, suggesting buyers are exhausted.
Sellers are likely using liquidity at the top to exit positions, not initiate new longs.
4. Support Turned Resistance
The red boxes mark failed support zones which now may act as resistance.
If price attempts to retest these zones and fails, it would confirm bearish control and validate the downward path toward the target (104,400–104,000).

Market next target ⚠️ Disruption Analysis – BTC/USD
1. Questionable Bullish Bias
The chart labels the structure as "Bullish," but the current setup looks more like a potential distribution phase than a healthy continuation pattern.
The price is moving sideways with declining volume, suggesting buyers are losing strength.
2. Volume Discrepancy
Notice the spike in volume during the sharp move up, followed by flat candles and lower volume.
This is typical of a "pump and fade" structure, where large players exit after a rapid price move, leaving retail traders with poor entries.
3. Resistance Not Clearly Broken
Price failed to sustain above 105,800–106,000, indicating that the resistance zone remains valid.
The recent rejection candles near this level suggest sellers are active and overhead pressure is strong.
4. Descending Into Compression
The blue "descending" structure before the sideways move may signal a bearish flag or a pause before further downside—not necessarily a bullish sign.
5. False Reversal Warning
The bullish pattern drawn with zig-zags (implying consolidation before continuation) could actually be setting up a bull trap.
If price fakes a bounce and then breaks below 104,800, a sharper decline toward the 103,000 target could accelerate quickly.

Market next target ⚠️ Disruption Analysis – USD/JPY
1. Sideways/Flat Price Action
Price is consolidating in a tight range with small-bodied candles.
This indicates indecision and lack of momentum, not strength.
The upward arrows suggest bullish bias, but no strong signal confirms a breakout yet.
2. Bearish Momentum
The recent red candles dominate, showing a clear drop from above 146.000 earlier.
The overall trend (short-term) is down, and the support area could be tested again.
3. Decreasing Volume
Volume is fading out, especially the most recent bar (around 1.01K).
This suggests waning interest—any bullish breakout without volume support is likely to fail or reverse.
4. Resistance Area is Strong
The resistance zone near 145.800–146.000 is clearly tested before and held.
Without a significant catalyst, it's unlikely to break in the near term.
5. False Breakout Risk Above Target
The marked "target" just below resistance could trigger false bullish entries.

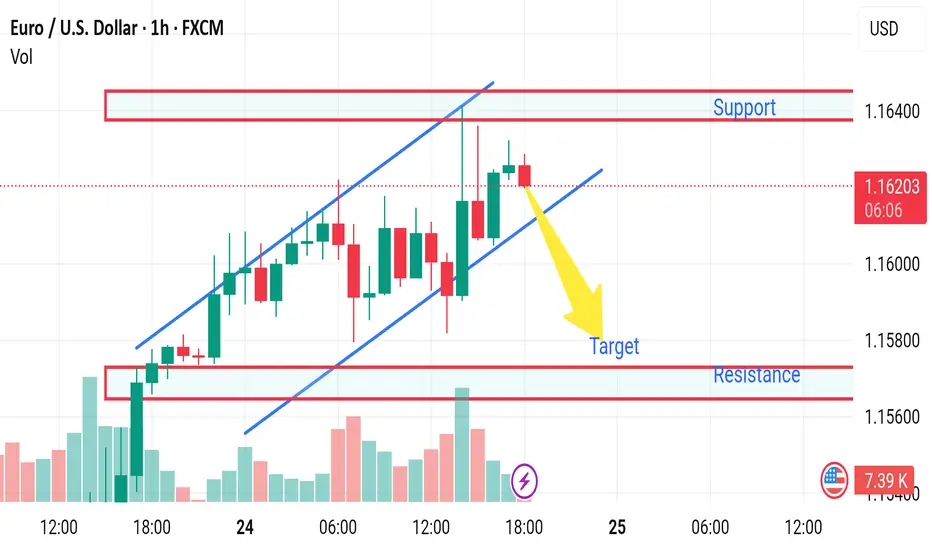
Market next move ⚠️ Disruption Analysis of the Chart
1. False Breakout Risk
The price is currently within an ascending channel, which is often seen as bullish.
However, the recent candlesticks show smaller bodies with wicks on top, indicating buyer exhaustion.
A false breakout above the upper trendline or support around 1.3632 could trap buyers before a sharp reversal.
2. Low Volume Confirmation
Volume peaked earlier but has significantly decreased in the last few candles.
Weak volume during a price rise signals a lack of conviction, increasing the likelihood of a pullback.
3. Resistance Flip Not Confirmed
The level around 1.3600 is marked as resistance-turned-support, but there is no strong retest confirmation yet.
If price revisits this zone and fails to bounce, this support could break, leading to a downside reversal.
4. Divergence Watch
While not visible in this static image, if you overlay RSI or MACD, there could be signs of bearish divergence (price making higher highs while momentum indicators make lower highs).
This is often a leading indicator of trend weakening.

Market next target 🔁 Disrupted Analysis (Bullish Scenario Instead of Bearish)
1. Price in an Upward Channel:
The price remains within a clear ascending channel, respecting both upper and lower bounds.
The bearish arrow prematurely predicts a breakdown while no support break has occurred.
2. Strong Bullish Momentum:
Price is making higher highs and higher lows, a textbook bullish structure.
The recent dip respected the lower trendline and was followed by strong green candles.
3. Volume Confirmation:
Notice the increasing bullish volume on the recent push higher.
That suggests buyers are still in control, contradicting the bearish prediction.
4. Invalidation of Bearish Breakdown:
Until the lower blue trendline is clearly broken with volume, the bearish target is speculative.
Support is holding at 1.1610–1.1600 zone, which may become a launchpad for further gains.
EURUSD: Can it reach 1.1900?EURUSD is bullish on its 1D technical outlook (RSI = 65.234, MACD = 0.006, ADX = 20.419) and is going for a 3 week high. This is technically a long term bullish wave (since the January 13th 2025 low) on the 3 year Channel Up. We anticipate that this wave will go for the pattern's high by the end of the year, and being limited by the 7 year LH trendline, we expect to aim for at least 1.1900. The 1W RSI has started to post a sequence that resembles the last 3 major ones.
## If you like our free content follow our profile to get more daily ideas. ##
## Comments and likes are greatly appreciated. ##

Market next move 🔁 Disrupted Analysis (Bullish Scenario Instead of Bearish)
1. Support Holding Firm:
The analysis assumes the price will drop after failing resistance, but the current price action is showing higher lows, suggesting accumulation.
The support area has been tested multiple times, showing strength.
2. Volume Analysis Contradiction:
Recent green volume bars indicate buying interest at lower levels.
No significant volume spike on the last downward leg, suggesting lack of strong selling pressure.
3. Potential Inverted Head and Shoulders:
The current formation could be the right shoulder of an inverted head and shoulders pattern, a classic bullish reversal setup.
If confirmed, this could lead to a breakout above the resistance area, not a drop.
4. Trendline Breakout Watch:
There's a potential bullish breakout of the descending trendline.
A break above 3,320 USD could invalidate the bearish thesis and suggest a target near 3,340–3,350 USD.
