Potential bullish rise?AUD/USD has bounced off the support level which is a pullback support and could rise from this level to our take profit.
Entry: 0.6406
Why we like it:
There is a pullback support level.
Stop loss: 0.6359
Why we like it:
There is a pullback support level.
Take profit: 0.6512
Why we like it:
There is a pullback resistance level that lines up with the 78.6% Fibonacci retracement.
njoying your TradingView experience? Review us!
Please be advised that the information presented on TradingView is provided to Vantage (‘Vantage Global Limited’, ‘we’) by a third-party provider (‘Everest Fortune Group’). Please be reminded that you are solely responsible for the trading decisions on your account. There is a very high degree of risk involved in trading. Any information and/or content is intended entirely for research, educational and informational purposes only and does not constitute investment or consultation advice or investment strategy. The information is not tailored to the investment needs of any specific person and therefore does not involve a consideration of any of the investment objectives, financial situation or needs of any viewer that may receive it. Kindly also note that past performance is not a reliable indicator of future results. Actual results may differ materially from those anticipated in forward-looking or past performance statements. We assume no liability as to the accuracy or completeness of any of the information and/or content provided herein and the Company cannot be held responsible for any omission, mistake nor for any loss or damage including without limitation to any loss of profit which may arise from reliance on any information supplied by Everest Fortune Group.
Forex

Falling towards pullback support?USD/JPY is falling towards the support level which is a pullback support that is slightly below the 50% Fibonacci retracement and could bounce from this level to our take profit.
Entry: 145.11
Why we like it:
There is a pullback support level that is slightly below the 50% Fibonacci retracement.
Stop loss: 143.85
Why we like it:
There is a pullback support level that lines up with the 78.6% Fibonacci retracement.
Take profit: 147.58
Why we like it:
There is a pullback resistance level.
njoying your TradingView experience? Review us!
Please be advised that the information presented on TradingView is provided to Vantage (‘Vantage Global Limited’, ‘we’) by a third-party provider (‘Everest Fortune Group’). Please be reminded that you are solely responsible for the trading decisions on your account. There is a very high degree of risk involved in trading. Any information and/or content is intended entirely for research, educational and informational purposes only and does not constitute investment or consultation advice or investment strategy. The information is not tailored to the investment needs of any specific person and therefore does not involve a consideration of any of the investment objectives, financial situation or needs of any viewer that may receive it. Kindly also note that past performance is not a reliable indicator of future results. Actual results may differ materially from those anticipated in forward-looking or past performance statements. We assume no liability as to the accuracy or completeness of any of the information and/or content provided herein and the Company cannot be held responsible for any omission, mistake nor for any loss or damage including without limitation to any loss of profit which may arise from reliance on any information supplied by Everest Fortune Group.

AUD_NZD LOCAL LONG|
✅AUD_NZD has retested a key support level of 1.0800
And as the pair is already making a bullish rebound
A move up to retest the supply level above at 1.0820 is likely
LONG🚀
✅Like and subscribe to never miss a new idea!✅
Disclosure: I am part of Trade Nation's Influencer program and receive a monthly fee for using their TradingView charts in my analysis.

Bullish bounce off overlap support?USD/CAD is falling towards the support level which is an overlap support that lines up with the 38.2% Fibonacci retracement an could bounce from this level to our take profit.
Entry: 1.3689
Why we like it:
There is an overlap support level that lines up with the 38.2% Fibonacci retracement.
Stop loss: 1.3647
Why we like it:
There is an overlap support level that lines up with the 61.8% Fibonacci retracement.
Take profit: 1.3815
Why we like it:
There is a pullback resistance level that aligns with the 145% Fibonacci extension.
Enjoying your TradingView experience? Review us!
Please be advised that the information presented on TradingView is provided to Vantage (‘Vantage Global Limited’, ‘we’) by a third-party provider (‘Everest Fortune Group’). Please be reminded that you are solely responsible for the trading decisions on your account. There is a very high degree of risk involved in trading. Any information and/or content is intended entirely for research, educational and informational purposes only and does not constitute investment or consultation advice or investment strategy. The information is not tailored to the investment needs of any specific person and therefore does not involve a consideration of any of the investment objectives, financial situation or needs of any viewer that may receive it. Kindly also note that past performance is not a reliable indicator of future results. Actual results may differ materially from those anticipated in forward-looking or past performance statements. We assume no liability as to the accuracy or completeness of any of the information and/or content provided herein and the Company cannot be held responsible for any omission, mistake nor for any loss or damage including without limitation to any loss of profit which may arise from reliance on any information supplied by Everest Fortune Group.

Major resistance ahead?GBP/USD is rising towards the resistance level which is an overlap resistance and could reverse from this level to our take profit.
Entry: 1.3535
Why we like it:
There is an overlap resistance level.
Stop loss: 1.3449
Why we like it:
There is a pullback resistance level that lines up with the 161.8% Fibonacci extension.
Take profit: 1.3449
Why we like it:
There is a pullback support level.
Enjoying your TradingView experience? Review us!
Please be advised that the information presented on TradingView is provided to Vantage (‘Vantage Global Limited’, ‘we’) by a third-party provider (‘Everest Fortune Group’). Please be reminded that you are solely responsible for the trading decisions on your account. There is a very high degree of risk involved in trading. Any information and/or content is intended entirely for research, educational and informational purposes only and does not constitute investment or consultation advice or investment strategy. The information is not tailored to the investment needs of any specific person and therefore does not involve a consideration of any of the investment objectives, financial situation or needs of any viewer that may receive it. Kindly also note that past performance is not a reliable indicator of future results. Actual results may differ materially from those anticipated in forward-looking or past performance statements. We assume no liability as to the accuracy or completeness of any of the information and/or content provided herein and the Company cannot be held responsible for any omission, mistake nor for any loss or damage including without limitation to any loss of profit which may arise from reliance on any information supplied by Everest Fortune Group.

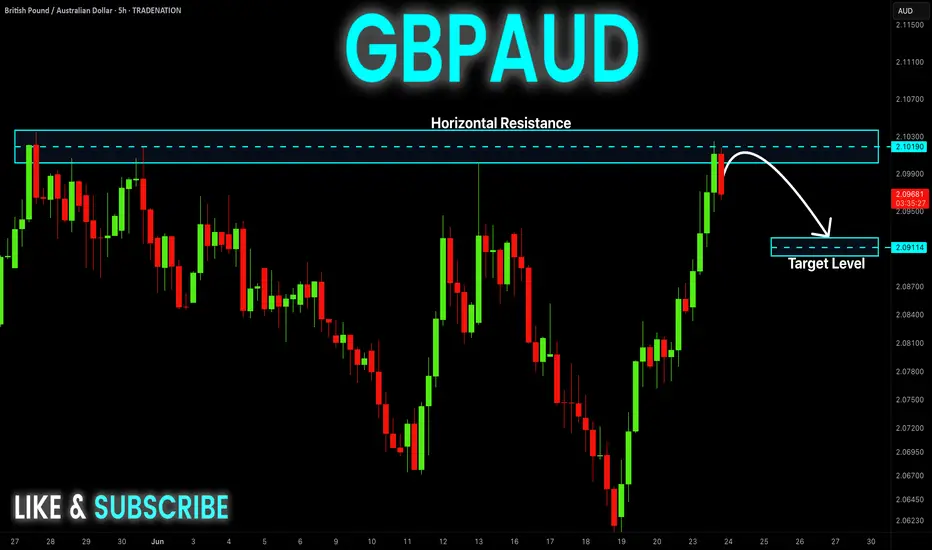
GBP-AUD Local Short! Sell!
Hello,Traders!
GBP-AUD made a retest of
The horizontal resistance
Of 2.1037 from where we
Are already seeing a bearish
Pullback so we will be
Expecting a further local
Move down
Sell!
Comment and subscribe to help us grow!
Check out other forecasts below too!
Disclosure: I am part of Trade Nation's Influencer program and receive a monthly fee for using their TradingView charts in my analysis.
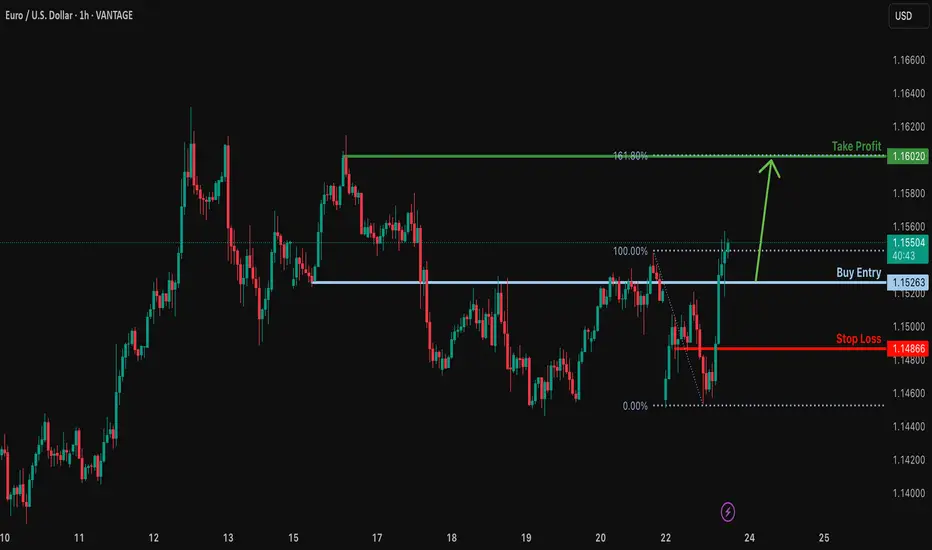
Bullish rise?EUR/USD is falling towards the support level which is an overlap support and could bounce from this level too ur take profit.
Entry: 1.1526
Why we like it:
There is an overlap support level.
Stop loss: 1.1486
Why we like it:
There is a pullback support level.
Take profit: 1.1602
Why we like it:
There is a pullback resistance level that aligns with the 161.8% Fibonacci extension.
Enjoying your TradingView experience? Review us!
Please be advised that the information presented on TradingView is provided to Vantage (‘Vantage Global Limited’, ‘we’) by a third-party provider (‘Everest Fortune Group’). Please be reminded that you are solely responsible for the trading decisions on your account. There is a very high degree of risk involved in trading. Any information and/or content is intended entirely for research, educational and informational purposes only and does not constitute investment or consultation advice or investment strategy. The information is not tailored to the investment needs of any specific person and therefore does not involve a consideration of any of the investment objectives, financial situation or needs of any viewer that may receive it. Kindly also note that past performance is not a reliable indicator of future results. Actual results may differ materially from those anticipated in forward-looking or past performance statements. We assume no liability as to the accuracy or completeness of any of the information and/or content provided herein and the Company cannot be held responsible for any omission, mistake nor for any loss or damage including without limitation to any loss of profit which may arise from reliance on any information supplied by Everest Fortune Group.
EURUSD Channel Up formed bottom. Heavily bullish.The EURUSD pair has been trading within a Channel Up since the May 12 Low. Today it hit its 4H MA100 (green trend-line) for the first time since May 12 and having just broken also above its 4H MA50 (blue trend-line), it confirmed that the pattern has already priced its bottom.
This is initiating the new Bullish Leg and based on the previous two, it should grow by at least +3.21%. We have a modest short-term Target at 1.1800.
-------------------------------------------------------------------------------
** Please LIKE 👍, FOLLOW ✅, SHARE 🙌 and COMMENT ✍ if you enjoy this idea! Also share your ideas and charts in the comments section below! This is best way to keep it relevant, support us, keep the content here free and allow the idea to reach as many people as possible. **
-------------------------------------------------------------------------------
Disclosure: I am part of Trade Nation's Influencer program and receive a monthly fee for using their TradingView charts in my analysis.
💸💸💸💸💸💸
👇 👇 👇 👇 👇 👇

AUDCAD: Long Signal with Entry/SL/TP
AUDCAD
- Classic bullish pattern
- Our team expects retracement
SUGGESTED TRADE:
Swing Trade
Buy AUDCAD
Entry - 0.8836
Stop -0.8817
Take - 0.8871
Our Risk - 1%
Start protection of your profits from lower levels
Disclosure: I am part of Trade Nation's Influencer program and receive a monthly fee for using their TradingView charts in my analysis.
❤️ Please, support our work with like & comment! ❤️

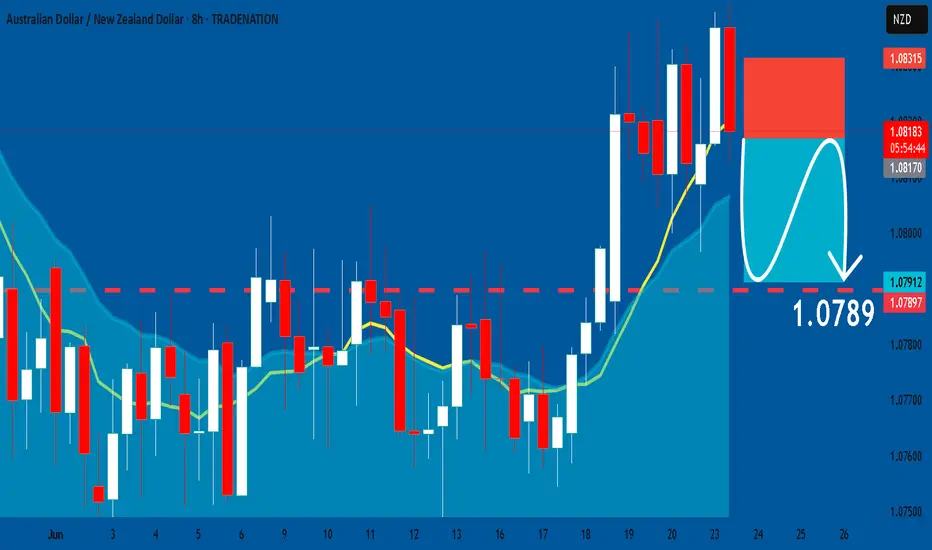
AUDNZD: Short Trading Opportunity
AUDNZD
- Classic bearish formation
- Our team expects pullback
SUGGESTED TRADE:
Swing Trade
Short AUDNZD
Entry - 1.0817
Sl - 1.0831
Tp - 1.0789
Our Risk - 1%
Start protection of your profits from lower levels
Disclosure: I am part of Trade Nation's Influencer program and receive a monthly fee for using their TradingView charts in my analysis.
❤️ Please, support our work with like & comment! ❤️
AUDCHF: Growth & Bullish Forecast
Looking at the chart of AUDCHF right now we are seeing some interesting price action on the lower timeframes. Thus a local move up seems to be quite likely.
Disclosure: I am part of Trade Nation's Influencer program and receive a monthly fee for using their TradingView charts in my analysis.
❤️ Please, support our work with like & comment! ❤️

EURUSD: Bears Will Push Lower
The analysis of the EURUSD chart clearly shows us that the pair is finally about to tank due to the rising pressure from the sellers.
Disclosure: I am part of Trade Nation's Influencer program and receive a monthly fee for using their TradingView charts in my analysis.
❤️ Please, support our work with like & comment! ❤️

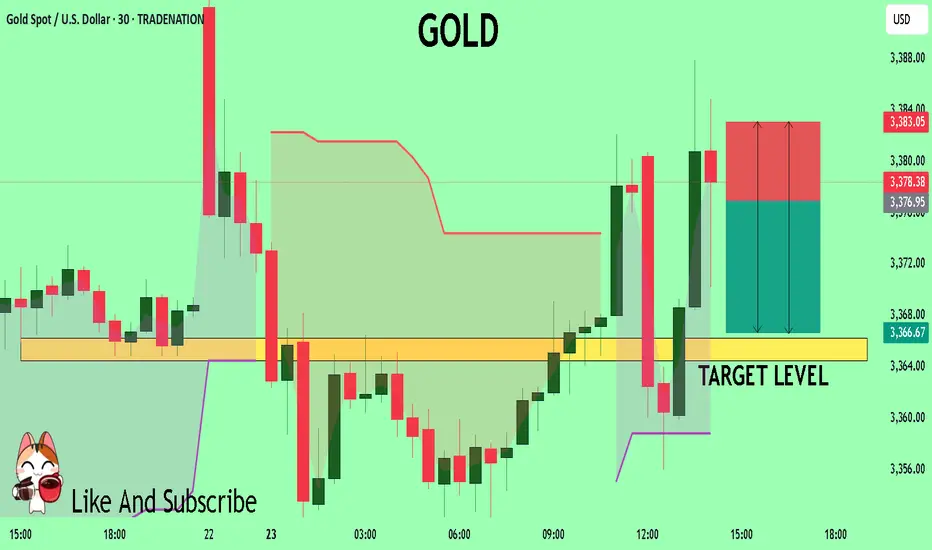
GOLD What Next? SELL!
My dear friends,
My technical analysis for GOLD is below:
The market is trading on 3376.9 pivot level.
Bias - Bearish
Technical Indicators: Both Super Trend & Pivot HL indicate a highly probable Bearish continuation.
Target - 3366.2
Recommended Stop Loss - 3383.0
About Used Indicators:
A pivot point is a technical analysis indicator, or calculations, used to determine the overall trend of the market over different time frames.
Disclosure: I am part of Trade Nation's Influencer program and receive a monthly fee for using their TradingView charts in my analysis.
———————————
WISH YOU ALL LUCK
GBPCHF: Pullback From Support 🇬🇧🇨🇭
GBPCHF is going to pull back from a wide daily support cluster.
I see a strong intraday bullish confirmation and a bullish
imbalance candle after the news.
Goal - 1.0986
❤️Please, support my work with like, thank you!❤️
I am part of Trade Nation's Influencer program and receive a monthly fee for using their TradingView charts in my analysis.

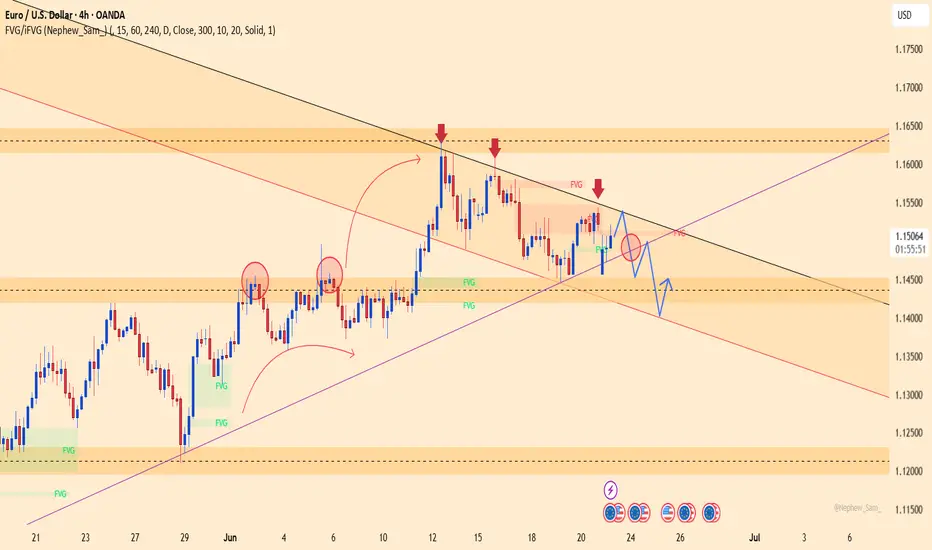
Euro – Eyes 1.15400, Awaits Powell's ToneEuro has just filled a GAP and rebounded strongly from the FVG zone around 1.14500. It is now approaching the 1.15400 resistance area, where a descending trendline intersects with a supply FVG. The bullish momentum remains intact within the short-term correction channel, but a rejection at this level could trigger a pullback.
On the news front, US Flash Manufacturing PMI is expected to decline, while Fed Chair Jerome Powell is set to testify this week. If he adopts a dovish tone, the USD may weaken further, potentially giving EURUSD the push it needs to break through resistance.
Strategy: Wait for a clear breakout above 1.15400 to confirm further upside. If rejected, watch the 1.14000 zone as a key support.
Breakout from Demand Zone🟡 XAU/USD – 2H Chart Analysis
Title: “Compression Breakout From Demand Zone – Room to Revisit Highs”
Bias: Bullish (Momentum Confirmation)
Timeframe: 2H
Chart Reference: MJTrading – June 23, 2025
📍 Context & Structure:
Gold has just broken out of a multi-candle compression range after tapping into a well-defined demand zone between $3,333 – $3,346. This area acted as the launchpad for previous rallies and is now showing fresh signs of accumulation.
Two EMAs (15 & 60) are attempting a bullish crossover, supporting a shift in momentum.
📈 Trade Setup (Long Bias):
Entry: ✅ Market or retest at $3,366
Stop Loss: 🔴 Below the recent demand base at $3,330
Target 1: 🟢 $3,415 (local swing high)
Target 2: 🟢 $3,460–$3,480 (upper major supply / range top)
R/R Ratio: 🔁 ~2
🔍 Why It Matters:
✅ Price defended key demand zone
✅ Strong engulfing candle with decent volume signals a reversal
⚖️ MJTrading Note:
“Gold thrives on uncertainty — and this bounce from a high-confluence demand zone could be the beginning of a push back toward the highs, especially if macro data shifts in favor.”
#MJTrading #Gold #XAUUSD #Forex #chart #signal #buy #long

USOIL Is Very Bullish! Long!
Take a look at our analysis for USOIL.
Time Frame: 1D
Current Trend: Bullish
Sentiment: Oversold (based on 7-period RSI)
Forecast: Bullish
The market is on a crucial zone of demand 73.546.
The oversold market condition in a combination with key structure gives us a relatively strong bullish signal with goal 79.365 level.
P.S
We determine oversold/overbought condition with RSI indicator.
When it drops below 30 - the market is considered to be oversold.
When it bounces above 70 - the market is considered to be overbought.
Disclosure: I am part of Trade Nation's Influencer program and receive a monthly fee for using their TradingView charts in my analysis.
Like and subscribe and comment my ideas if you enjoy them!

EURUSD Is Going Down! Sell!
Please, check our technical outlook for EURUSD.
Time Frame: 1h
Current Trend: Bearish
Sentiment: Overbought (based on 7-period RSI)
Forecast: Bearish
The price is testing a key resistance 1.146.
Taking into consideration the current market trend & overbought RSI, chances will be high to see a bearish movement to the downside at least to 1.143 level.
P.S
Overbought describes a period of time where there has been a significant and consistent upward move in price over a period of time without much pullback.
Disclosure: I am part of Trade Nation's Influencer program and receive a monthly fee for using their TradingView charts in my analysis.
Like and subscribe and comment my ideas if you enjoy them!

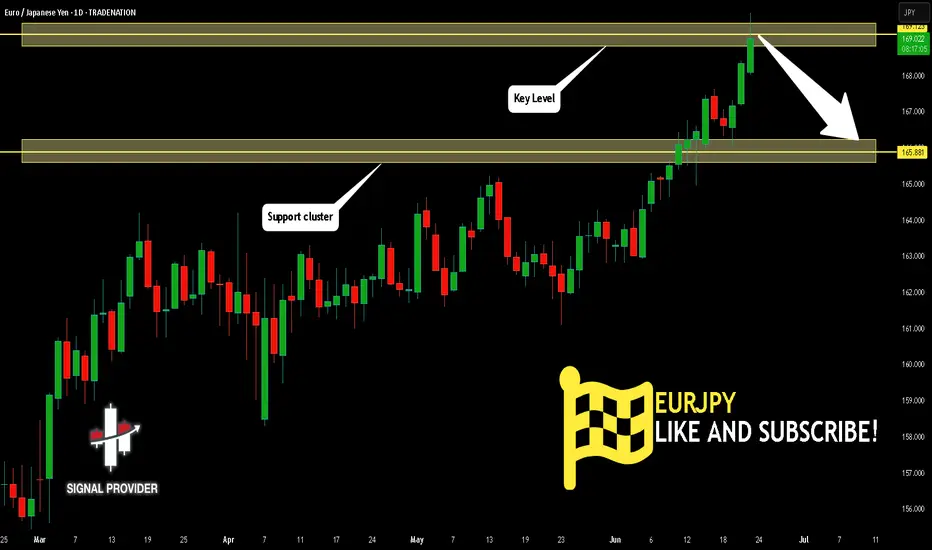
EURJPY Will Fall! Short!
Here is our detailed technical review for EURJPY.
Time Frame: 1D
Current Trend: Bearish
Sentiment: Overbought (based on 7-period RSI)
Forecast: Bearish
The market is trading around a solid horizontal structure 169.123.
The above observations make me that the market will inevitably achieve 165.881 level.
P.S
Please, note that an oversold/overbought condition can last for a long time, and therefore being oversold/overbought doesn't mean a price rally will come soon, or at all.
Disclosure: I am part of Trade Nation's Influencer program and receive a monthly fee for using their TradingView charts in my analysis.
Like and subscribe and comment my ideas if you enjoy them!
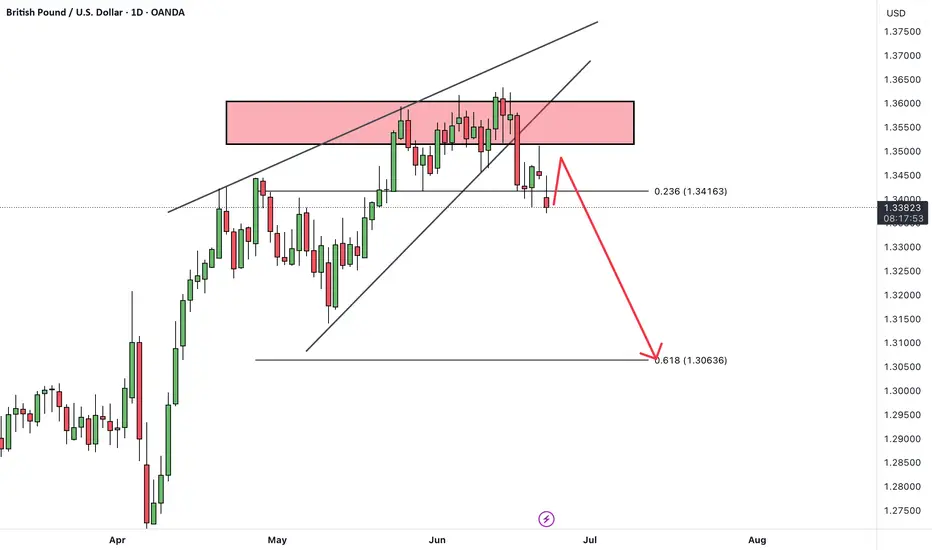
GBPUSDHello Traders! 👋
What are your thoughts on GBPUSD?
On the GBPUSD chart, we can see that the price has repeatedly tested a key resistance zone but failed to break above it, resulting in multiple rejections.
After forming a rising wedge pattern, the pair has broken down below the wedge, and is now completing a pullback toward the broken trendline.
We expect that after some consolidation in this area and completion of the pullback, the price will likely resume its decline toward lower targets.
As long as price remains below the resistance zone and broken trendline, the bearish scenario remains valid.
Is the pullback complete and ready for the next leg down? Share your view below! 🤔👇
Don’t forget to like and share your thoughts in the comments! ❤️
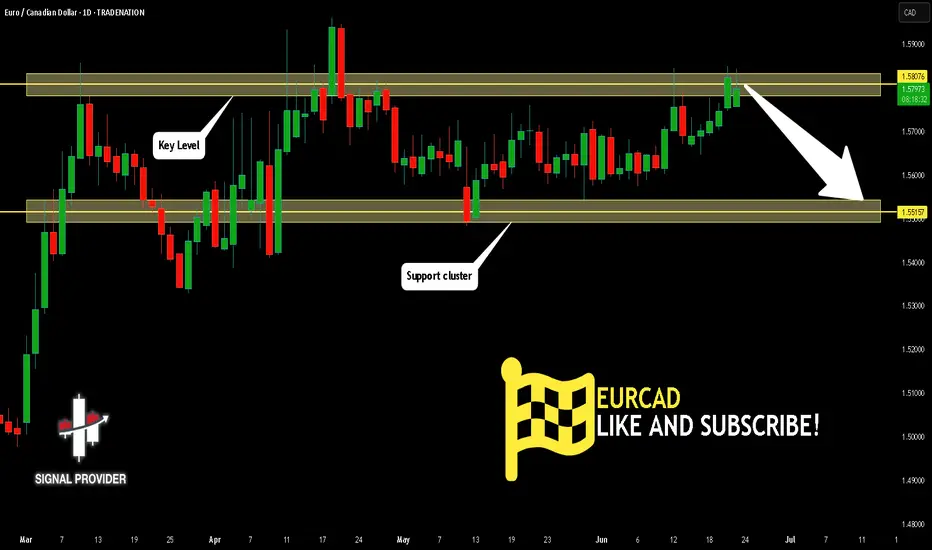
EURCAD Will Go Lower From Resistance! Sell!
Take a look at our analysis for EURCAD.
Time Frame: 1D
Current Trend: Bearish
Sentiment: Overbought (based on 7-period RSI)
Forecast: Bearish
The market is testing a major horizontal structure 1.580.
Taking into consideration the structure & trend analysis, I believe that the market will reach 1.551 level soon.
P.S
The term oversold refers to a condition where an asset has traded lower in price and has the potential for a price bounce.
Overbought refers to market scenarios where the instrument is traded considerably higher than its fair value. Overvaluation is caused by market sentiments when there is positive news.
Disclosure: I am part of Trade Nation's Influencer program and receive a monthly fee for using their TradingView charts in my analysis.
Like and subscribe and comment my ideas if you enjoy them!
AUDCAD Will Move Lower! Short!
Please, check our technical outlook for AUDCAD.
Time Frame: 9h
Current Trend: Bearish
Sentiment: Overbought (based on 7-period RSI)
Forecast: Bearish
The price is testing a key resistance 0.885.
Taking into consideration the current market trend & overbought RSI, chances will be high to see a bearish movement to the downside at least to 0.879 level.
P.S
The term oversold refers to a condition where an asset has traded lower in price and has the potential for a price bounce.
Overbought refers to market scenarios where the instrument is traded considerably higher than its fair value. Overvaluation is caused by market sentiments when there is positive news.
Disclosure: I am part of Trade Nation's Influencer program and receive a monthly fee for using their TradingView charts in my analysis.
Like and subscribe and comment my ideas if you enjoy them!

GBPUSD Will Fall! Sell!
Here is our detailed technical review for GBPUSD.
Time Frame: 6h
Current Trend: Bearish
Sentiment: Overbought (based on 7-period RSI)
Forecast: Bearish
The market is approaching a significant resistance area 1.349.
Due to the fact that we see a positive bearish reaction from the underlined area, I strongly believe that sellers will manage to push the price all the way down to 1.341 level.
P.S
The term oversold refers to a condition where an asset has traded lower in price and has the potential for a price bounce.
Overbought refers to market scenarios where the instrument is traded considerably higher than its fair value. Overvaluation is caused by market sentiments when there is positive news.
Disclosure: I am part of Trade Nation's Influencer program and receive a monthly fee for using their TradingView charts in my analysis.
Like and subscribe and comment my ideas if you enjoy them!
