Bajaj finance for Swing Bajaj finance is good looking for swing,
Small sl, and good support,
Add in your watchlist.
Forex

ETHUSD Will Go Down! Sell!
Take a look at our analysis for ETHUSD.
Time Frame: 1D
Current Trend: Bearish
Sentiment: Overbought (based on 7-period RSI)
Forecast: Bearish
The market is on a crucial zone of supply 2,415.11.
The above-mentioned technicals clearly indicate the dominance of sellers on the market. I recommend shorting the instrument, aiming at 1,957.20 level.
P.S
Please, note that an oversold/overbought condition can last for a long time, and therefore being oversold/overbought doesn't mean a price rally will come soon, or at all.
Disclosure: I am part of Trade Nation's Influencer program and receive a monthly fee for using their TradingView charts in my analysis.
Like and subscribe and comment my ideas if you enjoy them!

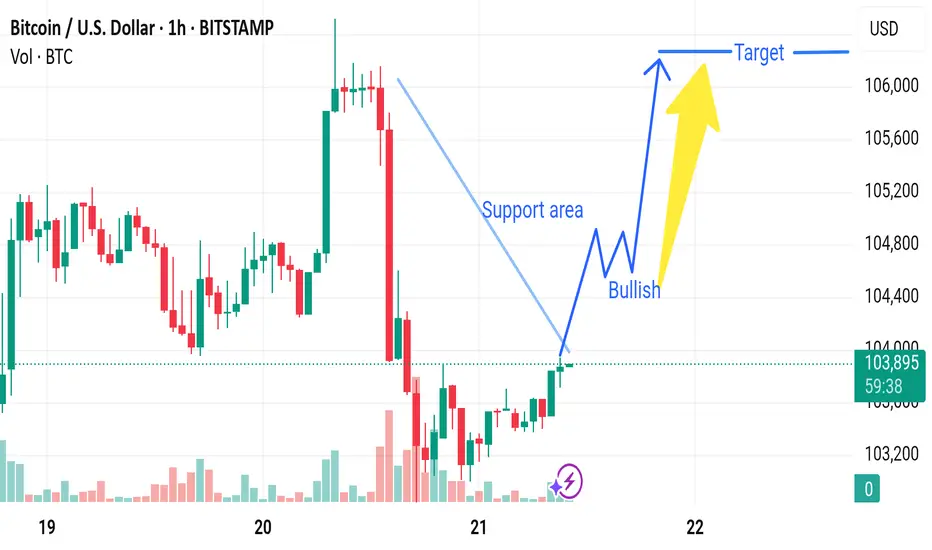
Market next target 🔄 Disruption Analysis:
1. Weak Support Confirmation
The chart marks a "Support area," but there is no strong confirmation (e.g., a hammer or engulfing bullish candle with high volume).
Support zones are more reliable with multiple prior bounces; here, it seems newly identified and not yet validated.
2. Bearish Volume Signature
During the recent decline (before the support), the red volume bars are significantly larger, indicating strong selling pressure.
The recovery candles near support have low volume, which may signal lack of conviction from bulls.
3. Lower Highs Formation
Prior to the drop, we see a series of lower highs, hinting at weakening bullish momentum.
This could suggest a potential bearish continuation, especially if price fails to break above the last local high (~106,000).
4. Possible Bearish Retest
Instead of a bullish breakout, the current price might just be retesting the broken support-turned-resistance.
This is a common bull trap scenario where prices bounce slightly before resuming downward.
GBPUSD: Bearish After Opening 🇬🇧🇺🇸
There is a high chance that GBPUSD will drop after the market opening.
I see a strong bearish confirmation after a test of a recently broken trend line.
The price formed a head & shoulders pattern and violated its neckline
on an hourly time frame.
Goal - 1.3425
❤️Please, support my work with like, thank you!❤️
I am part of Trade Nation's Influencer program and receive a monthly fee for using their TradingView charts in my analysis.

USOIL BEST PLACE TO SELL FROM|SHORT
USOIL SIGNAL
Trade Direction: short
Entry Level: 73.94
Target Level: 72.14
Stop Loss: 75.12
RISK PROFILE
Risk level: medium
Suggested risk: 1%
Timeframe: 2h
Disclosure: I am part of Trade Nation's Influencer program and receive a monthly fee for using their TradingView charts in my analysis.
✅LIKE AND COMMENT MY IDEAS✅

NZD/USD BEST PLACE TO SELL FROM|SHORT
NZD/USD SIGNAL
Trade Direction: short
Entry Level: 0.607
Target Level: 0.603
Stop Loss: 0.610
RISK PROFILE
Risk level: medium
Suggested risk: 1%
Timeframe: 3h
Disclosure: I am part of Trade Nation's Influencer program and receive a monthly fee for using their TradingView charts in my analysis.
✅LIKE AND COMMENT MY IDEAS✅

EUR/USD Daily Chart Analysis For Week of June 20, 2025Technical Analysis and Outlook:
During this week's trading session, the Eurodollar has encountered a significant decline, dipping below the Mean Support level of 1.149; however, it exhibited a modest recovery on Friday. Recent analyses indicate that the Euro is likely to decrease further to the Mean Support level of 1.148, with the potential for extending its bearish trend to reach 1.140. Nevertheless, there remains a possibility that the current recovery will persist, which could result in price movements targeting the Key Resistance level at 1.158 and potentially leading to a retest of the Outer Currency Rally's 1.163 mark.

AUDCAD BEARISH SETUPThe 4-hour chart for AUD/CAD shows a well-respected bearish descending channel, where price action remains capped below a strong dynamic resistance. Price recently rejected a key resistance zone near 0.8900, signaling a potential continuation to the downside.
Key Observations:
Bearish Channel Intact: Price continues to respect the upper and lower bounds of the descending channel.
Key Resistance Rejection: The pair tested the 0.8900 resistance area and faced immediate rejection (highlighted in red), forming a lower high.
Break of Trendline: A rising trendline from the recent low has been broken, reinforcing bearish pressure.
Support Zone in Sight: If bearish momentum continues, the next major support lies around 0.8780 – 0.8800, offering a possible target area.
Short-term Setup: Minor upward retracement may retest the broken trendline, but unless 0.8900 is breached, the bias remains strongly bearish.
Conclusion:
AUD/CAD remains under bearish control within the descending channel. The recent rejection from the upper boundary and break of the rising trendline suggest a high-probability move toward the 0.8800 support zone. Traders should look for confirmation of lower highs or bearish engulfing patterns to position short.

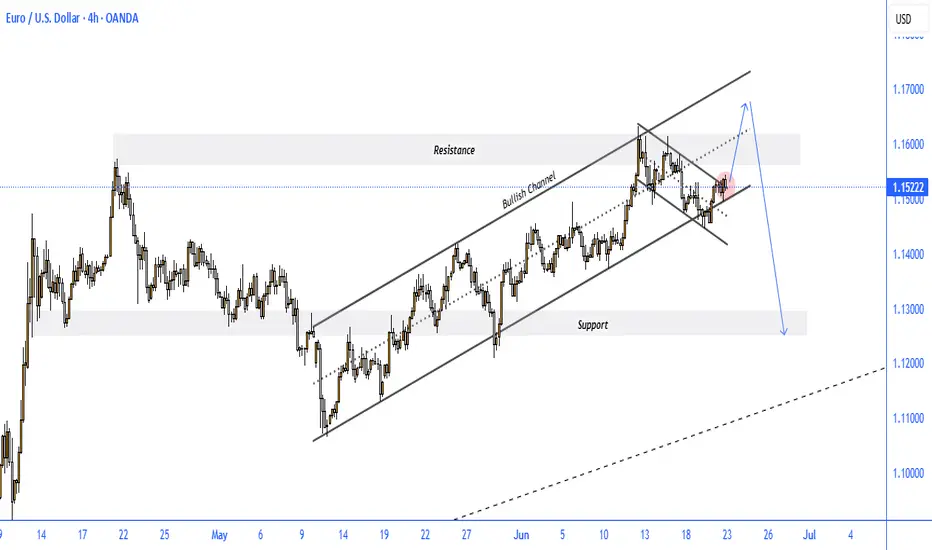
EURUSD BEARISH SETUP
The EUR/USD 4-hour chart reflects a significant technical setup, showing price action within a bullish ascending channel that has recently broken to the downside, forming a falling wedge pattern—typically a bullish continuation signal.
Key Observations:
Bullish Channel Broken: The price broke below the ascending channel earlier this month, signaling initial weakness.
Falling Wedge Formation: A bullish falling wedge has developed, and the pair is now testing its upper boundary near 1.1522, attempting a breakout.
Resistance Zone: The price is approaching a key resistance area between 1.1550 – 1.1600, which aligns with previous highs and the wedge's upper edge.
Scenario Projection:
A temporary bullish breakout toward the resistance zone is expected.
If the pair gets rejected from this resistance, a sharp decline toward the major support area near 1.1300 is likely.
Bearish Confirmation: A clear rejection at the resistance zone followed by a break below the recent minor support (red zone) would confirm the bearish move.
Conclusion:
While short-term bullish momentum may push EUR/USD slightly higher, the confluence of resistance levels suggests a high probability of rejection. Traders should watch for reversal signals in the 1.1550–1.1600 zone, as failure to break higher could lead to a bearish move toward 1.1300 in the coming days.
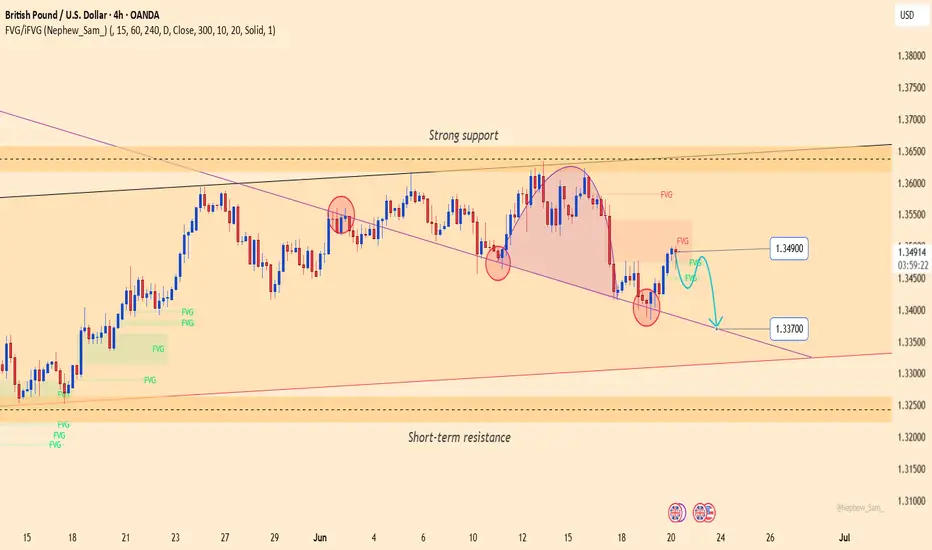
GBPUSD: Bearish pressure persistsGBPUSD is consolidating below a key medium-term resistance zone, with a rounding top and a minor head-and-shoulders pattern forming. The price is currently retesting the Fair Value Gap near 1.34900 — a potential reversal zone if it fails to break higher.
On the fundamental side, the Bank of England's decision to hold interest rates on June 19 disappointed the market. Meanwhile, the US dollar remains supported by safe-haven demand and the Federal Reserve’s hawkish tone, adding further pressure on GBP.
If GBPUSD fails to hold the trendline support near 1.33700, the risk of a deeper decline increases. Both the technical structure and macro fundamentals favor the bears.
NZDUSD My Opinion! BUY!
My dear subscribers,
My technical analysis for NZDUSD is below:
The price is coiling around a solid key level - 0.6015
Bias - Bullish
Technical Indicators: Pivot Points High anticipates a potential price reversal.
Super trend shows a clear buy, giving a perfect indicators' convergence.
Goal - 0.6043
My Stop Loss - 0.5999
About Used Indicators:
By the very nature of the supertrend indicator, it offers firm support and resistance levels for traders to enter and exit trades. Additionally, it also provides signals for setting stop losses
Disclosure: I am part of Trade Nation's Influencer program and receive a monthly fee for using their TradingView charts in my analysis.
———————————
WISH YOU ALL LUCK

APPLE Trading Opportunity! BUY!
My dear followers,
This is my opinion on the APPLE next move:
The asset is approaching an important pivot point 196.46
Bias - Bullish
Safe Stop Loss - 193.21
Technical Indicators: Supper Trend generates a clear long signal while Pivot Point HL is currently determining the overall Bullish trend of the market.
Goal - 202.06
About Used Indicators:
For more efficient signals, super-trend is used in combination with other indicators like Pivot Points.
Disclosure: I am part of Trade Nation's Influencer program and receive a monthly fee for using their TradingView charts in my analysis.
———————————
WISH YOU ALL LUCK

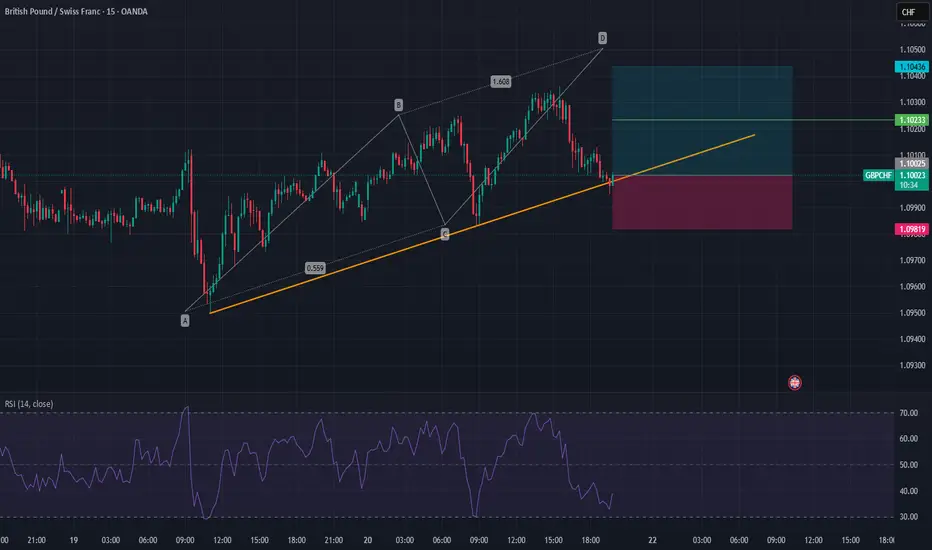
GBPCHF Will Explode! BUY!
My dear subscribers,
GBPCHF looks like it will make a good move, and here are the details:
The market is trading on 1.0989 pivot level.
Bias - Bullish
My Stop Loss - 1.0948
Technical Indicators: Both Super Trend & Pivot HL indicate a highly probable Bullish continuation.
Target - 1.1062
About Used Indicators:
The average true range (ATR) plays an important role in 'Supertrend' as the indicator uses ATR to calculate its value. The ATR indicator signals the degree of price volatility.
Disclosure: I am part of Trade Nation's Influencer program and receive a monthly fee for using their TradingView charts in my analysis.
———————————
WISH YOU ALL LUCK

GBP_NZD RISKY SHORT|
✅GBP_NZD is going up now
But a strong resistance level is ahead at 2.2591
Thus I am expecting a pullback
And a move down towards the target of 2.2524
SHORT🔥
✅Like and subscribe to never miss a new idea!✅
Disclosure: I am part of Trade Nation's Influencer program and receive a monthly fee for using their TradingView charts in my analysis.

EUR-NZD Bullish Breakout! Buy!
Hello,Traders!
EUR-NZD keeps growing and
The pair made a bullish breakout
Of the key horizontal level
Of 1.9270 and the breakout
Is confirmed so we are bullish
Biased and we will be
Expecting a further move up
Buy!
Comment and subscribe to help us grow!
Check out other forecasts below too!
Disclosure: I am part of Trade Nation's Influencer program and receive a monthly fee for using their TradingView charts in my analysis.

EUR-CHF Resistance Ahead! Sell!
Hello,Traders!
EUR-CHF keeps growing
But a strong horizontal
Resistance level is ahead
Around 0.9443 so after
The retest we will be
Expecting a local pullback
And a local bearish correction
Sell!
Comment and subscribe to help us grow!
Check out other forecasts below too!
Disclosure: I am part of Trade Nation's Influencer program and receive a monthly fee for using their TradingView charts in my analysis.

EUR_GBP WILL KEEP GROWI|LONG|
✅EUR_GBP broke the key horizontal level of 0.8540
Which is now a support then went down
To retest it and we are now seeing
A bullish reaction so I think that
The pair will go even higher up
LONG🚀
✅Like and subscribe to never miss a new idea!✅
Disclosure: I am part of Trade Nation's Influencer program and receive a monthly fee for using their TradingView charts in my analysis.

$JPIRYY -Japan CPI (May/2025)ECONOMICS:JPIRYY
May/2025
source: Ministry of Internal Affairs & Communications
- Japan's annual inflation rate edged down to 3.5% in May 2025 from 3.6% in the previous two months, marking the lowest level since November.
Price growth eased for clothing (2.6% vs 2.7% in April), household items (3.6% vs 4.1%), and healthcare (2.0% vs 2.2%), while education costs fell further (-5.6%). In contrast, inflation held steady for transport (2.7%) and miscellaneous items (1.3%), but accelerated for housing (1.1% vs 1.0%), recreation (3.0% vs 2.7%), and communications (1.9% vs 1.1%).
Meanwhile, prices of electricity (11.3% vs 13.5%) and gas (5.4% vs 4.4%) remained elevated.
On the food side, prices increased by 6.5%, staying at the slowest pace in four months, though rice prices soared over 100%, underscoring the limited impact of government efforts to rein in staple food costs.
Meanwhile, the core inflation accelerated to 3.7% from 3.5% in April, reaching its highest level in over two years, ahead of the summer election.
Monthly, the CPI rose 0.3%, after a 0.1% gain in April.

NZD-USD Bearish Breakout! Sell!
Hello,Traders!
NZD-USD broke out of the
Rising channel and then made
A bearish breakout of the
Horizontal key level too
Around 0.0602 which is
Now a resistance, then
Made a pullback and retest
And is going down again which
Reinforces our local bearish bias
And we will be expecting a
Further bearish move down
Sell!
Comment and subscribe to help us grow!
Check out other forecasts below too!
Disclosure: I am part of Trade Nation's Influencer program and receive a monthly fee for using their TradingView charts in my analysis.

Market next move Disruption to Bullish Scenario:
1. Resistance Zone Around 1.1540 – 1.1550
The price is approaching a psychological and potential resistance level around 1.1540–1.1550.
If the bulls fail to break this zone convincingly, a rejection could lead to a pullback or reversal.
2. Bearish Divergence in Volume
Despite upward movement in price, the volume doesn't show a strong bullish breakout. If momentum weakens while price rises, it might indicate a bearish divergence.
3. Rising Wedge Formation
The current price channel resembles a rising wedge, which is typically a bearish pattern.
A breakdown from this pattern (below the “support area” trendline) could trigger a sell-off toward 1.1500 or lower.
4. Economic Data or News Risk
Any sudden USD strength due to economic reports, Federal Reserve commentary, or geopolitical tension could flip the sentiment instantly.
Icons below the chart hint at upcoming news from the Eurozone or U.S., which could lead to volatility.
5. Overbought Condition
If technical indicators like RSI or MACD (not shown in this chart) are in overbought territory, a correction or profit-taking may happen soon.

Market next move 🔄 Disruption: Bullish Setup Building?
🧠 Problems With Bearish Interpretation:
1. Volume Surge Might Be Re-Accumulation:
Volume at the purple lightning symbol is rising — this could signal buyer interest, not distribution.
Green candles in this zone suggest aggressive buying on dips.
2. Failed Breakdown Earlier:
Price had a strong drop but bounced sharply, recovering nearly all losses.
That type of V-recovery often traps early shorts, leading to a rally.
3. Resistance Retest Might Be Breakout Setup:
The red box marks resistance, but price is consolidating just below it.
That’s typically bullish if no strong rejection occurs — classic “base before breakout.”
4. No Lower Low Yet:
Market structure still holding.
Until price breaks below ~$35.80, the bearish thesis remains speculative.
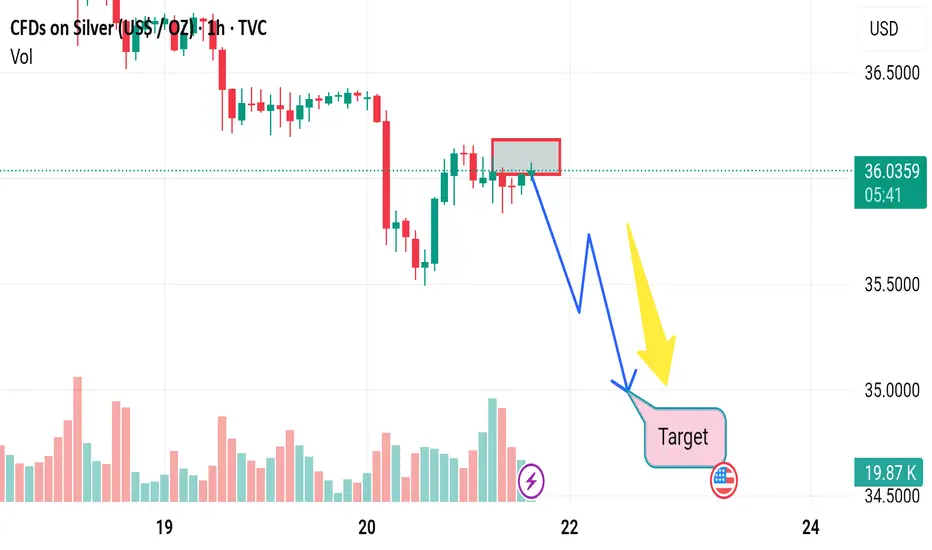
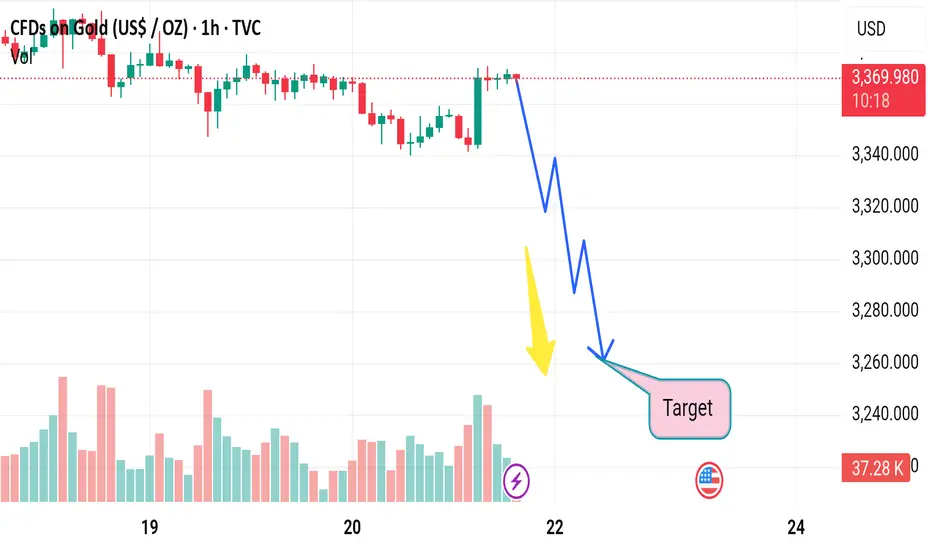
Market next target 📉 Original View (Bearish Outlook):
Predicts a downward move from around $3,370 to the target near $3,250.
Sharp drop illustrated with zigzag downward arrows.
Yellow arrow highlights growing volume — likely interpreted as early selling pressure.
---
🔄 Disruption: Bullish Reversal or Trap Setup
🧠 Problems With Bearish Thesis:
1. Volume Spike Might Indicate Demand:
The yellow arrow highlights a volume surge, but this might be buyer absorption, not selling dominance.
If this volume came during a wick-heavy candle or hammer, it suggests buying interest at lows.
2. No Break of Major Support Yet:
Price is still above $3,350, a key psychological and technical zone.
No clear breakdown has occurred — the downtrend is assumed, not confirmed.
3. Oversold Momentum?
Momentum indicators (not shown) may reveal oversold conditions, making a short-term rebound more probable.