Opportunity for selling EURUSDI see that EURUSD has confirmed strong resistance, so I took a sell trade with it.
Forex

Could the Aussie bounce from here?The price is falling towards the support level which is an overlap support that is slightly below the 61.8% Fibonacci retracement and could reverse from this level to our take profit.
Entry: 0.6455
Why we like it:
There is an overlap support that is slightly below the 61.8% Fibonacci retracement.
Stop loss: 0.6407
Why we like it:
There is a pullback support that aligns with the 145% Fibonacci extension.
Take profit: 0.6513
Why we like it:
There is an overlap resistance.
Enjoying your TradingView experience? Review us!
Please be advised that the information presented on TradingView is provided to Vantage (‘Vantage Global Limited’, ‘we’) by a third-party provider (‘Everest Fortune Group’). Please be reminded that you are solely responsible for the trading decisions on your account. There is a very high degree of risk involved in trading. Any information and/or content is intended entirely for research, educational and informational purposes only and does not constitute investment or consultation advice or investment strategy. The information is not tailored to the investment needs of any specific person and therefore does not involve a consideration of any of the investment objectives, financial situation or needs of any viewer that may receive it. Kindly also note that past performance is not a reliable indicator of future results. Actual results may differ materially from those anticipated in forward-looking or past performance statements. We assume no liability as to the accuracy or completeness of any of the information and/or content provided herein and the Company cannot be held responsible for any omission, mistake nor for any loss or damage including without limitation to any loss of profit which may arise from reliance on any information supplied by Everest Fortune Group.

Potential bullish rise?USD/CAD has reacted off the resistance level and could rise from this level to our take profit.
Entry: 1.3603
Why we like it:
There is a pullback resistance level.
Stop loss: 1.3540
Why we like it:
There is a pullback support level.
Take profit: 1.3704
Why we like it:
There is an overlap resistance level that lines up with the 50% Fibonacci retracement.
Enjoying your TradingView experience? Review us!
Please be advised that the information presented on TradingView is provided to Vantage (‘Vantage Global Limited’, ‘we’) by a third-party provider (‘Everest Fortune Group’). Please be reminded that you are solely responsible for the trading decisions on your account. There is a very high degree of risk involved in trading. Any information and/or content is intended entirely for research, educational and informational purposes only and does not constitute investment or consultation advice or investment strategy. The information is not tailored to the investment needs of any specific person and therefore does not involve a consideration of any of the investment objectives, financial situation or needs of any viewer that may receive it. Kindly also note that past performance is not a reliable indicator of future results. Actual results may differ materially from those anticipated in forward-looking or past performance statements. We assume no liability as to the accuracy or completeness of any of the information and/or content provided herein and the Company cannot be held responsible for any omission, mistake nor for any loss or damage including without limitation to any loss of profit which may arise from reliance on any information supplied by Everest Fortune Group.

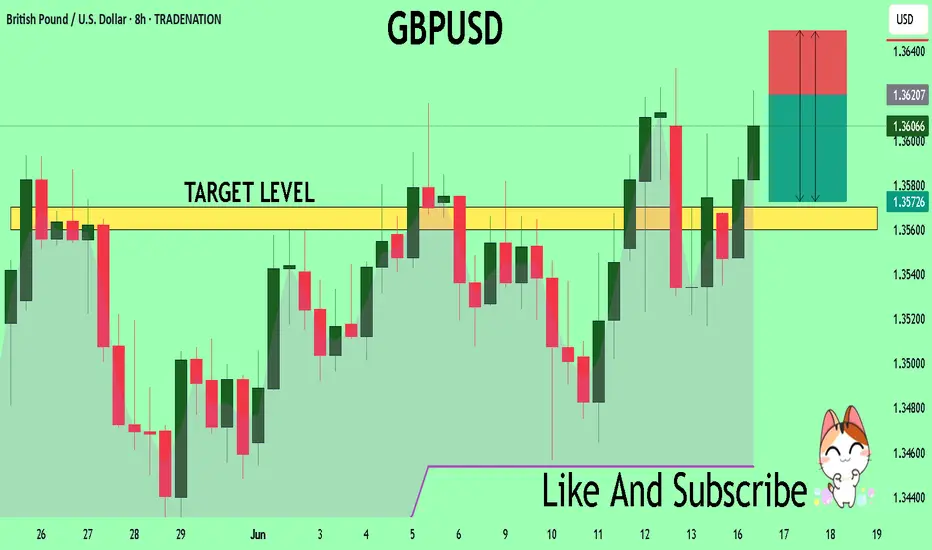
Bullish bounce off overlap support?GBP/USD is falling towards the support level which is an overlap support that aligns with the 38.2% Fibonacci retracement and could bounce from this level to our take profit.
Entry: 1.3443
Why we like it:
There is an overlap support level.
Stop loss: 1.3359
Why we like it:
There is a pullback support that is slightly below the 50% Fibonacci retracement.
Take profit: 1.3530
Why we like it:
There is a pullback resistance level.
njoying your TradingView experience? Review us!
Please be advised that the information presented on TradingView is provided to Vantage (‘Vantage Global Limited’, ‘we’) by a third-party provider (‘Everest Fortune Group’). Please be reminded that you are solely responsible for the trading decisions on your account. There is a very high degree of risk involved in trading. Any information and/or content is intended entirely for research, educational and informational purposes only and does not constitute investment or consultation advice or investment strategy. The information is not tailored to the investment needs of any specific person and therefore does not involve a consideration of any of the investment objectives, financial situation or needs of any viewer that may receive it. Kindly also note that past performance is not a reliable indicator of future results. Actual results may differ materially from those anticipated in forward-looking or past performance statements. We assume no liability as to the accuracy or completeness of any of the information and/or content provided herein and the Company cannot be held responsible for any omission, mistake nor for any loss or damage including without limitation to any loss of profit which may arise from reliance on any information supplied by Everest Fortune Group.

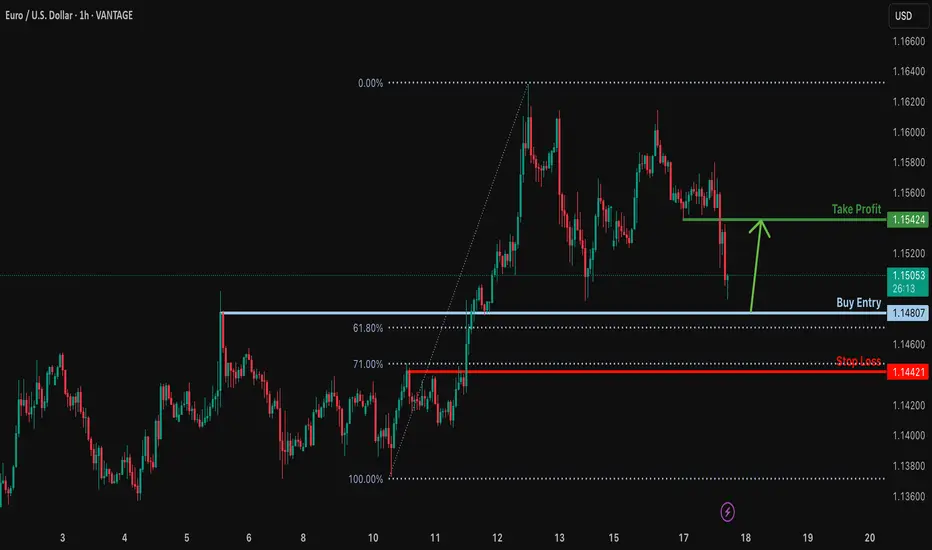
Bullish bounce?EUR/USD is falling towards the support level which is an overlap support that is slightly above the 61.8% Fibonacci retracement and could bounce from this level to our take profit.
Entry: 1.1480
Why we like it:
There is an overlap support that is slightly above the 61.8% Fibonacci retracement.
Stop loss: 1.1438
Why we like it:
There is a pullback support level that lines up with the 71% Fibonacci retracement.
Take profit: 1.1542
Why we like it:
There is a pullback resistance.
njoying your TradingView experience? Review us!
Please be advised that the information presented on TradingView is provided to Vantage (‘Vantage Global Limited’, ‘we’) by a third-party provider (‘Everest Fortune Group’). Please be reminded that you are solely responsible for the trading decisions on your account. There is a very high degree of risk involved in trading. Any information and/or content is intended entirely for research, educational and informational purposes only and does not constitute investment or consultation advice or investment strategy. The information is not tailored to the investment needs of any specific person and therefore does not involve a consideration of any of the investment objectives, financial situation or needs of any viewer that may receive it. Kindly also note that past performance is not a reliable indicator of future results. Actual results may differ materially from those anticipated in forward-looking or past performance statements. We assume no liability as to the accuracy or completeness of any of the information and/or content provided herein and the Company cannot be held responsible for any omission, mistake nor for any loss or damage including without limitation to any loss of profit which may arise from reliance on any information supplied by Everest Fortune Group.
GBPUSD Will Collapse! SELL!
My dear friends,
Please, find my technical outlook for GBPUSD below:
The price is coiling around a solid key level - 1.3619
Bias - Bearish
Technical Indicators: Pivot Points Low anticipates a potential price reversal.
Super trend shows a clear sell, giving a perfect indicators' convergence.
Goal - 1.3570
Safe Stop Loss - 1.3649
About Used Indicators:
The pivot point itself is simply the average of the high, low and closing prices from the previous trading day.
Disclosure: I am part of Trade Nation's Influencer program and receive a monthly fee for using their TradingView charts in my analysis.
———————————
WISH YOU ALL LUCK
EURCAD Set To Fall! SELL!
My dear subscribers,
This is my opinion on the EURCAD next move:
The instrument tests an important psychological level 1.5718
Bias - Bearish
Technical Indicators: Supper Trend gives a precise Bearish signal, while Pivot Point HL predicts price changes and potential reversals in the market.
Target - 1.5674
My Stop Loss - 1.5743
About Used Indicators:
On the subsequent day, trading above the pivot point is thought to indicate ongoing bullish sentiment, while trading below the pivot point indicates bearish sentiment.
Disclosure: I am part of Trade Nation's Influencer program and receive a monthly fee for using their TradingView charts in my analysis.
———————————
WISH YOU ALL LUCK

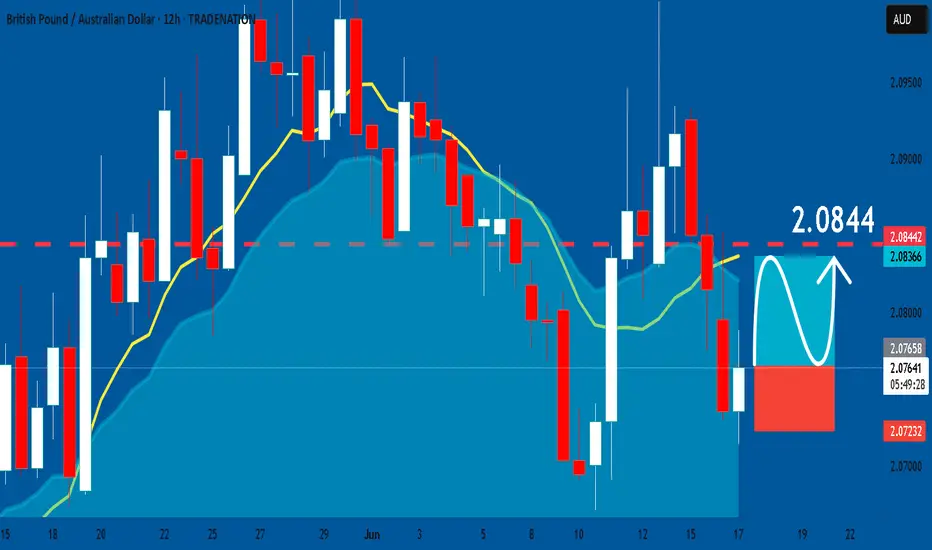
GBPAUD: Bullish Continuation & Long Trade
GBPAUD
- Classic bullish formation
- Our team expects growth
SUGGESTED TRADE:
Swing Trade
Buy GBPAUD
Entry Level - 2.0766
Sl - 2.0723
Tp - 2.0844
Our Risk - 1%
Start protection of your profits from lower levels
Disclosure: I am part of Trade Nation's Influencer program and receive a monthly fee for using their TradingView charts in my analysis.
❤️ Please, support our work with like & comment! ❤️
GOLD MARKET ANALYSIS AND COMMENTARY - [Jun 16 - Jun 20]The unrest in the Middle East this week has boosted safe-haven demand for gold, pushing it above $3,400 an ounce.
While gold has broken several recent technical resistance levels, it is unlikely that it will hit a new record high next week. The ongoing conflict between Israel and Iran provides safe-haven support, but historically, gold rallies driven by geopolitical events tend to be short-lived.
Gold is currently outperforming the US dollar, which has struggled to attract safe-haven funds.
Iran launched a retaliatory airstrike on Israel on Friday night (June 13), Reuters reported. Air raid sirens sounded across Israel and authorities urged residents to take shelter in shelters.
The Israeli military said Iran fired nearly 100 missiles, most of which were intercepted or missed their targets.
Israel's Channel 12 reported two people were seriously injured, eight were moderately injured and 34 suffered shrapnel injuries.
Iran's Islamic Revolutionary Guard Corps said it had carried out military operations against dozens of targets in Israel.
The Iranian Revolutionary Guards' news website released a message that evening saying the "powerful and precise" counterattack was in retaliation for Israel's "invasion" of many parts of Iran and the killing of many senior military commanders, nuclear experts and Iranian civilians, including children.
Wider Middle East Conflict Could Erupt
Israel destroyed Tehran's military command system early Friday and struck key Iranian nuclear facilities. The Fars news agency, which is affiliated with Iran's Revolutionary Guards, cited data saying the Israeli attack killed dozens of people in Iran and wounded more than 300.
Israel has carried out large-scale airstrikes on multiple locations in Iran since early Friday, bombing Iranian nuclear facilities and military targets.
Reuters said Israel's attacks on Iran during the day and Iran's retaliation have raised concerns about a broader conflict in the region.
All Eyes on the Fed
While gold will continue to be affected by geopolitical developments, market attention will also be on the Federal Reserve, particularly Chairman Powell, who will speak after next week’s monetary policy meeting.
Economists generally expect the Fed to keep rates unchanged. However, expectations are growing that Powell could begin paving the way for a rate cut later this year.
The latest inflation data and signs of a slowing US economy have given the Federal Reserve room to cut rates. However, growing geopolitical uncertainty may prompt some market participants to adjust their expectations.
Overall assessment of the basic environment
The gold market in particular will still receive absolute support when there are too many risks appearing, from geopolitical developments to interest rate prospects, and tariffs. Major conflicts in the Middle East, Russia - Ukraine, trade war between the US and the rest of the world, ... are all sudden risk support that makes gold likely to surge in the short term. Therefore, in general vision, gold is considered the top safe-haven asset in the global unstable environment and it tends to increase in price in the current context.
Economic Data to Watch Next Week
Monday: State Manufacturing Survey, Bank of Japan Monetary Policy Meeting
Tuesday: US Retail Sales
Wednesday: US Weekly Jobless Claims, US Housing Starts, Federal Reserve Monetary Policy Meeting
Thursday: US Markets Closed for Black Lives Matter Day, Swiss National Bank Monetary Policy Meeting, Bank of England Monetary Policy Meeting
Friday: Philadelphia Fed Manufacturing Survey
Technical Outlook Analysis OANDA:XAUUSD
On the daily chart, gold has almost achieved all the bullish targets noted by readers in last week's weekly issue, initially at $3,371, then at the full price point and finally at $3,435. Gold can still continue to increase in price as technical conditions still absolutely support the short-term trend channel, while the long-term trend channel and the nearest support is the EMA21.
In terms of momentum, the Relative Strength Index (RSI) is sloping up after receiving support from 50 and is still far from overbought territory, indicating that there is still a lot of room for upside ahead.
To sum up, as long as gold remains within/above the price channel, it remains bullish in the short term. Any dips that do not break below the price channel should only be considered as short-term corrections or a new buying opportunity.
Finally, the notable positions will be listed as follows.
Support: 3,400 – 3,371 USD
Resistance: 3,435 – 3,500 USD
SELL XAUUSD PRICE 3497 - 3495⚡️
↠↠ Stop Loss 3501
BUY XAUUSD PRICE 3374 - 3376⚡️
↠↠ Stop Loss 3370

EURCHF: Bearish Continuation & Short Signal
EURCHF
- Classic bearish setup
- Our team expects bearish continuation
SUGGESTED TRADE:
Swing Trade
Short EURCHF
Entry Point - 0.9403
Stop Loss - 0.9417
Take Profit - 0.9380
Our Risk - 1%
Start protection of your profits from lower levels
Disclosure: I am part of Trade Nation's Influencer program and receive a monthly fee for using their TradingView charts in my analysis.
❤️ Please, support our work with like & comment! ❤️

USDJPY What Next? SELL!
My dear followers,
This is my opinion on the USDJPY next move:
The asset is approaching an important pivot point 145.13
Bias - Bearish
Safe Stop Loss - 145.55
Technical Indicators: Supper Trend generates a clearshort signal while Pivot Point HL is currently determining the overall Bearish trend of the market.
Goal - 144.31
About Used Indicators:
For more efficient signals, super-trend is used in combination with other indicators like Pivot Points.
Disclosure: I am part of Trade Nation's Influencer program and receive a monthly fee for using their TradingView charts in my analysis.
———————————
WISH YOU ALL LUCK

EURUSD: Weak Market & Bearish Forecast
Our strategy, polished by years of trial and error has helped us identify what seems to be a great trading opportunity and we are here to share it with you as the time is ripe for us to sell EURUSD.
Disclosure: I am part of Trade Nation's Influencer program and receive a monthly fee for using their TradingView charts in my analysis.
❤️ Please, support our work with like & comment! ❤️

GBPUSD: Expecting Bullish Movement! Here is Why:
It is essential that we apply multitimeframe technical analysis and there is no better example of why that is the case than the current GBPUSD chart which, if analyzed properly, clearly points in the upward direction.
Disclosure: I am part of Trade Nation's Influencer program and receive a monthly fee for using their TradingView charts in my analysis.
❤️ Please, support our work with like & comment! ❤️

USDCHF My Opinion! SELL!
My dear followers,
I analysed this chart on USDCHF and concluded the following:
The market is trading on 0.8147 pivot level.
Bias - Bearish
Technical Indicators: Both Super Trend & Pivot HL indicate a highly probable Bearish continuation.
Target - 0.8131
About Used Indicators:
A super-trend indicator is plotted on either above or below the closing price to signal a buy or sell. The indicator changes color, based on whether or not you should be buying. If the super-trend indicator moves below the closing price, the indicator turns green, and it signals an entry point or points to buy.
Disclosure: I am part of Trade Nation's Influencer program and receive a monthly fee for using their TradingView charts in my analysis.
———————————
WISH YOU ALL LUCK

GOLD Massive Long! BUY!
My dear friends,
GOLD looks like it will make a good move, and here are the details:
The market is trading on 3389.4 pivot level.
Bias - Bullish
Technical Indicators: Supper Trend generates a clear long signal while Pivot Point HL is currently determining the overall Bullish trend of the market.
Goal -3396.3
Recommended Stop Loss - 3385.8
About Used Indicators:
Pivot points are a great way to identify areas of support and resistance, but they work best when combined with other kinds of technical analysis
Disclosure: I am part of Trade Nation's Influencer program and receive a monthly fee for using their TradingView charts in my analysis.
———————————
WISH YOU ALL LUCK

XBR/USD.30M CHART PATTERN.(XBRUSD) on the 30-minute timeframe, here’s the technical outlook:
Chart Pattern Observed:
You have a symmetrical triangle breakout setup:
The price is currently breaking above the triangle resistance.
There’s a bullish bias post-breakout with two targets marked.
Targets Identified on Your Chart:
1. First Target: ~$79.00
2. Second Target: ~$81.50
These are based on the typical triangle breakout projection, where:
The height of the triangle is measured and added to the breakout point.
The first target often aligns with a conservative measure.
The second target aims for the full projection of the pattern height.
Current Price: ~$75.32 (as shown)
Confirmation:
To validate this breakout:
Watch for a candle close above the triangle resistance.
Confirm with volume increase or continued momentum.
Stop-loss is ideally below the triangle support, near ~$73.00.
Let me know if you want risk/reward calculations or a similar setup on a different asset.

Euro can turn around and start to fall to support areaHello traders, I want share with you my opinion about Euro. Observing this chart, we can see how the price earlier dropped toward the 1.1360 support level and successfully broke it. Then we saw a short recovery move, but the price once again returned to the downside and retested the support line from below. After that, the market created a strong upward impulse, broke back above the 1.1360 level, and entered a phase of consolidation inside a range. This range held for some time, with price respecting both its upper and lower boundaries. Eventually, we saw a breakout from this consolidation, followed by another strong bullish impulse and a steady climb above the 1.1530 zone, where price is currently trading. However, the price has now approached a critical structure and is showing signs of weakening momentum. In my mind, the Euro may attempt one more small move up but then turn around and start declining toward the 1.1530 support level, breaking the ascending support line as well. That's why my TP is this support level, which coincides with the support area. Please share this idea with your friends and click Boost 🚀
Disclaimer: As part of ThinkMarkets’ Influencer Program, I am sponsored to share and publish their charts in my analysis.

EUR/USD 4H CHART PATTERN.EUR/USD 4H chart, the chart analysis shows a bearish outlook after a potential rising channel breakdown. Here are the key bearish targets as shown:
---
📉 Bearish Targets:
1. First Target Zone (FVG Area)
Price Range: Around 1.1400 – 1.1350
This is marked as the Fair Value Gap (FVG) and could act as the first reaction/support zone.
2. Second Target Zone
Price Range: Around 1.1250 – 1.1200
Clearly labeled as “TARGET” in the middle of the chart.
3. Final Target Zone (Major Support)
Price Range: Around 1.1100 – 1.1050
Also labeled “TARGET” at the bottom. This aligns with a past support level and previous consolidation area.
---
🧭 Summary:
A breakdown from the rising channel is expected.
Price may drop first into the FVG zone (1.1350 area).
Then continue down to 1.1200.
Final support target sits near 1.1050.
Would you like me to help identify bullish invalidation or risk levels as well?

GOLD - Price will bounce from support area and start to growHi guys, this is my overview for XAUUSD, feel free to check it and write your feedback in comments👊
Some days ago price declined to $3220 level and then started to grow, and soon reached $3380 level and even broke it.
Then price started to trades inside wedge, where it at once started to decline and in a short time declined to support line of wedge.
After this, Gold rose and broke $3220 level and continued to move up in wedge, where it also made two gaps before.
Price rose to $3380 level and some time traded very close to this level, but later corrected to support line.
Next, price made a strong impulse, breaking $3380 level and exiting from wedge as well, and continued to grow.
Recently, Gold started to fall, so I think that it will fall to support area and then bounce up to $3500
If this post is useful to you, you can support me with like/boost and advice in comments❤️
Disclaimer: As part of ThinkMarkets’ Influencer Program, I am sponsored to share and publish their charts in my analysis.

US500.4h chart pattern.US500 (S&P 500), here's a breakdown of the potential bearish targets you're pointing to:
---
📉 Market Overview:
Price has broken below the trendline and is currently hovering near the Ichimoku cloud support.
The bearish path is outlined on the chart with multiple target zones indicated by horizontal lines and a large blue arrow.
---
🎯 Bearish Targets (as shown on your chart):
1. First Target Zone: Around 5,920 – 5,930
Minor support area just below current range.
2. Second Target Zone: Around 5,860 – 5,870
A more solid prior demand zone.
3. Final Target Zone: Around 5,780 – 5,790
Major support zone, aligns with previous consolidation area.
---
🧭 Strategy Notes:
If price closes below 5,950 on the 4H or daily candle, it may confirm a stronger bearish continuation.
Keep an eye on volume and price reaction near 5,920, as this is likely the first bounce zone.
Would you like a marked-up version of this chart with exact price levels and arrows for clarity?

Gold holds above key zoneAfter breaking the major resistance at 3,392 USD — a level that had been rejected multiple times in the past — XAUUSD is undergoing a slight pullback to retest the newly established support. The bullish reaction in this area suggests that buyers are still in control of the trend.
In the current context, U.S. retail sales have fallen more than expected, reinforcing expectations that the Fed may cut interest rates soon. This puts pressure on the dollar and benefits gold.
The primary scenario is a bounce from the current support toward the next resistance area near 3,481 USD. The 3,392 USD level has now become a key support to sustain the ongoing bullish structure.

EURUSD: Awaiting Confirmation to Continue the UptrendThe EUR/USD pair closed yesterday at 1.1550, moving within the 1.1526–1.1558 range. The euro continues its bullish trend, driven by U.S. inflation data coming in lower than expected, which increases expectations of an upcoming rate cut by the Fed. In addition, geopolitical tensions in the Middle East—particularly between Israel and Iran—have slightly weakened the U.S. dollar, providing additional support to the euro.
From a technical perspective, the price is currently correcting toward the 1.1480 area, where the ascending trendline converges with the exponential moving average. This is a key support zone. If it holds and a clear bullish signal emerges, EURUSD could rebound and move toward the 1.1610 resistance level.
Main scenario: look for buying opportunities around 1.1480 if a bullish confirmation appears, targeting 1.1610.
Alternative scenario: if the 1.1480 level is broken, the short-term uptrend could be at risk.

Gold Soars – Heading Towards 3,500 USD/ounce?Gold prices closed yesterday at 3,457.7 USD/ounce, up 0.12% from the previous day, fluctuating between 3,453.7 USD and 3,458.1 USD/ounce, marking the highest level in the past two months.
XAU/USD is currently maintaining an uptrend within a well-defined price channel, with strong support at the 3,390–3,400 range. After a short correction, the price could continue to rise if it holds above the EMA34, with the next target towards the 3,445–3,460 range and further up to 3,500 USD/ounce.
This upward momentum is supported by geopolitical tensions in the Middle East, particularly between Israel and Iran, driving demand for gold as a safe-haven asset. U.S. CPI data lower than expected has also increased expectations of a Fed rate cut, alongside central banks increasing gold reserves, all contributing to the continued rise in gold prices.
