NZDJPY “Kiwi Poised to Fly as Japan Muddles ThroughNZDJPY shows a bullish breakout from a descending trendline, with bullish structure holding near 87.20–87.25.
Key resistance targets:
87.97 (Previous high)
88.64 (Next resistance / projected fib target)
Two upside scenarios are shown:
Conservative target: ~87.97
Aggressive swing: ~88.64
If 87.00–87.20 zone holds as support, expect bullish continuation.
🧩 Current Bias: Bullish
📌 Key Fundamentals Driving NZDJPY
NZD Side (Strengthening):
RBNZ hawkish hold: RBNZ recently kept rates at 5.50% and warned that inflation remains persistent, requiring prolonged tight policy.
Resilient NZ GDP: Stronger-than-expected GDP print signals economic resilience.
Terms of trade improvement: Commodity exports holding firm, China consumption rebound showing hints of demand recovery (see recent 618 festival sales data).
AUD correlation: AUD and NZD are moving together; if AUD strengthens, NZD often follows.
JPY Side (Weakening):
BoJ remains ultra-dovish: Despite inflation trends, BoJ is hesitant to tighten further, preferring gradual tapering.
Yen under pressure from yield differentials: Global central banks (like RBNZ, Fed) remain hawkish while BoJ is not.
Geopolitical funding flows: JPY used as a funding currency amid global volatility (carry trade boost for NZDJPY).
⚠️ Risks That May Reverse the Trend
BoJ surprise tightening rhetoric (e.g. bond purchase taper announcement).
China data deterioration, hurting Kiwi sentiment.
Sharp equity sell-off and geopolitical escalation (Yen safe-haven reversal).
📅 Important News to Watch
🇳🇿 NZ Trade Balance (upcoming)
🇯🇵 Tokyo Core CPI (Jun 28) – Critical for BoJ policy speculation.
RBNZ or BoJ member speeches (hawkish or dovish shifts)
Fed tone shift or US dollar strength spillover
🏁 Who Leads the Move?
NZDJPY could lead among yen crosses due to the RBNZ’s clear inflation fight versus BoJ’s passive stance. NZDJPY is also more responsive to commodity and global risk-on flows than EURJPY or USDJPY.
Forexsetup

GBPUSD Sell Limit Activated June 17 2025This trade was taken today, (tuesday- june 17, 2025). Based on 1H timeframe Supply. I wait for London Session and check for possible liquidity sweep in 15 min and 5min timeframe. I noticed a CHOCH followed by tap in Supply zone of the schematics. I decide to create a sell limit order during New York Session to maximize the Risk to Reward Ratio. (Check the charts for detailed label and movement). 1:7RR
Wyckoff schematics in 1H timeframe--> confluence of supply in lower timeframes for validity.
RR:7
Another classic distribution. patience is the key :)
#wyckoff
#sell
#supplyanddemand

EURUSD Long Setup – Bullish Rejection from Demand ZoneEURUSD remains supported by strong eurozone fundamentals and broad USD softness. The pair has retraced into a key demand zone around 1.1490 and is showing signs of bullish rejection. With the Fed likely to pause further rate hikes and the ECB maintaining a steady tone, the bias favors further upside toward recent highs.
⚠️ Geopolitical tensions in the Middle East (Israel-Iran conflict) have introduced mild safe haven demand, but so far the USD has underperformed versus the euro, suggesting EUR remains relatively insulated.
Watch for confirmation and entries within the blue demand box.
🔍 Technical Analysis:
Structure: Clear uptrend with higher highs and higher lows. Price retraced to a well-defined 1H demand zone between 1.1490–1.1500.
Setup: Anticipating a bounce from the demand zone targeting the recent high near 1.1620–1.1630.
Entry Zone: 1.1490–1.1500 (bullish reaction area)
Target: 1.1620–1.1630 (previous supply zone)
Stop Loss: Below 1.1439 (recent swing low)
Risk-Reward Ratio: Approximately 1:2.5
🧠 Fundamental Context (as of June 16):
EUR Bias: Bullish – ECB has paused cuts; euro is resilient despite geopolitical headwinds.
USD Bias: Bearish – Fed is on pause; soft inflation data and geopolitical risks weigh on dollar strength.
Key Drivers:
Fed dovish tone (FOMC pause, lower CPI)
Strong EU resilience despite global tensions
CHF and JPY attracting safe haven flows over USD
📅 Key Events to Watch:
US Core PCE (next major inflation readout)
FOMC commentary and Fed speakers
Eurozone CPI and sentiment data

USDJPY – Triangle Complete? Wave (v) Setup BuildingWave (iv) appears to be ending with an (e) wave tag into the 0.764 retracement.
📉 Price remains capped within the contracting triangle — watching closely for breakdown confirmation.
If this plays out, wave (v) of C could now begin unfolding with initial focus on 140.00 and below.
🧩 Structure: (a)-(b)-(c)-(d)-(e) triangle complete
📏 Final wave (e) aligns with 0.764 retracement and structural resistance
⚠️ RSI divergence + weakening momentum support the bearish scenario

Opportunity for selling EURUSDI see that EURUSD has confirmed strong resistance, so I took a sell trade with it.

Opportunity for buying EURUSDEURUSD touched strong support, so I think it will rise further, as shown.

Week of 6/15/25: AU AnalysisLast week took the prior week's high and showed large rejection. Expecting this week to take the weak low and liquidity from all the lows to at least the extreme of the daily swing.
Major news:
FOMC - Wednesday

USDCAD Long – Wyckoff Spring PlaybookCause > Effect. Behavior > Breakouts.
We just printed a classic Spring + Test setup.
Here’s how the puzzle came together:
🔍 Accumulation Context:
Market ranged quietly for hours – demand building below the surface.
Spike down into previous demand zone with climax volume – the shakeout.
Quick reclaim of the zone with bullish absorption signals the Spring.
📈 Execution Plan:
Entry just above the spring low at 1.3617
Stop below spring at 1.3612
Targeting inefficiencies at 1.3645 and 1.3651 (prior supply pockets)
🎯 Why I Like This Setup:
Structure: Matches Wyckoff Spring logic (Phase C → D transition)
Volume: Shakeout came with high effort, followed by efficient reclaim
Timing: Happens in a zone where other traders might still be stuck short
> “In trading, the ones who recognize intent get in before confirmation.”
This trade idea isn’t about being right — it’s about understanding behavior.
I’m not reacting to candles. I’m tracking the motive behind them.

Opportunity to buy EURUSDI see an opportunity to buy the EUR/USD pair from the support shown in the image and the target will be 1.16316

USDJPY Pullback? Watch OB + Fib Confluence for the Next Buy WaveUSDJPY | 30-Min Chart – Smart Money Buy Setup in Progress
After a sharp bullish rally, USDJPY is setting up for a classic retracement buy scenario. We're now watching a key confluence zone between Fibonacci levels, a bullish order block, and internal trend structure — all lining up for a high-probability long setup.
🔍 Trade Breakdown:
📉 Pullback Expected Before Next Rally:
Price rejected near short-term resistance and is retracing from local highs.
Retracement aligns with key OB + 61.8–79% Fib zone = institutional entry zone.
🟣 Order Block (OB) Demand Zone: 143.086 – 142.828
Last bullish candle before explosive rally = demand OB.
OB sits within premium Fib retracement = Smart Money buy zone.
📐 Fibonacci Levels (Swing Low to High):
61.8% ≈ 143.200
70.5% ≈ 143.000
79% ≈ 142.828
This is the kill zone for institutional longs — where Smart Money typically enters before expansion.
🔵 Projected Play:
Retracement to OB/Fib confluence.
Bullish rejection from OB zone.
Impulse move targeting previous highs and beyond.
💡 Target Level: 144.396 (sits just above prior high and aligns with -27% Fib extension)
📉 Current Bias:
Short-term retracement ➝ Mid-term bullish continuation
Expecting price to dip into OB then launch.
🧠 Chart Ninja Entry Plan:
🔹 Entry Zone: 143.086 – 142.828
🔻 SL Below: 142.650 (below OB/Fib + structure wick)
📈 Target: 144.396
⚖️ RRR: 1:3+ — high confluence risk-managed buy
🔍 Technical Confluence Checklist:
✅ OB demand zone
✅ 61.8–79% retracement
✅ Bullish market structure
✅ Internal channel support
✅ Momentum slow before entry
📍 Save this chart — don’t chase, let price come to you
💬 Comment if you're watching this OB too
👣 Follow @ChartNinjas88 for precision-based setups daily

GBPUSD Approaches Key Resistance: Watch for Bearish ReversalGBPUSD pair is trading within a clearly defined ascending channel on the 1-hour chart, showing a short-term bullish structure. However, this bullish move appears corrective within a broader consolidation range capped near the 1.3590 resistance zone.
🔍 Technical Breakdown:
Current Price: 1.35535
Immediate Resistance: 1.35885–1.35929 (previous highs and psychological level)
Support Levels:
Trendline support near 1.3530
Horizontal support: 1.34282, 1.34176
Structure:
Price has formed a bullish flag breakout and is now approaching key resistance.
A new higher high is anticipated toward 1.3590, but this level has repeatedly rejected price in the past.
The projected path indicates a potential liquidity grab above 1.3590 followed by a sell-off toward 1.3420–1.3410 area, aligning with a trendline break scenario.
Bearish Scenario:
A strong rejection from the 1.3590 zone, especially if accompanied by bearish divergence or a strong candle close, could trigger a shift back down to the 1.3417–1.3428 support zone.
This would confirm a short-term top and potential retracement toward lower liquidity zones.
📊 Fundamental Backdrop:
USD-side:
Recent U.S. labor market strength (e.g. ADP report and low jobless claims) supports a hawkish bias, favoring USD upside.
However, Fed policymakers remain cautious due to trade tensions and tariff uncertainty. This has injected short-term volatility into USD pairs.
GBP-side:
UK economic data has been mixed, with GDP growth forecasts under scrutiny.
BoE policymakers are dovish, emphasizing weak productivity and wage pressures, making the pound vulnerable to downside catalysts.
📌 Conclusion:
Watch for a potential bull trap near 1.3590, followed by a bearish reversal toward 1.3420–1.3410 if momentum weakens and sellers step in. This would complete the expected technical leg down and align with broader risk sentiment if dollar strength returns.

USDJPY Tests Channel Support After ADP Shock — Rebound Ahead?In the last hour's candle after the ADP Non-Farm Employment Change Index was released, USDJPY ( FX:USDJPY ) started to fall, but considering the position of this pair, I think we can have a good Risk-To-Reward even if the Stop Loss (SL) is touched.
USDJPY is trading near the lower line of the ascending channel and the Support zone(143.870 JPY-143.430 JPY) .
From an Elliott Wave perspective , USDJPY appears to be completing a corrective pattern .
I expect USDJPY to rise at least to the Potential Reversal Zone(PRZ) .
Note: Stop Loss = 143.220 JPY
Please respect each other's ideas and express them politely if you agree or disagree.
U.S. Dollar/Japanese Yen Analyze (USDJPY), 1-hour time frame.
Be sure to follow the updated ideas.
Do not forget to put a Stop loss for your positions (For every position you want to open).
Please follow your strategy and updates; this is just my Idea, and I will gladly see your ideas in this post.
Please do not forget the ✅' like '✅ button 🙏😊 & Share it with your friends; thanks, and Trade safe.

USDCAD Rebound from Key Support – Bullish Setup in PlayUSDCAD pair has reached a technical inflection point at key support around 1.3700, where it is attempting a rebound after several days of bearish momentum. With recent Canadian data showing underlying economic strain and the U.S. dollar reacting to rate expectations and tariff news, this area becomes crucial for the next directional move.
🔍 Technical Analysis
Support Level: Price has respected the horizontal support at 1.3700–1.3685, forming a possible double-bottom structure on the 4H chart.
Bullish Reversal Zone: The latest candle shows a strong rejection wick at the support zone, suggesting bullish interest. The structure aligns with a classic bullish reversal pattern.
Target Zones:
First TP: 1.3849 (previous high / supply zone).
Second TP: 1.3860–1.3870 (Fibonacci extension + minor resistance).
Invalidation (SL): Below 1.3685, further downside may open to 1.3632.
🧠 Fundamental Context
U.S. Side:
GDP and NFP data have recently come out mixed, reducing the immediate pressure on the Fed to hike rates further.
Tariff uncertainty and appeal plans by the Trump administration are increasing near-term USD volatility.
US bond yields are firming again, giving the dollar mild support.
Canada Side:
Canadian Q1 GDP disappointed at 0.1%, lower than expected.
BoC is likely to hold rates steady, but the economy shows weak business investment and softening consumption growth.
Crude oil, Canada’s key export, is still under pressure, slightly weakening CAD.
✅ Conclusion
This setup favors a short-term long on USDCAD from current levels, targeting the upper resistance zone at 1.3849–1.3860. A break and close above 1.3870 could extend toward 1.3900. However, caution should be exercised with upcoming U.S. labor and trade data that may fuel volatility.

XAUUSD: Break or Bounce at ResistanceGold has reached a critical technical zone near a long-term descending trendline and horizontal resistance around $3360–3380. Price action suggests a make-or-break moment is unfolding.
Key Technical Structure:
Descending Trendline Resistance from the April high capped the rally.
Current move has formed a rising wedge — typically bearish if broken.
Price is testing resistance confluence — a rejection could send Gold lower.
Scenarios to Watch:
🔹 Bullish Breakout:
Clean breakout and close above $3380 confirms trendline invalidation.
Upside projection points to $3500 — previous high and psychological level.
🔹 Bearish Rejection:
Failure to break the trendline + wedge breakdown can drag price to:
$3280 (38.2% Fib)
$3160–3200 zone (61.8% Fib + demand area)
Macro Factors to Watch:
Tariff escalation between US–EU could trigger risk-off → bullish for Gold.
FOMC policy pause, weak job data, or inflation rebound also support upside.
Stronger USD or yield spike may trigger wedge breakdown → bearish.
Conclusion:
XAUUSD is at a key inflection point. Wait for confirmation: either a clean breakout or a clear reversal rejection. Trade the resolution, not the anticipation.

DXY Short-Term Reversal Zone in SightUS Dollar Index (DXY) is approaching a strong support zone at 98.90–98.00, which has historically acted as a base for bullish reversals. The price is now testing the lower bound of this zone after a steady downtrend from the 101.94 high.
Key Technical Structure:
Support Zone: 98.90–98.00 (tested 3+ times)
Double Bottom Potential forming if bulls hold the zone
Upside Targets:
101.94: Key horizontal resistance
103.50: Swing high from early April
Scenarios to Watch:
🔹 Bullish Rebound:
Price bounces off 98.90–98.00 support
Confirmation: Break and close above 100.50 near-term resistance
Could fuel move back to 101.94, possibly 103.50
🔹 Bearish Breakdown:
Daily close below 98.00 would invalidate bullish setup
Opens downside to 97.00 and even 95.50
Macro Drivers to Watch:
FOMC speakers and interest rate guidance
US jobless claims or inflation surprise
Risk-off sentiment (benefits USD) vs. continued global risk appetite
Conclusion:
DXY is trading at a make-or-break support zone. Watch for clear bullish reaction or bearish breakdown before committing. The setup favors a bounce unless 98.00 fails.

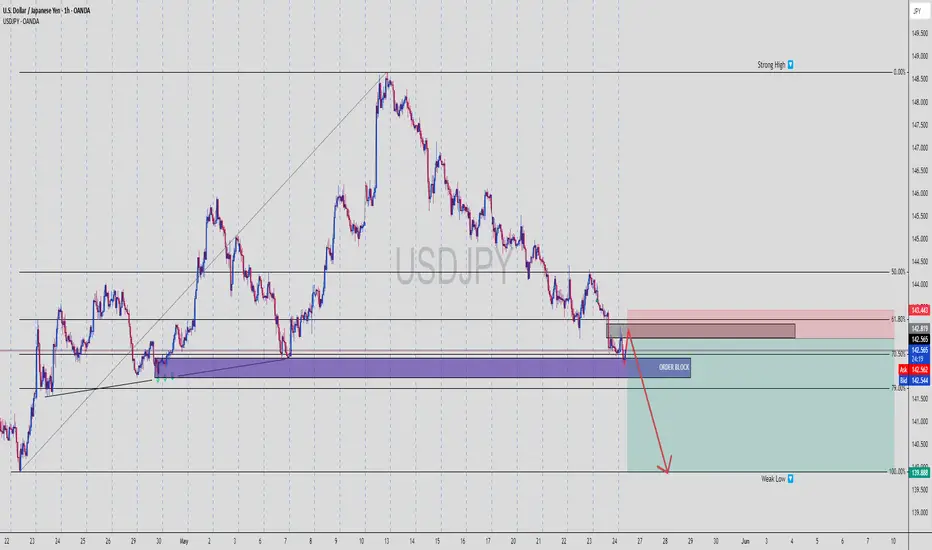
USDJPY | FVG + OB + Weak Low Target = Textbook SMC Setup📊 USDJPY | 1H Bearish Play – Smart Money In Control
We’re seeing a classic setup where price retraces into a bearish zone of confluence and prepares for a selloff toward internal liquidity. Check the breakdown:
🔻 1. Structure Shift Confirmed
Price broke structure on the downside after forming a lower high
Current move is a retracement into discount OB zone
Clear rejection is forming, signaling short momentum incoming
🟪 2. Zone Confluence
📌 Order Block (OB): Sitting just under the 61.8% Fib
📌 Fair Value Gap (FVG): Mitigated perfectly
📌 Fib Retracement: Price reacts between 61.8% and 70.5% — classic Smart Money play
📌 Previous Demand Turned Supply: This level is now acting as a rejection zone
This is stacked confluence — just how Smart Money likes to move.
💣 3. Entry Strategy
Entry Zone: 142.55 (midpoint of the OB reaction area)
Stop Loss: Above 143.443 (above OB + liquidity wick)
Take Profit: 139.888 (weak low, previous liquidity resting point)
⚖️ 4. Risk-to-Reward Ratio (RRR)
🎯 TP = 139.888
📍 Entry = 142.550
🔐 SL = 143.443
✅ RRR ≈ 1:3.5
A great example of high-probability short setup using pure Smart Money logic.
📉 5. Why This Works
Retail traders will try to long at this zone hoping for a breakout
Smart Money uses this zone to engineer liquidity
They tap into the FVG/OB, then target internal liquidity and weak lows
Clean, controlled sell-off expected down to 139.888
🧠 SMC Insights
This chart is all about liquidity engineering:
Push up into OB
Reject at premium pricing
Drive down to weak low to collect stops
Possibly reverse or continue trend from there
💬 Comment “FVG TAP + OB = 🔥” if you spotted this setup early
💾 Save it before the drop happens
📤 Share with a fellow SMC trader who needs this breakdown
XAUUSD Taps Premium OB – Bearish Liquidity Trap Incoming!📉 XAUUSD Smart Money Setup – Bearish Rejection from Premium Supply Zone
Let’s get straight into it, fam. Gold (XAUUSD) just made a textbook move into a premium Order Block, and it’s screaming liquidity trap + reversal opportunity.
🧠 Market Structure Breakdown:
✅ Clean internal bearish structure
✅ Lower highs and lower lows maintained
✅ Current price rally = retracement into OB, not a reversal
This is a pullback into premium, designed to bait breakout buyers before slamming back down. Smart Money 101.
🔮 Key Confluences:
🟣 Order Block Zone:
3,290.000 – 3,331.405
Origin of impulsive bearish move
Aligned with supply imbalance and unmitigated sell orders
Tapped perfectly at 61.8%–79% Fib levels
🔻 Fibonacci Retracement (Swing High to Low):
50.0% → Current market price (3,286.370)
61.8% → OB mid zone
70.5% – 79% = ideal entry zone for institutional short positions
📍 Target Zone:
3,120.765 (0% Fib)
Solid RR with minimal drawdown potential
🧠 Smart Money Narrative:
Market induced sellers at the low
Rallied back up aggressively to entice breakout longs
Now entering sell-side OB where Smart Money is looking to unload positions
Retail sees a “breakout” — we see distribution. 💼
💡 Entry Strategy:
📌 Entry: 3,290 – 3,331 (OB + 70.5%–79% Fib)
📌 Stop Loss: Above 3,333 zone
📌 TP1: 3,210
📌 TP2: 3,150
📌 Final TP: 3,120
🎯 RRR: 1:4.5++ – chef’s kiss for swing traders
🔁 Risk Flow Checklist:
✔️ Structure confirms bearish bias
✔️ OB unmitigated + untouched since initial drop
✔️ High-volume price sweep prior to tap
✔️ Clean internal liquidity grabs before entry
This is the kind of setup you wait for — not force.
🧘 Pro Tip:
Let the OB do the heavy lifting. Don’t chase price — wait for the rejection signal:
Wick rejection
Bearish engulfing
Shift in internal market structure
Patience = profits. 💸
🧨 Summary:
This XAUUSD chart is a Smart Money masterclass:
Clean bearish BOS
Premium OB with Fib confluence
Trap setup above liquidity
Big RRR with minimal exposure
🗣️ Comment “GOLD SNIPER” if you caught the tap!
🚀 Save and study this setup — they don’t come often, but when they do, they pay big.

GBPUSD Hits Institutional Supply – Bearish Rejection Loading…⚠️ GBPUSD Smart Money Setup – Premium Price, Weak Low, Juicy Liquidity Below!
We’ve officially entered Smart Money playground territory on GBPUSD.
Here's what's happening:
🧠 Market Structure Narrative:
🔹 Price ran straight into a premium OB
🔹 Internal structure shift already played out
🔹 Now in distribution territory, prepping for a dump
Price has tapped into a high-probability sell zone (purple OB zone) between 1.34500–1.35000, where Smart Money is most likely positioned to unload shorts.
🟪 Order Block Confluence:
📌 OB Range:
Base: 1.34500
Cap: 1.35000
This zone caused the previous bearish impulse – unmitigated until now
Price reacted sharply upon entry = signs of institutional interest
💡 Clean, unmitigated supply = chef’s kiss setup.
🔻 Liquidity Engineering:
🧊 Below current price sits a “Weak Low” marked around 1.32400
💰 Below that: massive Sell-Side Liquidity at 1.31400
📌 This = high-probability magnet for Smart Money to drive price lower
🔁 Fibonacci Confluence (if applied):
Entry zone aligns with 70.5–79% retracement of previous impulse leg = premium risk zone for pro sellers.
💣 Entry Strategy:
🎯 Sell Zone: 1.34500–1.35000
📍 SL: Above 1.35100 (above OB + liquidity grab buffer)
📍 TP1: 1.32400 (Weak Low)
📍 TP2: 1.31400 (Sell-side Liquidity)
📍 RRR: Up to 1:5+ depending on entry precision
This is a swing trader’s dream — premium risk, maximum reward.
💡 Confirmation Tools:
✅ Bearish engulfing candle on LTF
✅ Internal BOS on M15-H1
✅ Rejection wick from OB or candle body stall = sniper entry
Be the sniper — not the FOMO chaser. 🎯
🧠 Key Lesson:
"Weak lows exist to be broken. OBs exist to be respected. Combine both = Smart Money sniper mode."
Let the trap trigger and ride the liquidity wave down.
🗣️ Drop a 💀 if you’re watching this setup play out!
📌 Save this chart — it’s a Smart Money blueprint.

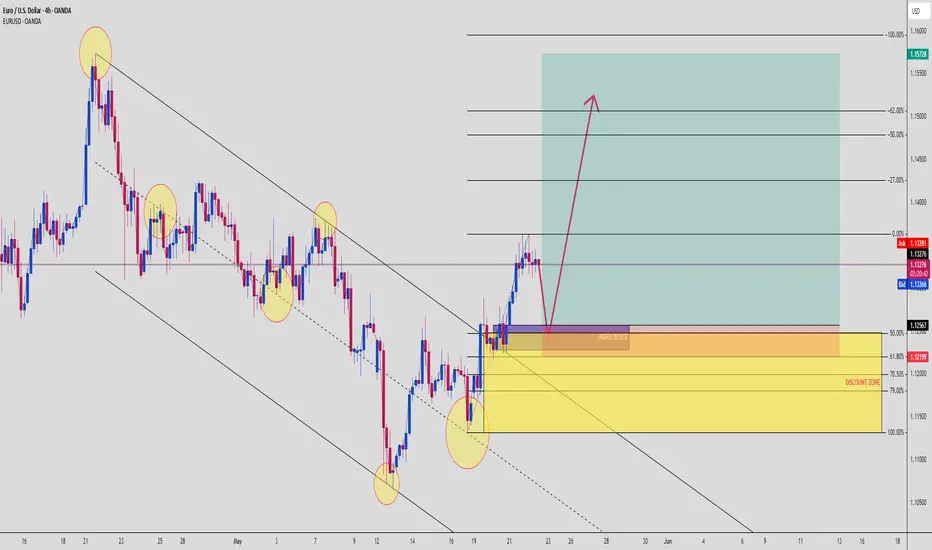
EURUSD Bounce Incoming? Smart Money Reversal BrewingThis EURUSD setup is a case study in smart money accumulation after a liquidity sweep + channel break. Price action is aligning like clockwork for a long setup, and the confluences are hard to ignore.
🧠 Breakdown:
🔻 Bearish Channel Structure: Market has respected this descending channel since early May — multiple taps, respected diagonals
🟡 Reversal Clues: Clean sweep of liquidity at the channel bottom with bullish engulfing candle
💰 Order Block + Discount Zone:
OB marked inside the 50%–79% retracement range
🔹 OB top: ~1.12567
🔹 Key entry: Between 1.12567 – 1.12199
🔹 SL: Below 1.1180 (clean under discount zone)
📈 TP zone: 1.15728 — previous market structure high and fib -100% level
✅ Risk-Reward: 1:5+ if played with precision
🔍 Why this setup is 🔥:
✅ Channel break = structure shift
✅ OB + Fib 61.8%–79% = strong demand confluence
✅ Liquidity below equal lows already taken
✅ Sharp bullish move after sweep = signs of big players entering
✅ Price likely to pull back to mitigate before exploding
🧠 Institutional Logic:
“Liquidity fuels price. Structure guides it. Confluence confirms it.”
The market swept lows, flipped structure, and now is likely returning to fill orders before the next leg up. This is a classic bullish mitigation play.
📊 If price taps into the OB and shows bullish confirmation — this is a sniper zone.
Set alerts. Wait for the wick. Enter on the flip. Let the market work for you, not the other way around.
"Dare to Swipe EUR/USD Gains with Our Risky Heist Blueprint?"Ultimate EUR/USD Heist Plan: Snag Profits with the Thief Trading Strategy! 🚀💰
🌍 Greetings, Wealth Raiders! Ciao, Hello, Bonjour, Hola! 🌟
Fellow profit hunters, get ready to crack the EUR/USD "The Fiber" Forex vault with our slick Thief Trading Strategy! 🤑💸 This plan blends razor-sharp technicals and fundamentals to loot the market. Follow the chart’s long-entry blueprint to strike at high-risk zones like the Red MA (short-term traders) or the Red Zone Resistance (long-term traders). It’s a wild ride—overbought conditions, consolidation, and potential trend reversals mean bears are lurking! 🐻 Stay sharp, grab your profits, and treat yourself—you’ve earned it! 🎉💪
📈 Entry: Storm the Vault!
The market’s ripe for a bullish grab! 💥 Place buy limit orders within the most recent 15 or 30-minute swing low/high levels. Set alerts on your chart to stay locked in. 🔔
🛑 Stop Loss: Guard Your Loot!
Set your Thief SL at the nearest swing low on the 4H timeframe for day/swing trades. Adjust based on your risk tolerance, lot size, and number of orders. Safety first! 🔒
🎯 Targets: Claim Your Prize!
🏴☠️ Short-Term Target: 1.14700
🏴☠️ Long-Term Target: 1.17000
👀 Scalpers, Listen Up!
Stick to long-side scalps. Got deep pockets? Jump in now! Otherwise, join swing traders for the heist. Use trailing stop-loss to lock in gains and protect your stash. 💰
🐂 Why EUR/USD is Hot!
The Fiber’s bullish surge is fueled by key fundamentals. Dive into Macro, COT Reports, Quantitative Analysis, Sentiment, Intermarket trends, and future targets via the linkss below for the full scoop. 👉🔗. Stay informed to stay ahead! 📰
⚠️ Trading Alert: News & Position Management
News releases can shake the market like a heist gone wrong! 🗞️ To protect your profits:
🚫 Avoid new trades during news events.
🛡️ Use trailing stops to secure running positions.
💥 Boost the Heist!
Hit the Boost Button to supercharge our Thief Trading Strategy! 💪 Every click strengthens our crew, making it easier to swipe profits daily. Join the squad, trade smart, and let’s make money rain! 🌧️💵

GBP/USD Cable Heist:Join the Thief Trading Style to Raid Profit!GBP/USD Cable Heist Plan - Thief Trading Style 😎💸
Greetings, wealth chasers and market bandits! 👋💰
Welcome to the Thief Trading Style, blending sharp technicals with savvy fundamentals to raid the GBP/USD "Cable" Forex Market. 📊 Follow the strategy outlined in the chart, focusing on long entries targeting the high-stakes Red Zone. 🌋 Expect an overbought market, consolidation, or trend reversal where bears might set traps. 🐻 Nail the plan, grab your profits, and treat yourself—you’ve earned it! 🎯💵🎉
Entry 📈: The heist begins! 🚨 Wait for the MA breakout at 1.34700, then strike for bullish gains. 🐂 Set buy stop orders above the moving average or place buy limit orders within a 15/30-minute timeframe at the recent swing high/low. ⏰ Don’t miss the move—set a chart alert to catch the breakout! 🔔
Stop Loss 🛑: Listen up, crew! 🗣️ For buy stop orders, hold off on setting your stop loss until after the breakout. 🚀 Place it at the recent swing low on the 4H timeframe (1.33300) for swing/day trades. 📍 Adjust based on your risk, lot size, and number of orders. Play smart, or you’re dancing with danger! 🔥😈
Target 🎯: Aim for 1.37000 or bail early if the market shifts. 🏃♂️ Scalpers, stick to long-side trades. 👀 Got deep pockets? Jump in now. 💪 Otherwise, join the swing traders and execute the plan with a trailing stop loss to secure your loot. 🔒💰
Market Outlook: GBP/USD is riding a bullish wave, fueled by key fundamentals. 🐃 Dive into the COT Report, macro data, sentiment, intermarket analysis, and future trend targets via the linkss below for the full scoop. 🔗👉
Why This Trade?: The bullish setup on GBP/USD is backed by strong technical signals, with the MA breakout confirming upward momentum. 📈 Fundamentals, including favorable COT positioning and positive macro data, suggest sustained strength in the pound. 💪 Intermarket correlations and sentiment analysis further align with a bullish outlook, making this an ideal moment to strike the Cable for potential high rewards. 🌟 The Red Zone target at 1.37000 offers a prime risk-to-reward ratio for disciplined traders. 🤑
⚠️ Trading Alert: News & Position Management 📰:
News releases can shake up prices and volatility. 🌪️ To stay safe:
Skip new trades during news events. 🚫
Use trailing stops to lock in profits and protect open positions. 🔐
Boost the Heist! 🚀: Support our plan by hitting the Boost Button to supercharge our market raids. 💥 With the Thief Trading Style, we’re stacking profits daily. 📈 Join the crew, execute the plan, and let’s make money moves! 💪🤝😺
Stay sharp for the next heist plan. Until then, keep robbing the markets! 🤑🐱👤

GBPUSD Retests Bullish Order Block – Smart Money Loading Up!📈 GBPUSD SMC Bullish Setup – Institutional Re-Entry Into Power Zone
Traders, this is a prime example of how Smart Money manipulates liquidity, taps deep into premium OBs, and prepares for explosive continuation moves. Let’s break it down step-by-step…
🔍 Market Structure Insight:
We’ve seen a clear bullish BOS (Break of Structure) after a strong impulsive move that broke past previous highs.
Now price is retracing into the bullish Order Block, giving a golden opportunity for re-entry — but only if you know what to look for.
🔲 Key Confluences:
💎 Order Block:
Marked between 1.3332 – 1.3290, this purple zone aligns with:
Breaker candle after a liquidity sweep
Prior imbalance zone
Institutional volume spike
📐 Fib Retracement:
From the swing low to high:
61.8% → 70.5% golden zone nested inside the OB
79% just below — great stop loss placement
📉 Weak High Above:
Current price action shows the market stalling near a weak high at 1.3400 — ripe for targeting in the next expansion.
📌 Strong Low at 1.3245:
Protected unless structure breaks. This helps confirm bullish bias remains intact.
🧠 Smart Money Logic:
This isn't retail "support."
Smart Money took out early sellers, pushed price impulsively, then returned to mitigate orders inside the OB before continuing the expansion.
This retracement = institutional reloading zone.
That red candle into purple? That’s the bait. 🧨
🎯 Entry Plan:
✅ Wait for bullish confirmation inside OB (engulfing, MS shift, or liquidity wick)
✅ Ideal entry at 1.3332–1.3300
✅ Stop below 79% Fib (~1.3289)
✅ Target:
TP1: 0% Fib (~1.3400)
TP2: -27% Fib extension (~1.3445)
TP3: Moon mission? 😏
RRR ~ 1:3.5+ — solid trade for swing traders and intraday scalpers alike!
🧘♂️ Psychology & Patience Reminder:
Let price come to you.
This setup rewards discipline and confirmation — don’t FOMO early.
Watch for trap wicks and engineered fakeouts at the OB zone.
You’re not chasing price.
You’re sitting where Smart Money leaves footprints. 👣
⚠️ Risk Tip:
✅ Stick to your model
✅ 1–2% risk max
✅ Scale partials at key levels
✅ Don’t revenge trade if price reacts first without you — next setup is always coming
🔁 Summary:
This GBPUSD chart is a masterclass in Smart Money structure:
Bullish BOS
Return to Order Block
Fib confluence
Weak high liquidity target
Perfect RRR setup
🧠 Let’s play it like a pro. If OB holds — the market flies. If not, we step out, risk-managed, and wait.
📣 Comment “GBPUSD SNIPER” if you’re ready for the OB bounce.
📈 Tag your trading fam to keep them on the money wave!

USDCAD Consolidation Within Bullish Flag – Targets 1.4130USDCAD is consolidating inside a descending flag structure following a strong impulsive rally earlier in May. The current pullback is orderly and corrective, indicating potential for continuation higher. If price breaks above 1.3960, this flag breakout could extend toward 1.4130 and possibly 1.4225. With CAD weakening on soft oil prices and USD regaining strength from yield-driven flows, the bias remains bullish while price stays above 1.3870.
🔍 Technical Analysis
Pattern: Bullish flag forming after a strong rally
Support Zone: 1.3870–1.3900 → base of flag
Resistance/Breakout Zone: 1.3960–1.3980 → upper flag line
Structure:
Higher lows holding firm
Fib confluence near 1.3933 (23.6% retracement)
Target Levels:
1.4130 – 50% fib level + previous structure resistance
1.4225 – 61.8% fib zone from March–April high
📈 Bias: Bullish continuation on breakout
🌍 Fundamental Context
🇺🇸 U.S. Dollar (USD)
Supported by:
Higher bond yields
Fed expected to hold rates higher for longer
Safe-haven inflows post-Moody’s downgrade fading
USD Index recovering broadly across majors
🇨🇦 Canadian Dollar (CAD)
Oil prices softening due to global demand concerns (China slowdown, US inventories)
BoC likely done hiking — no fresh bullish catalysts
CAD correlation with crude oil adds downside risk if energy markets weaken further
🎯 Trade Plan
Entry: Break and close above 1.3960
Stop Loss: Below 1.3870 (flag support zone)
Targets:
TP1: 1.4130 (structure resistance + fib level)
TP2: 1.4225 (swing high + golden ratio)
⚠️ Risk Factors to Watch
If USD sentiment shifts (e.g., dovish Fed speaker) → breakout may fail
Crude oil rebound would support CAD and cap USD/CAD upside
False breakouts common near 1.3960 — wait for confirmation (strong candle close)
🧭 Conclusion
USD/CAD remains in a bullish consolidation phase with a clear continuation setup. A break above 1.3960 would confirm a flag breakout targeting 1.4130 and 1.4225. With the macro backdrop favoring the USD and energy-linked CAD weakening, this setup offers clean structure and potential for follow-through.
