Us30 sell market technicals Us30 sell market technicals. Looking like a nice drop from trend lines. Signal was sent to GTE vip.
Forexsignal

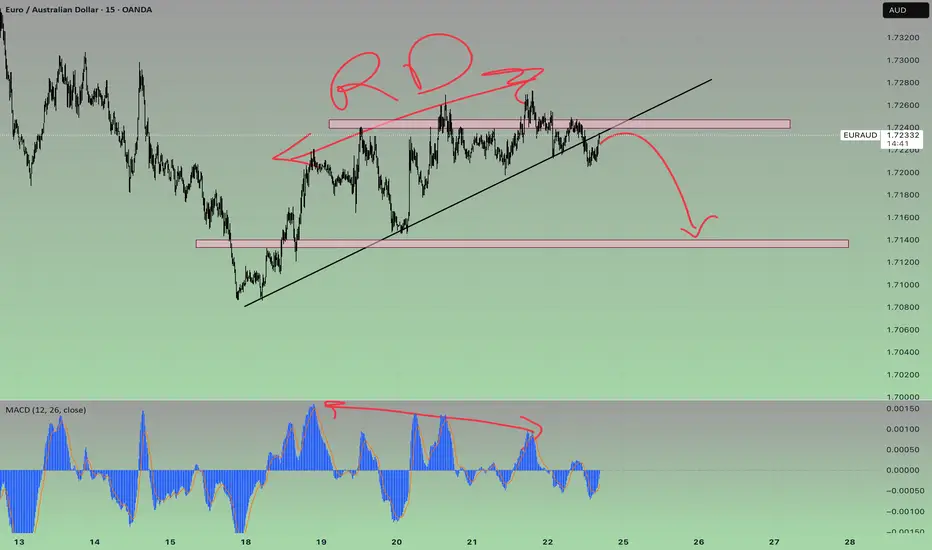
EURAUD SELLThe overall trend of this pair is bullish 📈, but in the lower timeframe, a sell opportunity can be considered 📉. Let’s take advantage of this setup! ⚡️
#EURAUD
xAUUSD Structure, Sentiment & Strategic Patience📊 XAUUSD WEEKLY INSIGHT | Structure, Sentiment & Strategic Patience
As we close out a volatile trading week, let’s zoom out and assess what’s really happening with gold. The recent price action on the higher timeframes is revealing important signals — and it’s time to take a strategic pause before the next move.
🔍 WEEKLY SNAPSHOT:
Gold experienced a sharp correction of over $50, followed by a late-session recovery into the weekend. The result?
✅ Long upper wicks on both the W1 and D1 candles,
✅ Signs of rejection from all-time highs,
✅ Yet price still managed to close above the 50% candle body range — momentum is cooling, but not reversing (yet).
The big question now is:
Is this a healthy pullback within the uptrend… or the beginning of something deeper?
📐 Key Takeaways:
Structure on higher timeframes remains bullish – price is still moving within the primary ascending channel
Short-term retracement has reached the 0.5–0.618 Fibonacci zone on H1 and H2 – a potential decision area
End-of-week buying indicates positioning by informed participants, not random volatility
No confirmation of a major reversal yet – but conditions are developing
📌 Key Levels to Watch:
Resistance Zones: 3025 – 3033 – 3040 – 3046 – 3056
Support Zones: 3014 – 3005 – 3000 – 2993 – 2986
🧠 Mindset Going Into Next Week:
Don’t rush it.
Let Monday’s open reveal the volume story — whether through gaps, spikes, or clean structure. The best setups form after the market shows its hand, not before.
This is where strategic patience beats emotional trading.
📣 Final Note:
Stay focused on structure. Respect your levels. Watch how price reacts — not just where it goes.
And remember: sometimes no trade is a powerful trade when the market is indecisive.
More insights coming soon on market psychology and execution discipline.
💬 Feel free to leave a comment, follow for updates, or share your own views below.
Wishing everyone a strong and clear start to the new week,
— AD | Money Market Flow

GBPUSD Selling Opportunities SpottedWe are basically anticipating for more selling momentum as price formed a wedge at a resistance level. Also, lower timeframe price action shows more bearish activities.

EURUSD Bulls Eyeing FOMC–Will Powell’s Dovish Tone Fuel a Rally?As we approach the much-anticipated FOMC rate decision and Powell’s press conference , market sentiment is shifting, and EURUSD ( FX:EURUSD ) traders are closely watching for clues on the Federal Reserve’s next move . With recent economic data pointing to signs of slowing growth and cooling inflation, the Fed might adopt a more dovish tone , fueling further upside for EURUSD .
Key Factors Driving the Bullish Outlook :
Inflation & Economic Data : CPI and PPI data indicate a gradual cooling of inflation, which strengthens the case for a potential rate cut later this year. If Powell acknowledges this shift, it could weigh on the dollar.
Market Pricing of Rate Cuts : Investors are already pricing in multiple Fed rate cuts for 2024. A dovish Powell could accelerate these expectations, weakening USD and pushing the EURUSD higher.
------------------------------------------------------------------
Now let's take a look at the EURUSD chart on the 2-hour time frame .
EURUSD is moving near the Resistance zone($1.0983-$1.0916) and Yearly Resistance(1) .
Regarding Elliott Wave theory , it seems that EURUSD has managed to complete the main wave 4 . The structure of the main wave 4 is the Double Three Correction(WXY) .
The main wave 5 is likely to complete near the upper line of the ascending channel(possible) and Monthly Resistance(4) .
I expect EURUSD to rise in the coming hours to the targets I have indicated on the chart, although the Federal Reserve Conference could create long shadows , but I think the supply and demand zones will still work but still pay more attention to money management today .
Note: If EURUSD can break below the Potential Reversal Zone(PRZ) , there is a possibility of further decline in EURUSD.
Please respect each other's ideas and express them politely if you agree or disagree.
Euro/U.S. Dollar Analyze (EURUSD), 2-hour time frame.
Be sure to follow the updated ideas.
Do not forget to put a Stop loss for your positions (For every position you want to open).
Please follow your strategy and updates; this is just my Idea, and I will gladly see your ideas in this post.
Please do not forget the ✅' like '✅ button 🙏😊 & Share it with your friends; thanks, and Trade safe.

GBPJPYHello friends
Given the good price growth, we can now buy in support areas during pullbacks that the price makes, of course with capital and risk management...
*Trade safely with us*

I HAVE A NEW STRATEGY! Watch it work for me. SAYS BUY🚨 Exclusive Trading Opportunity – Limited Time Only! 🚨
I've developed an amazing new trading strategy that’s completely unique and never seen before! It’s called the Skyline Scalping Strategy, and it’s designed to pinpoint market direction with extreme accuracy—something that can easily be back-tested by reviewing my previous predictions.
For a limited time, I’ll be posting daily trade signals based on this strategy, allowing you to see exactly where I anticipate the market will move next. Whether you're an amateur trader or a seasoned professional, this is your chance to witness something game-changing in action.
⚠️ Disclaimer: I’m not providing financial advice—just sharing the direction I am planning to make money. The Skyline Scalping Strategy works exclusively on the daily chart, so stay tuned and watch as the predictions unfold!
FOLLOW NOW and don’t miss out on these powerful insights! 📊🔥
Vertical lines are colored and placed to indicate the expected direction of the price. Just my thoughts.

breakdown of the setup! Read CaptionThis is a 4-hour chart of Gold (XAU/USD) showing a bullish channel with price currently trading near its upper boundary. Here’s a breakdown of the setup:
Market Structure:
Trend: Gold is in a strong uptrend, moving within a well-defined ascending channel.
Current Price: Around $2,998, with a recent high of $3,000.55.
Key Target: A potential bullish breakout targeting $3,020+.
Support Zones: Highlighted between $2,930 - $2,860 as possible retracement levels.
Potential Scenarios:
Bullish Continuation: If price holds above the midline of the channel, a push toward $3,020 - $3,050 could be expected.
Pullback & Retest: A minor correction toward $2,970 - $2,960 before resuming its uptrend.
Deeper Retracement: A stronger pullback could lead to a test of $2,930 or even $2,860, aligning with the lower trendline.
Trading Plan:
Buy on dips if price retests lower support zones within the channel.
Breakout trade above $3,020 could indicate further upside potential.
Risk management: Watch for bearish rejection candles near resistance.
This setup favors bullish continuation, but a short-term pullback is possible before the next leg up. 📈🔥

XAUUSD - Short Trade after Resistance Test ($3,005 - $3,010)Short after Resistance Test ($3,005 - $3,010)
📌 Entry: Sell within the $3,005 - $3,010 range if there is a clear rejection and price weakness.
🎯 Take-Profit 1: $2,985 (immediate support)
🎯 Take-Profit 2: $2,970 (recent lows)
🛑 Stop-Loss: $3,015 (above resistance)
🔹 Probability: High – Confirmed by weak volume on rallies and strong resistance.
Trade Rationale:
Key Resistance Zone ($3,005 - $3,010): This level has historically acted as a supply zone, where sellers step in to push prices lower. If price action shows rejection (e.g., wicks or bearish engulfing candles), it confirms a high-probability short setup.
Weak Volume on Rallies: Volume analysis suggests that bullish momentum lacks strong participation. A rising price with decreasing volume often signals an exhaustion of buyers, increasing the probability of a reversal.
Technical Indicators Align:
RSI (Relative Strength Index): Overbought or showing bearish divergence, signaling potential downside pressure.
MACD (Moving Average Convergence Divergence): Losing bullish momentum or forming a bearish crossover, indicating potential for a pullback.
Donchian Trend & Moving Averages : Price is testing upper Donchian bands and key moving averages are suggesting overextension.
Risk-Reward Ratio:
> The stop-loss at $3,015 ensures protection against false breakouts.
> The first take-profit ($2,985) targets the nearest support, locking in quick profits.
> The second take-profit ($2,970) aligns with recent swing lows, maximizing the downside potential.
Final RRR (TP2) is 1 : 3,4
Conclusion:
A rejection from the $3,005 - $3,010 resistance zone presents a solid short opportunity, backed by weak bullish momentum, technical confluence, and favorable risk-reward. If the price fails to break higher and shows signs of rejection, this trade setup has a strong probability of success.
⚠️ Final Warning: Trading involves significant risk, and past performance does not guarantee future results. Always use proper risk management and never trade with money you can't afford to lose. This analysis is for educational purposes only and not financial advice.
What do you think about this setup? Would you take this trade? Drop your thoughts in the comments! 👇

EURUSD Faces Resistance zone – Will Bears Take Over?The EURUSD ( FX:EURUSD ) has reached the Resistance zone($1.0983-$1.0916) as I expected in my previous post . Can the EURUSD break the Resistance zone($1.0983-$1.0916) ?
EURUSD is moving near the Resistance zone($1.0983-$1.0916) , the Resistance line , and Yearly Resistance(1) .
According to the Elliott Wave theory , EURUSD seems to have completed 5 impulse waves and we can expect Corrective Waves .
Also, we can see the Regular Divergence(RD-) between Consecutive Peaks .
I expect the EURUSD to decline to at least the Support zone($1.0817-$1.0760) in the coming hours after breaking the lower line of the ascending channel . One of the EURUSD targets could be as wide as the ascending channel .
Note: If EURUSD breaks the Resistance zone($1.0983-$1.0916), we can expect more pumps.
Please respect each other's ideas and express them politely if you agree or disagree.
Euro/U.S. Dollar Analyze (EURUSD), 1-hour time frame.
Be sure to follow the updated ideas.
Do not forget to put a Stop loss for your positions (For every position you want to open).
Please follow your strategy and updates; this is just my Idea, and I will gladly see your ideas in this post.
Please do not forget the ✅' like '✅ button 🙏😊 & Share it with your friends; thanks, and Trade safe.

GOLD ROAD MAP 3000 TO WATERFALL ALERT!🔥 Attention Traders! 🔥
XAUUSD is on fire! 🔥 Here's the latest update:
🔻 Bearish Outlook: Watch out for a potential drop if price falls below 2979. Targets: 2940 & 2960.
🔺 Bullish Outlook: A breakout above 2989 could lead to buying opportunities! Watch for targets: 3000 & 3020.
📈 Stay Tuned: Share your thoughts and strategies as we navigate this golden market! Let's hit new highs! 💰🚀

Eur/Usd (Mar/12) Weekly Analyzehello everyone.
a you can see price touched weekly cloud res ( same as monthly cloud ) so i expect price go down from here.
.......................................
( This is an idea and entry-tp-sl placed for my own trade , you can change entry-tp-sl depends on your risk management )

GBPJPY Buy Analysis: GTEGBPJPY has successfully broken out of the descending trendline, confirming a bullish breakout. This signals a potential continuation to the upside, with price now targeting the next resistance zone around 192.50 - 193.00.
As long as price holds above the breakout level near 191.30, the bullish momentum remains intact. The breakout suggests further upside movement, with buyers stepping in to push price toward the previous highs. Watch for confirmation on lower timeframes to strengthen the move.

US30 (Dow Jones) Buy Analysis: GTEUS30 has successfully pushed through an Inverse Fair Value Gap (IFVG) on the 1-hour timeframe, confirming bullish momentum. Price action suggests a continuation upward, with the next target being the top trendline around 41,950 - 42,000.
With CPI news scheduled for tomorrow morning, we can anticipate further volatility, but until then, US30 is likely to maintain its bullish structure. As long as price holds above the recent support zone around 41,500, the bias remains bullish towards the higher resistance levels.

Gold market analysis GTEBased on the trend lines in the image, gold (XAU/USD) appears to be forming a descending wedge pattern with lower highs, suggesting bearish momentum. The price recently tested resistance around $2,930 but failed to break above, indicating strong selling pressure.
With the lower trendline acting as support, a potential breakdown below $2,910 could accelerate the sell-off towards $2,900 and lower targets around $2,895-$2,880. Additionally, stochastic divergence at the bottom signals weakening bullish momentum.
Given this setup, we are selling gold with a downside bias, watching for further confirmation of bearish continuation.

EURUSD’s Pullback in Play: Next Stop $1.0934?The EURUSD ( FX:EURUSD ) has managed to break through the Resistance zone($1.0817-$1.0760) and has been on a good upward trend with good momentum in the past week.
The EURUSD appears to be completing a pullback to the Resistance zone (broken) .
According to the Elliott Wave theory , the EURUSD appears to have completed wave 4 , which is a Double Three Correction(WXY) .
I expect EURUSD to rise to the Resistance zone($1.0983-$1.0916) after completing the pullbac k.
Note: If EURUSD goes below $1.0755, we can expect more dumps.
Please respect each other's ideas and express them politely if you agree or disagree.
Euro/U.S. Dollar Analyze (EURUSD), 1-hour time frame.
Be sure to follow the updated ideas.
Do not forget to put a Stop loss for your positions (For every position you want to open).
Please follow your strategy and updates; this is just my Idea, and I will gladly see your ideas in this post.
Please do not forget the ✅' like '✅ button 🙏😊 & Share it with your friends; thanks, and Trade safe.

XAU/USD: Gold at a Critical Crossroad: Will $2930 Hold or Break?By analyzing the gold chart on the two-hour timeframe, we can see that the price followed the expected bearish movement yesterday, correcting from its recent high of $2928 down to $2900 before finding temporary support. Currently, gold is trading around $2916, showing signs of indecision as it consolidates within a key range.
🔍 Key Levels & Liquidity Considerations
A significant liquidity pool exists between $2928 and $2930, which could act as a magnet for price. If gold moves toward this range, we might witness liquidity collection before a potential strong rejection and deeper decline.
As long as gold remains below $2930, the bearish outlook remains intact, and further corrections toward $2900 and potentially lower levels could unfold. However, if buyers manage to push the price above $2930 and sustain a breakout with clear confirmation and bullish momentum, we could see gold targeting levels above $2950 in the coming sessions.
📌 Primary & Alternative Scenarios:
🔹 Primary Bearish Scenario: A move into the $2928-$2930 liquidity zone, followed by rejection and continuation of the correction.
🔹 Alternative Bullish Scenario: A clean breakout above $2930 with a strong close and confirmation, leading to further bullish expansion toward $2950+.
🎯 Final Outlook
At this stage, the bearish bias remains dominant, but traders should carefully monitor price action near key liquidity zones before executing positions. Watching how gold reacts around these critical levels will be crucial in determining the next major move.
Stay updated as we track the market closely! 🔥
Please support me with your likes and comments to motivate me to share more analysis with you and share your opinion about the possible trend of this chart with me !
Best Regards , Arman Shaban

EUR/USD Breaks Resistance – Bullish Momentum or Pullback Ahead?what are your ideas on EURUSD?
The EURO/USD pair breaks a resistance level after touching the bottom of the ascending channel,increasing the probability of a new bullish wave.
AS THE RESISTANCE IS BROKEN NOW THE NEXT target will be the top of the channel .
Here we have two points to watch on
A bullish continuation is likely if price holds above the resistance.
A rejection from the 200 EMA could lead to consolidation or a pullback before another attempt higher.
what do you think will EUR/USD sustain the support and be on bullish movement ?

Bullish rise?AUD/CHF has reacted off the resistance level level which is a pullback resistance and could rise from this level to our take profit.
Entry: 0.5616
Why we like it:
There is a pullback resistance level.
Stop loss: 0.5581
Why we like it:
There os a pullback support level.
Take profit: 0.5679
Why we like it:
There is an overlap resistance level that is slightly above the 61.8% Fibonacci retracement.
Enjoying your TradingView experience? Review us!
Please be advised that the information presented on TradingView is provided to Vantage (‘Vantage Global Limited’, ‘we’) by a third-party provider (‘Everest Fortune Group’). Please be reminded that you are solely responsible for the trading decisions on your account. There is a very high degree of risk involved in trading. Any information and/or content is intended entirely for research, educational and informational purposes only and does not constitute investment or consultation advice or investment strategy. The information is not tailored to the investment needs of any specific person and therefore does not involve a consideration of any of the investment objectives, financial situation or needs of any viewer that may receive it. Kindly also note that past performance is not a reliable indicator of future results. Actual results may differ materially from those anticipated in forward-looking or past performance statements. We assume no liability as to the accuracy or completeness of any of the information and/or content provided herein and the Company cannot be held responsible for any omission, mistake nor for any loss or damage including without limitation to any loss of profit which may arise from reliance on any information supplied by Everest Fortune Group.

Xauusd surely fly XAU/USD trades near a fresh weekly high of $2,929.65, with higher highs in sight. The bright metal benefited from the broad US Dollar’s (USD) weakness, the latter affected by tepid United States (US) data and President Donald Trump’s massive tariffs on trade partners.
President Trump addressed Congress late on Tuesday and played down the potential negative effects of his latest round of tariffs. “. There'll be a little disturbance, but we're okay with that. It won't be much,” Trump said, adding that reciprocal tariffs on trading partners will come into effect

Xauusd confirm buy tradeXAU/USD, in the meantime, retains the $2,900 mark but retreated from an intraday peak of $2,927.91. The daily chart shows the pair is up for a second consecutive day, with another leg north still in doubt. XAU/USD is currently battling to overcome a mildly bullish 20 Simple Moving Average (SMA) while the 100 and 200 SMAs recovered their upward slopes far below the current level. Technical indicators, in the meantime, advance with moderated strength and within neutral levels, not enough to confirm a higher

XAU/USD : 1000 Pips Down from ATH, What's Next? (READ CAPTION)By analyzing the gold chart on the one-hour timeframe, we can see that the price, based on the previous analysis, managed to rise by nearly 200 pips but then started to decline from the $2894 zone. Today, we witnessed a price correction down to $2859.
This week, gold has experienced a 3.5% correction from its all-time high, with a decline of over 1000 pips. Currently, gold is trading around $2860.
The attractive SELL zones are $2894, $2900, and $2906.
The attractive BUY zones are $2820, $2833, and $2845.
Please support me with your likes and comments to motivate me to share more analysis with you and share your opinion about the possible trend of this chart with me !
Best Regards , Arman Shaban

XAUUSD buy now 1. Support Adjustment:
The current support area is around 2,900, but if you want more distance, you might consider a lower range, around 2,880–2,895 for a stronger support base.
2. Resistance Adjustment:
The resistance is currently around 2,940. You could extend it further upwards, possibly in the 2,950–2,960 range, to create more distance between support and resistance.
