XAUUSD h4 next move opportunity Support zone around 3,350–3,370 USD.
Price expected to bounce upward from support.
Two bullish target points: ~3,450 and ~3,550.
Clean higher high/lows structure forecasted
Forexsignal

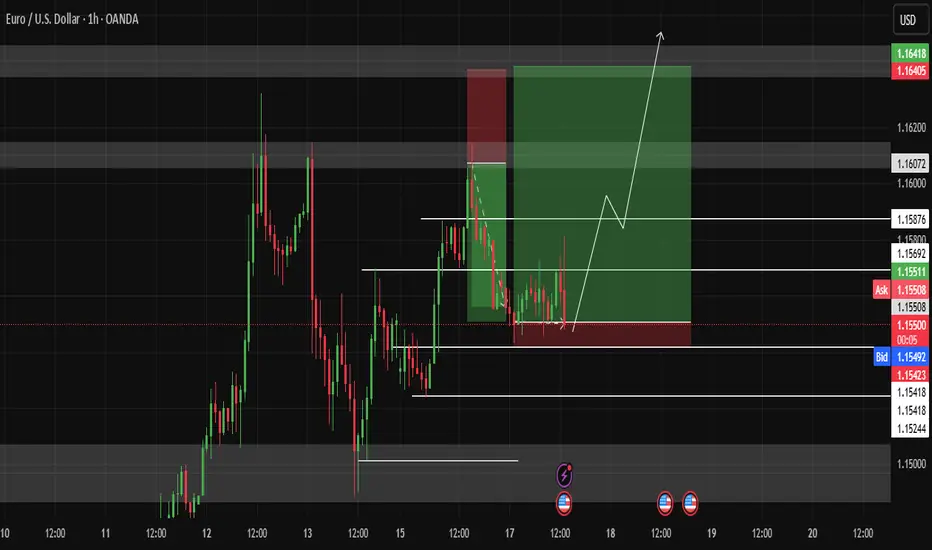
EURUSD Gearing Up for Next Leg Up – DXY Weakens After PPI MissToday, key U.S. economic indexes were released, providing fresh insights into inflationary pressures and the state of the labor market:
Core PPI m/m:
Actual: 0.1% | Forecast: 0.3% | Previous: -0.4%
Lower than expected – suggests weaker underlying producer inflation.
PPI m/m:
Actual: 0.1% | Forecast: 0.2% | Previous: -0.5%
Slight miss – overall inflation at the producer level remains soft.
Unemployment Claims:
Actual: 248K | Forecast: 242K | Previous: 247K
Slightly higher than forecast – signaling some cooling in the labor market.
Market Outlook :
These data releases point toward cooling inflation and softness in job growth, which may strengthen the dovish narrative around the Fed’s next move.
DXY Index ( TVC:DXY ) is under pressure, and EURUSD ( FX:EURUSD ) is showing signs of bullish momentum .
-----------------------------------------------------------
Now let's take a look at the EURUSD chart on the 1-hour time frame .
EURUSD is trading near the Heavy Resistance zone($1.182-$1.160) and Monthly Resistance(2) .
In terms of Elliott Wave theory , EURUSD appears to be completing microwave 4 . Microwave 4 could be completed at one of the Fibonacci levels .
I expect EURUSD to attack the Heavy Resistance zone($1.182-$1.160) at least once more after completing microwave 4 and could even rise to the Potential Reversal Zone(PRZ) .
Note: If EURUSD touches $1.1446 , we can expect more dump.
Please respect each other's ideas and express them politely if you agree or disagree.
Euro/U.S. Dollar Analyze (EURUSD), 1-hour time frame.
Be sure to follow the updated ideas.
Do not forget to put a Stop loss for your positions (For every position you want to open).
Please follow your strategy and updates; this is just my Idea, and I will gladly see your ideas in this post.
Please do not forget the ✅' like '✅ button 🙏😊 & Share it with your friends; thanks, and Trade safe.

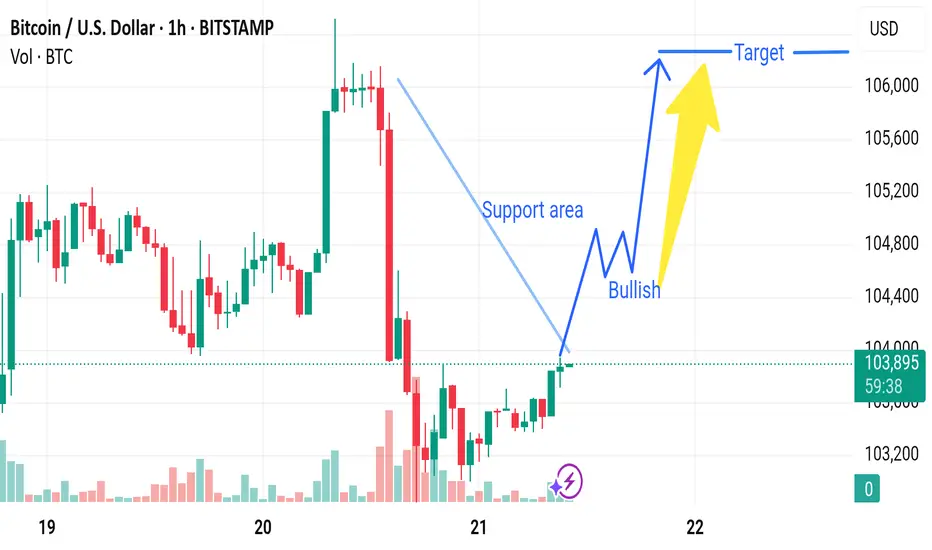
Market next target 🔄 Disruption Analysis:
1. Weak Support Confirmation
The chart marks a "Support area," but there is no strong confirmation (e.g., a hammer or engulfing bullish candle with high volume).
Support zones are more reliable with multiple prior bounces; here, it seems newly identified and not yet validated.
2. Bearish Volume Signature
During the recent decline (before the support), the red volume bars are significantly larger, indicating strong selling pressure.
The recovery candles near support have low volume, which may signal lack of conviction from bulls.
3. Lower Highs Formation
Prior to the drop, we see a series of lower highs, hinting at weakening bullish momentum.
This could suggest a potential bearish continuation, especially if price fails to break above the last local high (~106,000).
4. Possible Bearish Retest
Instead of a bullish breakout, the current price might just be retesting the broken support-turned-resistance.
This is a common bull trap scenario where prices bounce slightly before resuming downward.
Market next move Disruption to Bullish Scenario:
1. Resistance Zone Around 1.1540 – 1.1550
The price is approaching a psychological and potential resistance level around 1.1540–1.1550.
If the bulls fail to break this zone convincingly, a rejection could lead to a pullback or reversal.
2. Bearish Divergence in Volume
Despite upward movement in price, the volume doesn't show a strong bullish breakout. If momentum weakens while price rises, it might indicate a bearish divergence.
3. Rising Wedge Formation
The current price channel resembles a rising wedge, which is typically a bearish pattern.
A breakdown from this pattern (below the “support area” trendline) could trigger a sell-off toward 1.1500 or lower.
4. Economic Data or News Risk
Any sudden USD strength due to economic reports, Federal Reserve commentary, or geopolitical tension could flip the sentiment instantly.
Icons below the chart hint at upcoming news from the Eurozone or U.S., which could lead to volatility.
5. Overbought Condition
If technical indicators like RSI or MACD (not shown in this chart) are in overbought territory, a correction or profit-taking may happen soon.

Market next move 🔄 Disruption: Bullish Setup Building?
🧠 Problems With Bearish Interpretation:
1. Volume Surge Might Be Re-Accumulation:
Volume at the purple lightning symbol is rising — this could signal buyer interest, not distribution.
Green candles in this zone suggest aggressive buying on dips.
2. Failed Breakdown Earlier:
Price had a strong drop but bounced sharply, recovering nearly all losses.
That type of V-recovery often traps early shorts, leading to a rally.
3. Resistance Retest Might Be Breakout Setup:
The red box marks resistance, but price is consolidating just below it.
That’s typically bullish if no strong rejection occurs — classic “base before breakout.”
4. No Lower Low Yet:
Market structure still holding.
Until price breaks below ~$35.80, the bearish thesis remains speculative.
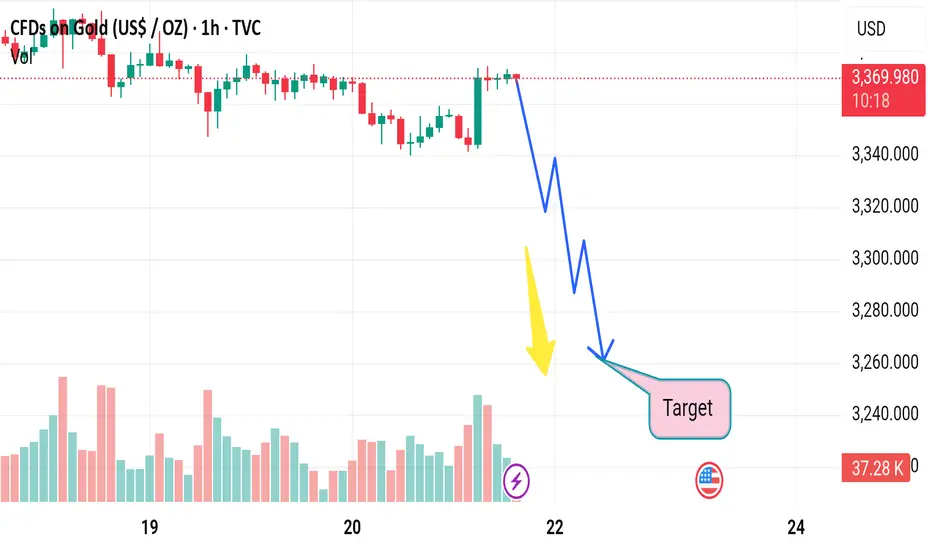
Market next target 📉 Original View (Bearish Outlook):
Predicts a downward move from around $3,370 to the target near $3,250.
Sharp drop illustrated with zigzag downward arrows.
Yellow arrow highlights growing volume — likely interpreted as early selling pressure.
---
🔄 Disruption: Bullish Reversal or Trap Setup
🧠 Problems With Bearish Thesis:
1. Volume Spike Might Indicate Demand:
The yellow arrow highlights a volume surge, but this might be buyer absorption, not selling dominance.
If this volume came during a wick-heavy candle or hammer, it suggests buying interest at lows.
2. No Break of Major Support Yet:
Price is still above $3,350, a key psychological and technical zone.
No clear breakdown has occurred — the downtrend is assumed, not confirmed.
3. Oversold Momentum?
Momentum indicators (not shown) may reveal oversold conditions, making a short-term rebound more probable.
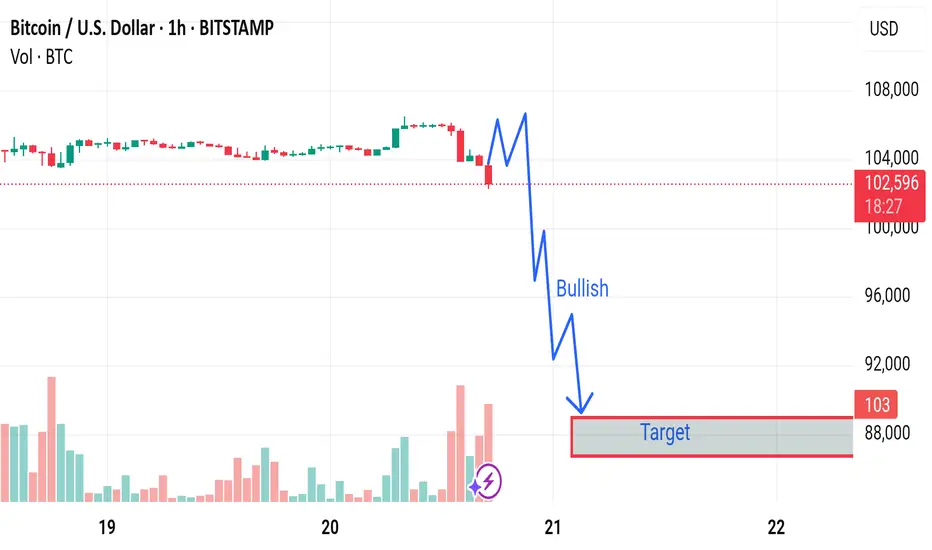
Market next move 🔄 Disrupted Analysis: Bullish Counter-Scenario
🧠 Original Bias:
The chart predicts a strong bearish move, with a target around 88,000 USD.
The label "Bullish" seems misleading as it’s placed in a steep downward move.
---
📉 Issues With the Original Analysis:
1. Volume Misinterpretation:
Increasing red volume could indicate capitulation or a temporary panic sell-off, not necessarily the start of a new trend.
A bounce could follow if buyers step in.
2. Support Zone Ignored:
The analysis overlooks any previous support levels in the 100k–98k range, where buyers may be waiting.
3. No Confirmation for Breakdown:
The chart does not show a completed breakdown of a key structure or trendline.
The blue squiggle assumes a breakdown will happen, but no technical confirmation is visible.
---
📈 Disruption Scenario: Bullish Reversal Possible
Rejection from 102k zone could be a liquidity grab, not the start of a downtrend.
Hidden bullish divergence on RSI or MACD (not shown here) could support a bounce.

Market next forecast 🔄 Disrupted Analysis: Bullish Counter-Scenario
🧠 Original Bias:
The chart predicts a strong bearish move, with a target around 88,000 USD.
The label "Bullish" seems misleading as it’s placed in a steep downward move.
---
📉 Issues With the Original Analysis:
1. Volume Misinterpretation:
Increasing red volume could indicate capitulation or a temporary panic sell-off, not necessarily the start of a new trend.
A bounce could follow if buyers step in.
2. Support Zone Ignored:
The analysis overlooks any previous support levels in the 100k–98k range, where buyers may be waiting.
3. No Confirmation for Breakdown:
The chart does not show a completed breakdown of a key structure or trendline.
The blue squiggle assumes a breakdown will happen, but no technical confirmation is visible.
---
📈 Disruption Scenario: Bullish Reversal Possible
Rejection from 102k zone could be a liquidity grab, not the start of a downtrend.
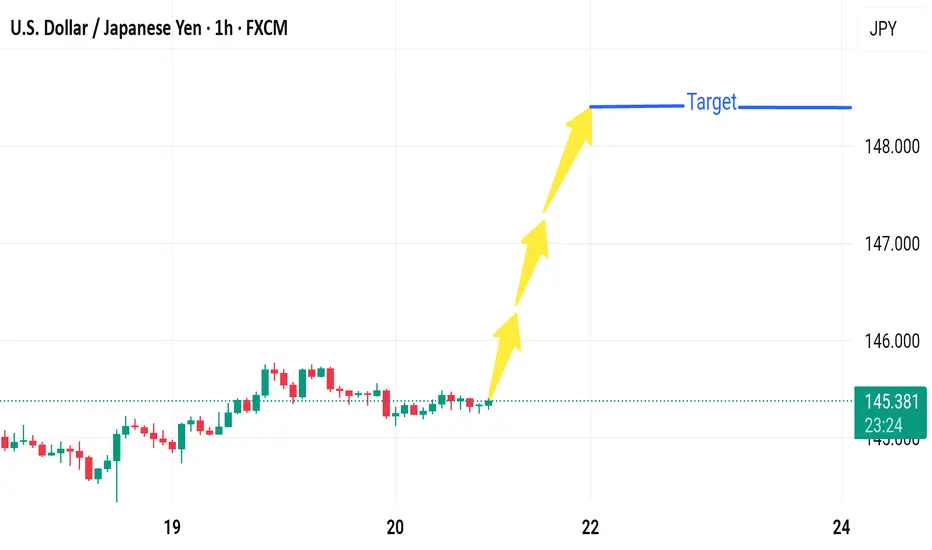
Market next move 🔻 Disruptive Analysis – Bearish Scenario
1. Resistance Rejection:
Price has stalled around 145.40, showing hesitation.
The target area (~148.000) hasn't been tested yet, and prior attempts to break higher may face heavy resistance from institutional sell orders or prior supply zones.
2. Range-Bound Structure:
Current price action shows consolidation — multiple small-bodied candles.
Lack of volume or momentum may indicate accumulation or distribution — not necessarily a bullish breakout setup.
3. Potential Bearish Triggers:
If price breaks below 145.00, a short-term bearish move could occur toward:
144.30 – recent swing low support.
143.80 – demand zone based on prior accumulation.
4. Macro Disruptors:
Surprise BoJ intervention or hawkish policy tone could strengthen the Yen.
A dovish Fed statement or poor U.S. economic data could drag USD down sharply.
---
📉 Alternate Scenario Chart Sketch (Hypothetical):
148.000 ──────── (Target denied - strong resistance)
↑
Rejection
↓
145.000 ──────── (Breaks support)
↓
144.300 ──────── (First bearish target)
↓
143.800 ──────── (Deeper retracement zone)
Market next target
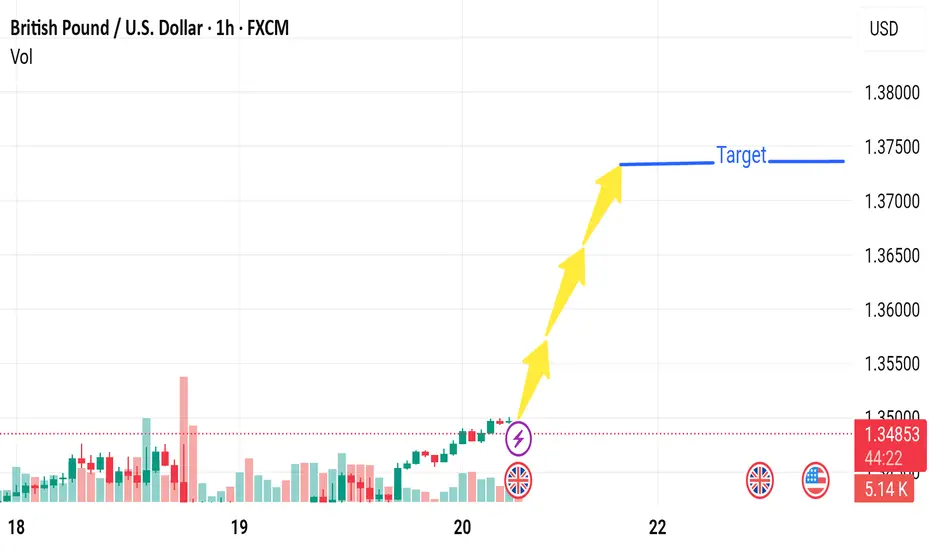
🔻 Bearish Disruption Analysis
1. Overbought Conditions / RSI Exhaustion
The recent bullish momentum appears strong, but it could be entering overbought territory, especially on the 1-hour chart.
A correction may follow if technical indicators like RSI or MACD start diverging.
2. Resistance Zone at 1.35000 - 1.35500
The price is nearing a historical resistance area around 1.3500–1.3550, where sellers have previously stepped in.
Without strong volume or a news catalyst, this zone may reject further upside movement.
3. Low Volume Breakout
The breakout visible before the arrows is accompanied by relatively moderate volume, which can indicate a false breakout or bull trap.
4. Fundamental Uncertainty
Upcoming U.S. or UK economic data (indicated by the flags on the chart) could disrupt the expected bullish move.
Example: A strong USD labor report or hawkish Fed comment could reverse the GBP/USD rally.
Market next move 🟥 Disrupted Analysis: Bearish Divergence on EUR/USD (1H)
Weak Support Zone:
The price labeled as "Support" was never a well-tested zone. It appears to be a minor structure, and the bounce lacks strong confirmation or significant volume.
Volume Decline During Rise:
The recent upward candles show shrinking volume, a sign that the buying momentum is weakening, not strengthening. Bulls are losing energy.
Potential Double Top Formation:
If price action near current levels stalls, a double top could form, which is a classic bearish reversal pattern. Watch for rejection below 1.1550.
Bearish Target Zone (if reversal begins):
First target: 1.1450 (minor support)
Break below that opens 1.1370 zone (volume support area)
---
📉 Disrupted Price Path (Opposing the Yellow Arrow)
Rejection
↓
┌─────────┐
│ ▼
│ Pullback to "Support"
▼ │
Breakdown │
▼ │
Target Zone ▼

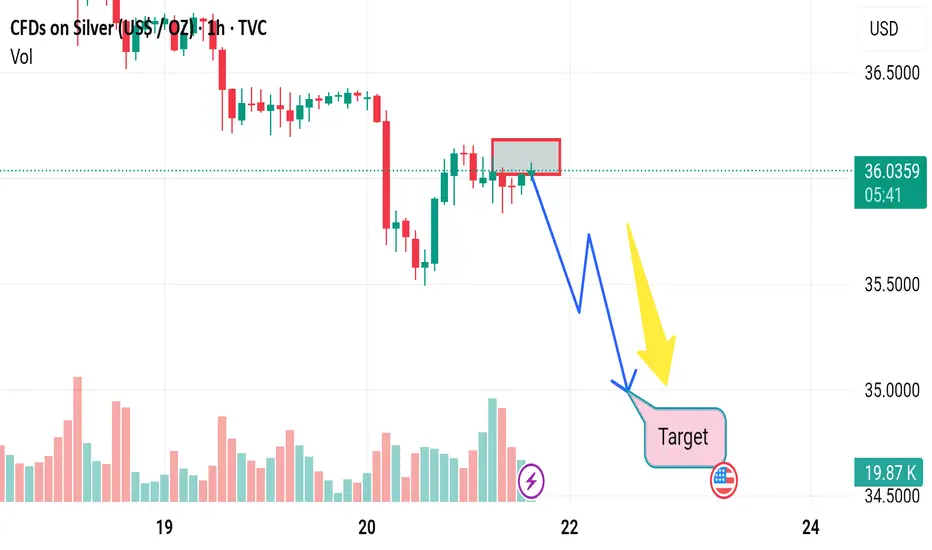
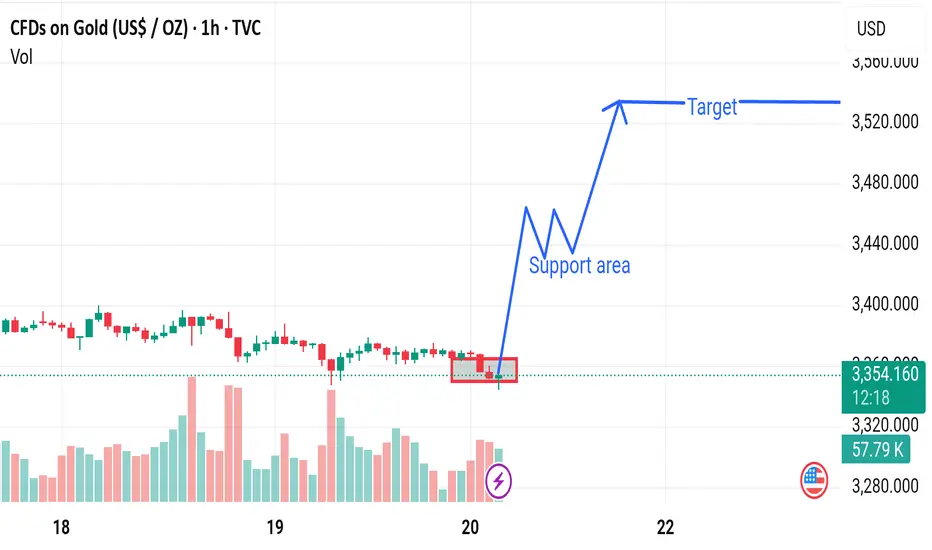
Market next target Disrupted Analysis: Bearish Outlook on Gold CFDs (1H Chart)
Support Breakdown Imminent:
The price is repeatedly testing the support area marked in red. Instead of holding strong, this indicates weak buyer interest. Volume is not spiking in support, showing no accumulation behavior.
Volume Divergence:
Despite prices consolidating near support, volume is decreasing, suggesting lack of conviction from bulls. This often precedes bearish breakdowns.
Bearish Targets:
If the current level at 3,352.990 breaks down decisively:
Immediate target: 3,320.000
Extended bearish move: 3,280.000 (prior demand zone)
Price Action Signals:
Lower highs forming consistently.
No bullish engulfing or reversal candles in sight.
Stronger bearish momentum candles (long red bodies with volume).
---
📉 Suggested Disruption Chart Path (Instead of Bullish Arrow):
Support Area
↓
┌───────┐
│ │
▼ │
Breakdown │
▼ │
Retest Fail │
▼ │
Bearish Slide▼
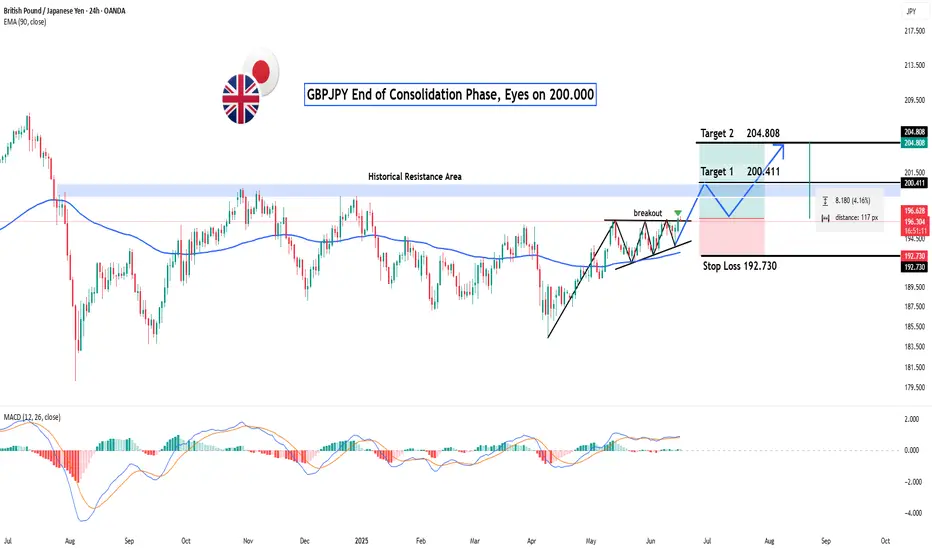
GBPJPY: End of Consolidation Phase, Eyes on 200.000?Hey Realistic Traders!
Could this be the beginning of a major bullish wave ?
Let’s Break It Down..
On the daily timeframe, GBPJPY has formed a Symmetrical Triangle Pattern, followed by a bullish breakout, a classic technical signal that typically marks the end of a consolidation phase and the start of a new bullish trend. This move is further confirmed by the appearance of a strong bullish candlestick, reflecting a surge in buying momentum.
Supporting this bullish scenario, the MACD indicator has also formed a bullish crossover, where the MACD line crosses above the signal line. This crossover is widely regarded as a momentum shift from bearish to bullish, strengthening the case for continued upward movement.
Given these technical signals, the price is likely to advance toward the first target at 200.411, with a potential extension to 204.808.
This bullish outlook remains valid as long as the price holds above the key stop-loss level at 192.730.
Support the channel by engaging with the content, using the rocket button, and sharing your opinions in the comments below.
Disclaimer: "Please note that this analysis is solely for educational purposes and should not be considered a recommendation to take a long or short position on OANDA:GBPJPY ".
market next move 🔻 Bearish Disruption Perspective:
1. Breakdown of the Support Zone
The highlighted red box is acting as support.
However, multiple retests of this zone indicate weakening support.
If price breaks below ~$35.50 decisively, it could trigger a bearish continuation.
2. Low Volume on Recent Candles
Volume appears to be declining during the latest consolidation phase.
A bullish breakout ideally requires increasing volume, which is not evident here.
This could indicate lack of buyer interest at this level.
3. Downtrend Momentum
The price is in a clear short-term downtrend (series of lower highs and lower lows).
Without a strong reversal signal (like a hammer, bullish engulfing), expecting a breakout may be premature.
4. Fundamental Risk Factors
Silver often reacts strongly to:
Interest rate decisions
USD strength
Inflation data

buy in GOLD ??After gold reached a strong support area and was successfully confirmed, I think it is good to take a buy trade.

XAUUSD - 4H Breakout and Retest Setup🟡🟡🟡
🕒 June 17, 2025
Bias: Medium-Term Bullish
Structure: Breakout → Retest → Continuation
Context: Trendline break + confluence with EMA + prior resistance turned support
🔍 Market Structure Insight:
Major descending trendline broken with strong impulsive momentum.
Pullback held at the intersection of:
Broken trendline retest
EMA 60 dynamic support
Bullish structure of HL-HH (Higher Low / Higher High)
Strong bullish candle at support
✅ Trade Plan – Buy Stop Setup
Entry (Buy Stop): 3402
SL: 3373 (below the pullback structure + EMAs)
TP1: 3430 (local resistance area)
TP2: 3470 (measured move from previous leg height)
#XAUUSD #Gold #TechnicalAnalysis #BreakoutSetup #Forex #EMA #SqueezePlay #TrianglePattern #tradingview #MJTrading

BTC market update 19 6 ,2025The chart you've shared is a 1-hour BTC/USD (Bitcoin to USD) chart from Bitstamp, and it illustrates several technical patterns and a possible bearish setup:
Key Observations:
1. Rising Wedge Pattern (Bearish):
From June 13–17, a rising wedge pattern formed (higher highs, higher lows, converging trendlines).
This pattern broke down sharply around June 17, which typically signals bearish momentum.
2. Bear Flag/Range Consolidation:
After the drop, BTC entered a sideways consolidation (highlighted in a red box), forming a rectangular range between ~104,950 resistance and ~102,830 support.
This could be interpreted as a bear flag or a distribution phase, suggesting continuation of the prior downtrend.
3. Bearish Projection:
The blue zig-zag line with the downward arrow suggests the analyst expects a break below the 102,830 support.
If this happens, further downside is likely. The measured move target could be projected from the height of the range (~2,100 points) below the breakdown point.
Summary:
Short-Term Bias: Bearish
Key Support: 102,830
Key Resistance: 104,950
Next Move: Breakdown below 102,830 could lead to a drop toward ~100,700 or lower, if the bear flag confirms.
Would you like a trading idea or stop-loss/take-profit suggestions based on this pattern?


CHF/JPY Approaching the Danger Zone🧠 CHF/JPY Daily Chart
🗓️ June 18, 2025
Theme: "Approaching the Danger Zone – Will It Break or Bounce?"
Bias: Cautiously Bearish (near resistance)
Setup: Rising wedge into multi-year resistance zone
🔍 Market Structure Analysis:
The CHF/JPY has been riding a clean bullish wave since early 2025, but the pair now faces its most critical battle zone — the 179.50–180.00 multi-year resistance block, which previously marked a sharp reversal point.
The recent price action shows a rising wedge structure, which is often a bearish reversal pattern, especially when appearing near significant resistance.
🧬 Confluences in Play:
✅ Rising Wedge: Tightening structure indicates exhaustion of bullish momentum.
✅ Major Supply Zone: Price is approaching a high-likelihood reaction zone (180.00), where sellers aggressively took over in the past.
✅ Bearish Divergence Watch: (Not shown but likely developing on RSI or MACD)
✅ EMA Clustering: 15 & 60 EMAs rising, suggesting short-term momentum, but also acting as dynamic support if price breaks lower.
🔁 Scenario-Based Trade Plan:
🟥 Bearish Rejection Setup:
Entry: If price prints a strong bearish engulfing or pin bar near 179.50–180.00
SL: Above 180.20 (liquidity sweep buffer)
TP1: 174.50 (wedge base)
TP2: 172.00 (previous structure support)
TP3: 165.00 (macro demand zone)
R:R Potential: 3–5+
🟩 Breakout Continuation (Contingency Plan):
Buy Stop above 180.50 on strong close + retest
Targeting 184.00+ (measured move from wedge height)
🎯 Key Levels:
Major Resistance: 179.50–180.00
Trendline Support: 174.00
High-Volume Node: 172.00
Major Demand: 165.00–166.00 (long-term)
⚠️ Risks & Considerations:
JPY volatility due to BoJ surprises
CHF is sensitive to risk sentiment → geopolitical/macro shifts can rapidly flip bias
Wedge can fakeout before true move — confirm with volume + daily close
🧵 Summary Thought:
"Price is climbing a narrowing staircase into a wall. Will it punch through or trip on fatigue? Either way — the move from here is likely to be decisive. This is not the time to blink."
Share your Idea please...
#CHFJPY #MJTrading #Chart #Analysis #CHF #JPY

Try a RR1 🔻 Sell Setup 1
Entry: 1.15600
SL: 1.16160
TP: 1.15050
R:R ≈ 1
Rejected from 1.160; Signal bar key bar detected.
Please manage your risk.

Opportunity for selling EURUSDI see that EURUSD has confirmed strong resistance, so I took a sell trade with it.

buying EURUSD (update) 1:10 RREURUSD touched strong support, so I think it will rise further, as shown.
Opportunity for buying and selling EURUSDI see that EURUSD has confirmed strong support and resistance, so I took a sell and buy trade with it.
