USD/CHF Swissie Heist Plan: Rob the Trend, Ride the Bull!🔐💰 USD/CHF Swissie Forex Heist 💰🔐
“Rob the Trend, Escape the Trap – Thief Style Day/Swing Master Plan”
🌎 Hola! Hello! Ola! Marhaba! Bonjour! Hallo!
Dear Market Looters, Swing Snipers & Scalping Shadows, 🕶️💼💸
Welcome to another elite Thief Trading Operation, targeting the USD/CHF "SWISSIE" vault with precision. Based on sharp technical blueprints & macroeconomic footprints, we're not just trading – we're executing a Forex Bank Heist.
This robbery mission is based on our day/swing Thief strategy – perfect for those who plan, act smart, and love stacking pips like bricks of cash. 💵🧱
💹 Mission Brief (Trade Setup):
🎯 Entry Point – Open the Vault:
Swipe the Bullish Loot!
Price is prepped for an upside raid – jump in at any live price OR set smart Buy Limit orders near the 15m/30m recent pullback zones (last swing low/high).
Use DCA / Layering for better entries, thief-style.
🧠 Thief Logic: Let the market come to you. Pullbacks are entry doors – robbers don’t rush into traps.
🛑 Stop Loss – Exit Strategy If Caught:
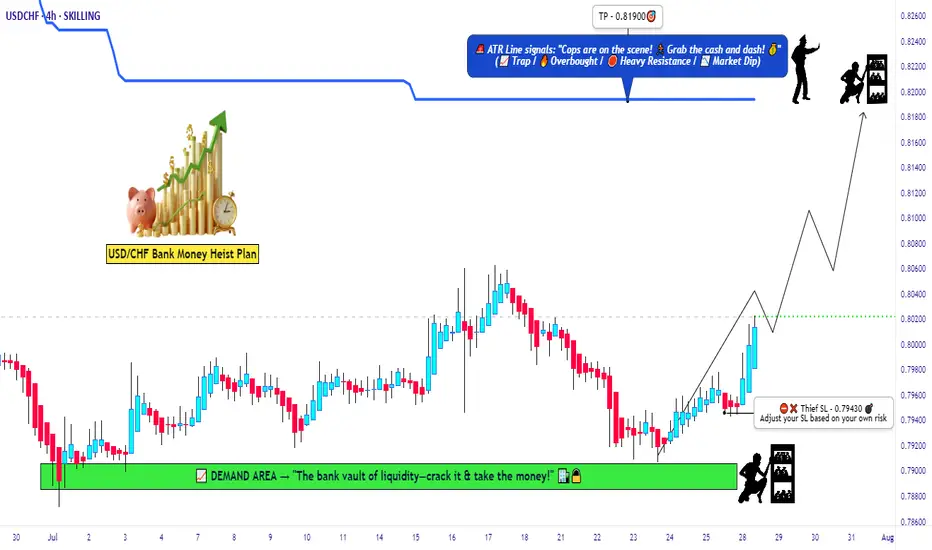
📍 Primary SL: Below recent swing low on the 4H chart (around 0.79430)
📍 Adjust based on lot size, risk, and number of stacked entries.
This SL isn’t your leash – it’s your getaway route in case the plan backfires.
🏴☠️ Profit Target – Escape Before the Cops Arrive:
🎯 Target Zone: 0.81900
(Or dip out earlier if the vault cracks fast – Robbers exit before alarms trigger!)
📌 Trailing SL recommended as we climb up the electric red zone.
🔥 Swissie Heist Conditions:
📈 USD/CHF showing upward bias based on:
Momentum shift
Reversal zone bounce
Strong USD sentiment & macro factors
✅ COT positioning
✅ Intermarket correlations
✅ Sentiment & Quant data
➡️ Do your fundamental recon 🔎
⚔️ Scalpers – Here's Your Mini-Mission:
Only play LONGS. No counter-robbing.
💸 Big bags? Enter with aggression.
💼 Small stack? Follow the swing crew.
💾 Always trail your SL – protect the stash.
🚨 News Alert – Avoid Laser Alarms:
🗓️ During high-volatility releases:
⚠️ No new trades
⚠️ Use trailing SLs
⚠️ Watch for spikes & fakeouts – the vault traps amateurs
💣 Community Boost Request:
If this plan helps you loot the market:
💥 Smash that Boost Button 💥
Let’s strengthen the Thief Army 💼
The more we grow, the faster we move, and the deeper we steal. Every like = one more bulletproof trade.
#TradeLikeAThief 🏆🚨💰
📌 Legal Escape Note:
This chart is a strategic overview, not personalized advice.
Always use your judgment, manage risk, and review updated data before executing trades.
📌 Market is dynamic – so keep your eyes sharp, your plan tighter, and your strategy ruthless.
🕶️ Stay dangerous. Stay profitable.
See you soon for the next Forex Vault Hit.
Until then – Lock. Load. Loot.
Forexsignals
EUR/USD Analysis – Hunting a Buy Opportunity from a Key Zone💹 EUR/USD Analysis – Hunting a Buy Opportunity from a Key Zone 🇪🇺💵
After a correction and drop from the recent high, the Euro is approaching a major support area and the Buy Zone.
My scenario: If price reaches this area and confirms with price action, I expect a strong rebound towards higher targets.
📌 Key points:
Short-term bearish structure, but correction nearing completion
Support zone overlapping with Fibonacci confluence
Potential target above the previous high
⚠️ This is a personal view, not financial advice. Always apply risk management.
❓ What do you think? Could this correction be the start of a bullish rally, or will the drop continue?
------------------------------------------------------------------------------------------------------
🚀 Who am I?
I'm Mahdi, a prop firm trader with 7+ years of experience in technical analysis, mainly focusing on Smart Money Concepts and Elliott Wave theory.
I specialize in delivering high-quality trading signals, market insights, and educational content tailored for serious traders and investors.
📊 My Tools: SMC, Elliott Wave, Fibonacci, Liquidity Grabs, Order Blocks
💼 Prop Challenge Passed: Yes | Funded Account: In Progress
🔗 Follow for consistent updates and trading insights.

AUDCAD: Pullback From Resistance 🇦🇺🇨🇦
AUDCAD may retrace from the underlined blue resistance.
A breakout of a support line of a rising wedge pattern
after its test leaves a strong bearish clue.
We can expect a pullback to 0.8962 level.
❤️Please, support my work with like, thank you!❤️
I am part of Trade Nation's Influencer program and receive a monthly fee for using their TradingView charts in my analysis.

XAUUSD swing readyH1-H4 TIMEFRAME SETUP
Currently XAUUSD is following the implusive down Trend as we mentioned once 3370 breaks 3345 is on mark I expecting market will renounce from 3335-3342 zone.
What possible scenarios we have ?
• Market has to gives closing of H4 above 3335-3340 for the implusive bounce for HH on D1 & H4 candles ,also I'm ready for buying at & my Targets are 3358 then 3370
• secondly If gold breaks to 3332-3330 and candle closes below then our buying will be invalid and market will retest 3310
#XAUUSD

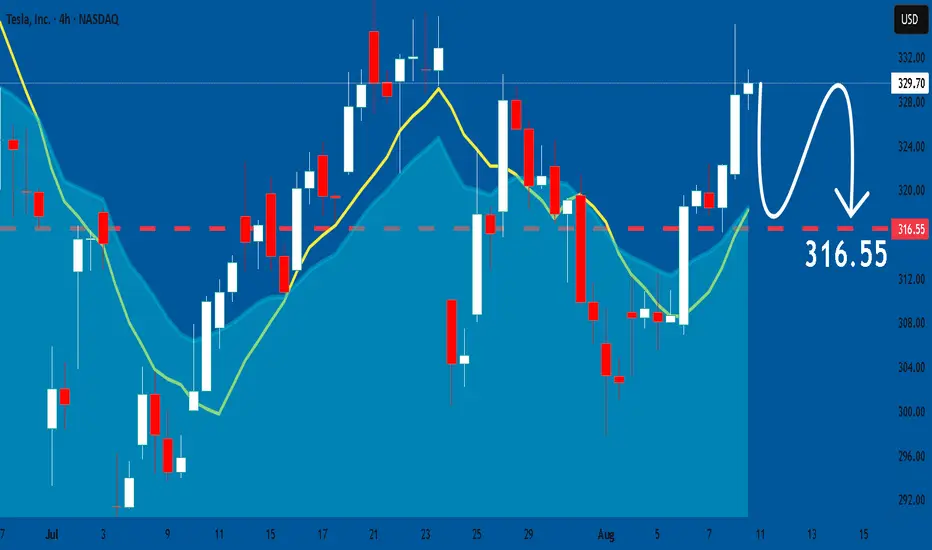
TESLA: Expecting Bearish Movement! Here is Why:
Balance of buyers and sellers on the TESLA pair, that is best felt when all the timeframes are analyzed properly is shifting in favor of the sellers, therefore is it only natural that we go short on the pair.
Disclosure: I am part of Trade Nation's Influencer program and receive a monthly fee for using their TradingView charts in my analysis.
❤️ Please, support our work with like & comment! ❤️
XAUUSD Weekly Plan a Liquidity Clean-Up?XAUUSD Weekly Plan – The Final Bullish Push Before a Liquidity Clean-Up?
Are you ready for a high-volatility week?
Last week, Gold continued to move steadily inside its bullish channel, reaching the FVG High Zone and pushing towards the strong resistance cluster at 3426–3428 (OBS Sell Zone).
The bullish structure on H2–H4 remains intact, but as price enters the distribution zone, candles are tightening, and volume is fading — a clear sign that buying pressure is weakening.
Macro Backdrop – What’s on the Calendar?
This week is packed with high-impact USD data:
CPI (Aug 12) – Major inflation reading, key driver for USD & Gold.
PPI (Aug 14) – Producer inflation, often a leading indicator for CPI trends.
Unemployment Claims (Aug 14) – Short-term labour market indicator.
💡 Expectations:
CPI & PPI are forecast to improve compared to last month.
If confirmed, this could trigger a sharp Gold pullback as USD strengthens.
However, a weak CPI/PPI could give Gold one last bullish spike before reversal.
Technical Outlook
The H2 bullish channel is well-defined.
The top of the channel aligns with the FVG High Zone — a key area for big player sell limits and profit-taking.
Likely scenario:
Price extends to test 3426–3428 Sell Zone.
Bearish reaction → Channel breakdown.
Retest VPOC 3395–3400 → Drop towards liquidity pools below.
Key Trading Levels
SELL Zone: 3426 – 3428
SL: 3434
TP: 3420 → 3415 → 3410 → 3405 → 3400 → 3395 → 3390 → 3380 → 3370 → 3360
BUY Zone: 3330 – 3328
SL: 3322
TP: 3335 → 3340 → 3350 → 3360 → 3370 → 3380
Risk Management Notes
⚠️ This is a high-risk news week — false breaks are highly possible before & after CPI/PPI.
Avoid holding heavy positions during key data releases.
If price breaks above 3434 with strong volume, bearish scenarios are invalid → wait for a new structure.
📌 Summary:
Primary bias → Sell from 3426–3428, target downside liquidity pools.
Secondary play → Buy from 3330–3328 if liquidity sweep occurs.
Stay disciplined. Manage risk. Don’t get caught in the volatility trap.
— MMFlow Trading

NZDUSD: More Growth Ahead Next Week 🇳🇿🇺🇸
NZDUSD may continue rising next week after a confirmed bullish
trap that occurred following a text of a key daily horizontal support.
A local consequent Change of Character CHoCH indicates
a strength of the buyers and a highly probable growth.
Next resistance - 0.6
❤️Please, support my work with like, thank you!❤️
I am part of Trade Nation's Influencer program and receive a monthly fee for using their TradingView charts in my analysis.

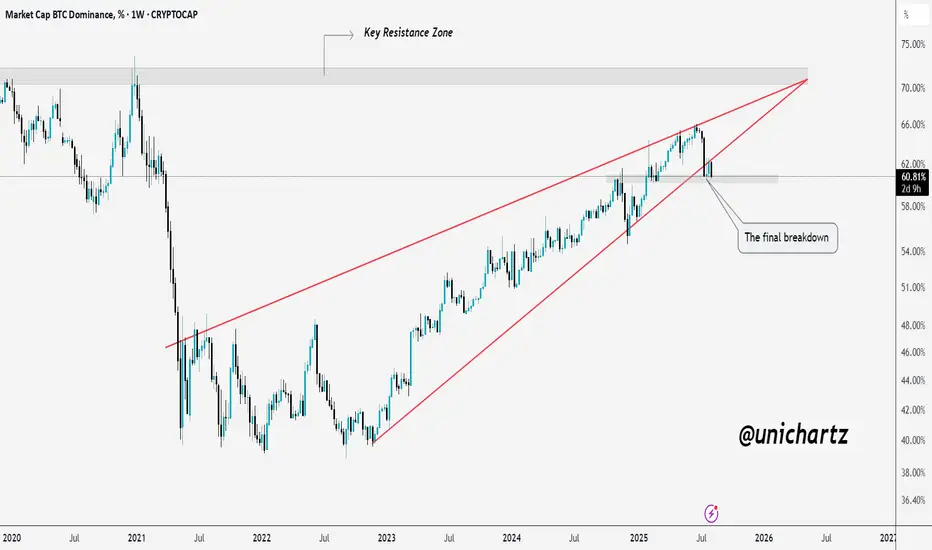
Altcoin Bulls Watching This Retest CloselyBTC Dominance has cleanly retested the breakdown from its rising wedge pattern after failing to break the key resistance zone.
This retest is a critical point if sellers maintain control here, dominance could trend lower toward the next support range, potentially sparking an altcoin relief rally.
However, a reclaim above this breakdown zone would invalidate the bearish setup and shift momentum back in Bitcoin’s favor.
DYOR, NFA
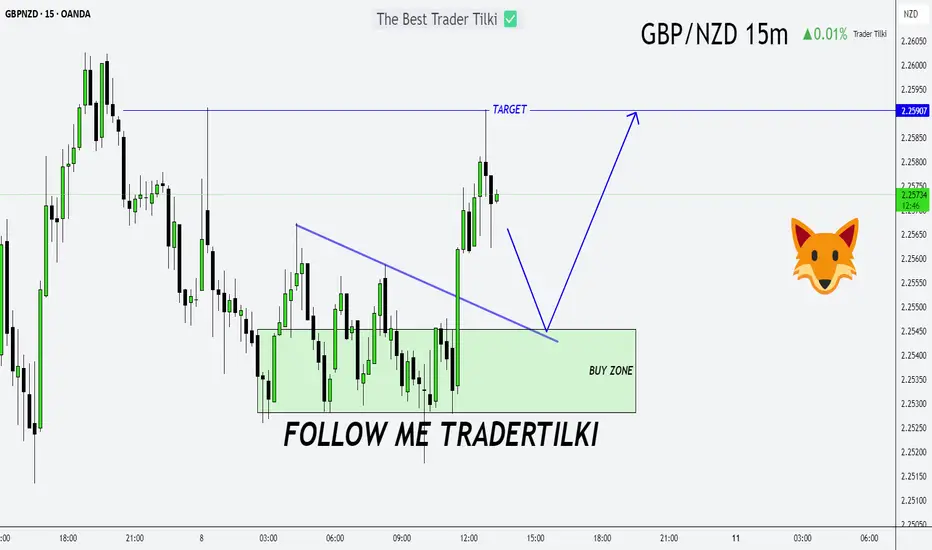
Forecast in, Profits Out: GBPNZD Entry & Target RevealedHello my dear friends,
I’ve prepared an analysis for the GBPNZD pair. I share these insights to help you earn money from the markets.
First and foremost, let’s remember this: as traders, we only forecast market structure. We prepare our analysis and trade based on predictions. But in the end, whatever the whales want—*that’s* what happens. Never forget that.
From time to time, we may be wrong in our analysis, and that’s perfectly okay. What truly matters is that our losses never exceed our gains.
Now, let’s get to the point:
I plan to open a buy position on GBPNZD around the 2.25455 or 2.25282 levels. After entering the trade, my target will be 2.25907.
Every single like you send is my biggest source of motivation to keep sharing these analyses. Thank you so much to everyone who supports me with a like!
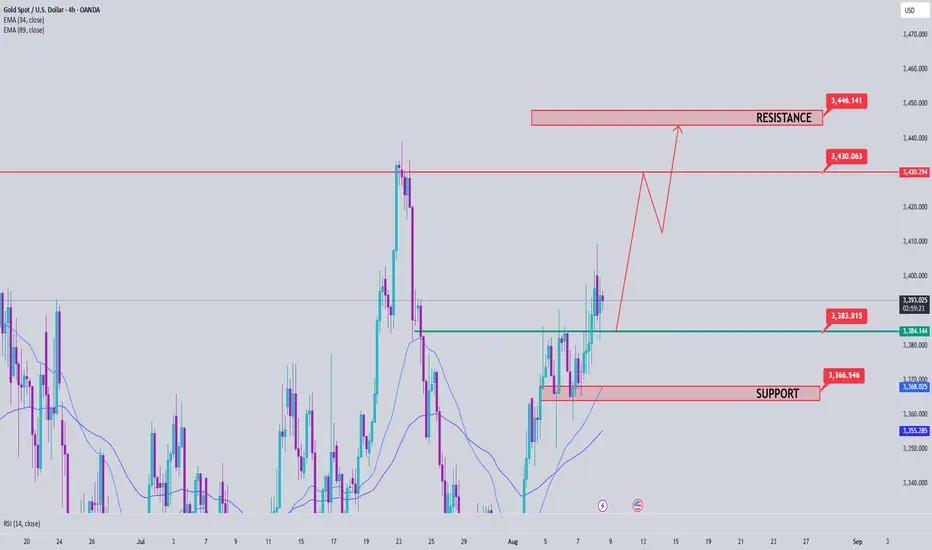
Gold Trading Strategy August 8XAUUSD – Bullish Breakout from Triangle Pattern
Gold has officially broken the upper boundary of the triangle accumulation pattern, confirming the continuation of the uptrend. This bullish momentum is heading directly towards the 3430 area, and if the buying pressure is maintained, the 3445 level is completely within reach.
Today is Friday, the closing day of the weekly candle, so the oscillation amplitude is usually stronger and the price can easily approach new peaks. Observation shows that the buying pressure in the US session has been maintained continuously in recent days - this supports the strategy of BUYing now and holding until the US market opens.
Support zone: 3385 – 3365 – 3333
Resistance zone: 3419 – 3431 – 3445
EURUSDHello Traders! 👋
What are your thoughts on EURUSD?
EUR/USD is trading below a key resistance area and has recently completed a pullback to the broken trendline.
As long as the pair remains under this resistance, we expect some short-term consolidation, followed by a renewed bearish move toward lower levels.
The bearish outlook remains valid while price stays below the resistance zone.
A clean break above this level would invalidate the bearish scenario.
Will EUR/USD resume its decline, or break through resistance? Share your view below! 👇
Don’t forget to like and share your thoughts in the comments! ❤️

Gold price forecastGold prices continued to rise as weaker-than-expected labor market data showed that the number of Americans filing new claims for unemployment benefits was higher than economists had expected.
The U.S. Labor Department said on Thursday that initial jobless claims rose to a seasonally adjusted 226,000 for the week ended Aug. 2. That was higher than forecasts, with analysts expecting 220,000. The previous week's figure was also revised up to 219,000.
Meanwhile, the four-week average of new claims, a more reliable measure of the labor market because it strips out weekly fluctuations, came in at 220,750, below the forecast of 222,000 and compared with the previous week's adjusted average of 221,250.
Continuing jobless claims - which reflect the number of people receiving benefits - came in at 1.974 million for the week ended July 26, above forecasts of 1.947 million and the previous week's revised 1.936 million.
Weaker-than-expected US labor market developments are adding to gold's upside as investors bet the Federal Reserve will soon shift to a dovish stance to support growth.

Fed cuts interest rates or political tensions riseExperts from financial institutions such as Tierra, Goldman Sachs, and UBS predict that the world gold price in August will fluctuate around the threshold of 3,420 - 3,520 USD/ounce, and may exceed 3,600 USD/ounce if the FED cuts interest rates or political tensions increase.
Ms. Soni Kumari - commodity strategist at ANZ, commented: "Uncertainty is back in the spotlight, especially after new developments related to tariffs, which is reviving safe-haven demand. In addition, macro market sentiment also supports gold, especially when the USD weakens and expectations of the FED cutting interest rates increase."

XAUUSD GOLD BUYS Gold hit all take profits and now will be taking more trades into the correct direction for the rest of the trend , keep the trading simple and straightforward

GBPAUD Reverses from Key Zone – Long Setup in Play!Today I want to share with you a Long position on GBPAUD ( OANDA:GBPAUD ).
GBPAUD started to rise well from the Important Support line , Support zone(2.032 AUD-1.987 AUD) , and Potential Reversal Zone(PRZ) and managed to close the 4-hour candle above 2.053 AUD (important) .
In terms of Elliott wave theory , GBPAUD seems to have completed the main wave 4 . The main wave 4 structure was a Double Three Correction(WXY) .
Also, along the way, we can see a Bullish Marubozu candle , which could indicate a continuation of the uptrend .
I expect GBPAUD to break the Resistance lines soon and attack the Resistance zone(2.078 AUD-2.066 AUD) .
First Target: 2.065 AUD
Second Target: 2.076 AUD
Note: Stop Loss(SL): 2.040 =Worst SL
Please respect each other's ideas and express them politely if you agree or disagree.
British Pound/ Australian Dollar Analyze (GBPAUD), 4-hour time frame.
Be sure to follow the updated ideas.
Do not forget to put a Stop loss for your positions (For every position you want to open).
Please follow your strategy and updates; this is just my Idea, and I will gladly see your ideas in this post.
Please do not forget the ✅' like '✅ button 🙏😊 & Share it with your friends; thanks, and Trade safe.

BITCOIN BTCUSD PROFITBitcoin has been respecting its trend and has shown that it will continue to the upside with, short sell opportunities before heading back upwards
EURJPY BUYS BLUEThis pair has responded positively to the analysis of the recent post and it has now hit take profit perfectly with minimum drawdown

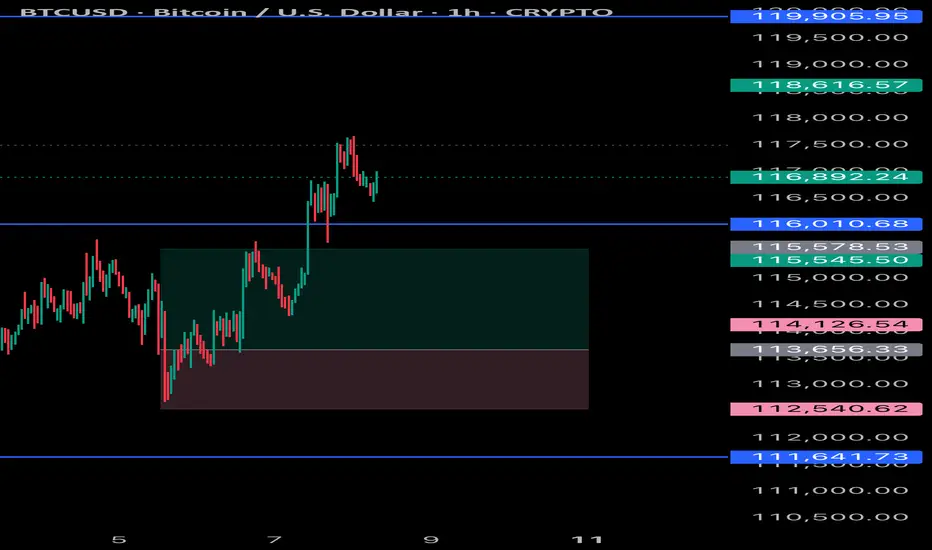
Bitcoin (BTC/USD) – 15M Chart Analysis | Aug 8, 2025
Current Price Action:
BTC is trading at $116,953, hovering inside the yellow demand zone ($115,800–$117,000), showing short-term consolidation.
Immediate Resistance:
$117,681 is the key intraday resistance; repeated rejections here signal strong seller presence before the $118,800 zone.
Support Levels:
The yellow zone’s lower boundary near $115,800 is crucial; below this, the next major supports are $113,239 and $111,989.
Momentum Outlook:
After a sharp rally, price is ranging with reduced volatility — indicating a potential breakout setup in either direction.
Trading Bias:
Bullish: Break & hold above $117,681 → targets $118,809 and $119,862.
Bearish: Drop below $115,800 → downside toward $113,239 likely.

Dow Jones Industrial Average (DJIA) – 1H Chart Analysis | Aug 8,Current Structure:
Price is trading between 44,119 resistance and 43,816 support, consolidating after a sharp drop and partial recovery.
Resistance Zone:
The 44,119 level is acting as immediate intraday resistance; a clean breakout could push toward 44,514.
Support Zone:
43,816 remains a strong floor; below this, 43,524 is the key level where last strong bullish reversal started.
Momentum Outlook:
Recovery candles are showing smaller bodies with upper wicks, suggesting buyers are cautious and momentum is fading.
Trading Bias:
Bullish: Break above 44,119 → target 44,514.
Bearish: Break below 43,816 → retest of 43,524 likely.

U.S. Dollar Index (DXY) – 15M Chart Analysis | Aug 8, 20251. Market Structure:
DXY is trading in a short-term range between 98.471 resistance and 97.952 support, following a sharp downtrend from the 99.072 high.
2. Supply Zone Pressure:
The 98.471 level acts as a strong intraday supply, repeatedly rejecting price and limiting bullish momentum.
3. Demand Zone Cushion:
The 97.952 level is holding as immediate support. Below that, the yellow zone around 97.60–97.45 is a major demand area where buyers may step in.
4. Momentum Bias:
Lower highs from the recent peaks signal ongoing bearish pressure. Short-term rallies are getting sold into, suggesting sellers control the market.
5. Next Move:
Bullish: Break above 98.471 opens path to 98.829–99.072 .
Bearish: Break below 97.952 targets the 97.60–97.45 demand zone.

GBPCAD: Could we see price continue to the downside?Price on GBPCAD looks quite interesting at the moment, this latest moves continues the narrative of a downtrend.
As it is following a downtrend, each touch has served as a catalyst for a directional move. The most recent interaction is particularly interesting, because it's hovering here for some time now, and this could be a clue that we can use.
What may follow is subtle but telling: compression at trendline, low-volume candles suggesting exhaustion, all aligning for more potential release downward.
My target would be toward 1.8100 where we have a clear support zone. Momentum has respected structure and if this move plays out, I don't think it will be a breakout, but a continuation of a narrative that’s already been happening. This is what makes the setup so compelling. It’s not new, it’s the a "story being told".
Though a scenario for more upside is possible and can happen just as much. Still, I would take the side for more downside taken into account all above.

GBPUSD: Bullish Continuation Ahead?! 🇬🇧🇺🇸
GBPUSD violated a significant resistance cluster yesterday.
The market broke through that with a high momentum bullish candle.
Chances will be high that the pair will continue rising.
The next goal for the buyers is 1.35 psychological resistance.
❤️Please, support my work with like, thank you!❤️

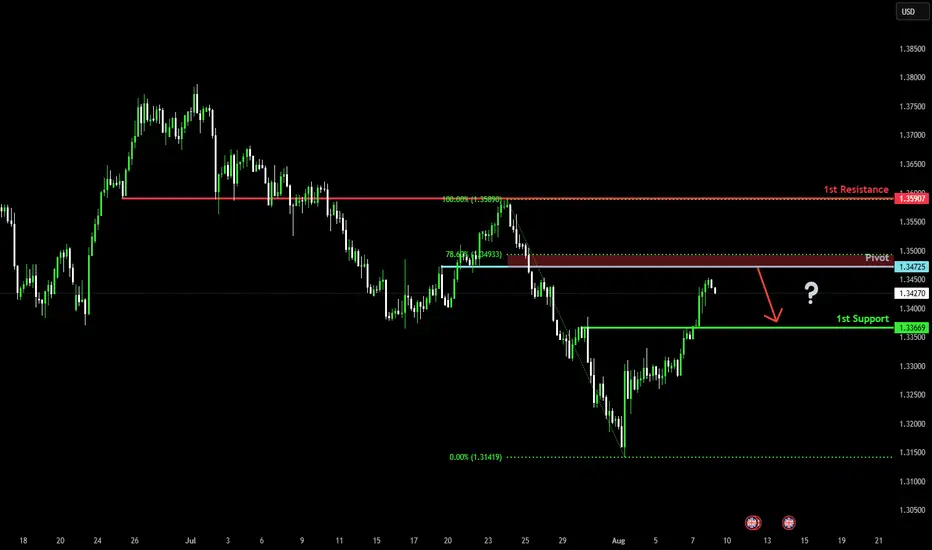
Could the Cable reverse from here?The price is rising towards the pivot and could reverse to the 1st support, which has been identified as a pullback support.
Pivot: 1.3472
1st Support: 1.3366
1st Resistance: 1.3590
Risk Warning:
Trading Forex and CFDs carries a high level of risk to your capital and you should only trade with money you can afford to lose. Trading Forex and CFDs may not be suitable for all investors, so please ensure that you fully understand the risks involved and seek independent advice if necessary.
Disclaimer:
The above opinions given constitute general market commentary, and do not constitute the opinion or advice of IC Markets or any form of personal or investment advice.
Any opinions, news, research, analyses, prices, other information, or links to third-party sites contained on this website are provided on an "as-is" basis, are intended only to be informative, is not an advice nor a recommendation, nor research, or a record of our trading prices, or an offer of, or solicitation for a transaction in any financial instrument and thus should not be treated as such. The information provided does not involve any specific investment objectives, financial situation and needs of any specific person who may receive it. Please be aware, that past performance is not a reliable indicator of future performance and/or results. Past Performance or Forward-looking scenarios based upon the reasonable beliefs of the third-party provider are not a guarantee of future performance. Actual results may differ materially from those anticipated in forward-looking or past performance statements. IC Markets makes no representation or warranty and assumes no liability as to the accuracy or completeness of the information provided, nor any loss arising from any investment based on a recommendation, forecast or any information supplied by any third-party.