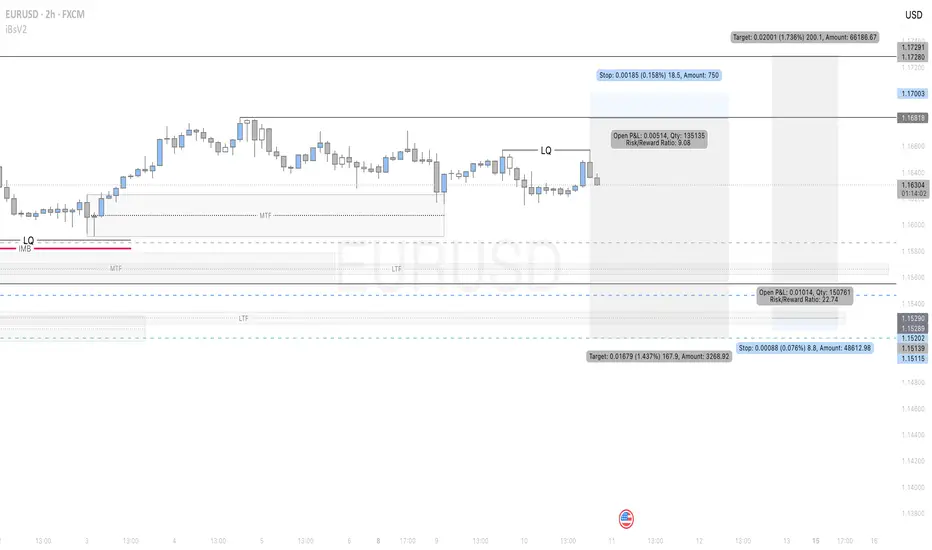
looking for a long opportunity on EURUSDTrenline liquidity is forming, I'm expecting a sweep to the downside and a reversal at discount zone of 4 hour timeframe
Fractal

Bitcoin BTC price analysis📊 US macro data has been updated — and CRYPTOCAP:BTC reacted with a bounce to the upside.
Altcoins, meanwhile, still look confused, as if they don’t know where to run yet 🤷♂️
😨 Fear & Greed Index: 11.
That’s extreme fear — and historically, such levels often mark zones where a gradual recovery can begin. Possibly even starting tomorrow.
📈 Overall, the OKX:BTCUSDT price action in 2025 looks very similar to #Bitcoin ’s behavior in 2021–2022.
We really want to believe we’re already in “Phase 2” of this fractal.
Because if this is still “Phase 1”, history suggests a scenario like:
➡️ first $103,000 BTC,
➡️ then potentially a deeper move toward $53,000.
🤔 What do you think — are we already transitioning into recovery, or is another painful leg still ahead?
______________
◆ Follow us ❤️ for daily crypto insights & updates!
🚀 Don’t miss out on important market moves
🧠 DYOR | This is not financial advice, just thinking out loud

XAU/USD 17 December 2025 Intraday AnalysisH4 Analysis:
-> Swing: Bullish.
-> Internal: Bullish.
Analysis and bias remains the same as analysis dated 20 October 2025.
Price has printed as per previous intraday expectation by printing a bearish CHoCH which indicates, but not confirms, bullish pullback phase initiation.
Price is currently trading within an established internal range, however, I will continue to monitor price with regards to depth of pullback.
Intraday expectation:
Price to continue bearish, react at either discount of 50% internal EQ, or H4 supply zone before targeting weak internal high priced at 4,380.990.
Note:
The Federal Reserve’s sustained dovish stance, coupled with ongoing geopolitical uncertainties, is likely to prolong heightened volatility in the gold market. Given this elevated risk environment, traders should exercise caution and recalibrate risk management strategies to navigate potential price fluctuations effectively.
Additionally, gold pricing remains sensitive to broader macroeconomic developments, including policy decisions under President Trump. Shifts in geopolitical strategy and economic directives could further amplify uncertainty, contributing to market repricing dynamics.
H4 Chart:
M15 Analysis:
-> Swing: Bullish.
-> Internal: Bullish.
Analysis and bias remains the same as yesterday's analysis dated 15 December 2025.
As mentioned in my analysis and intraday expectation dated 11 December that I will allow price to print pause and to confirm an internal high.
Price has printed a bearish CHoCH and reacted at almost precisely 50% internal EQ.
Intraday expectation:
Price to target weak internal high priced at 4,353.555.
Note:
Gold continues to exhibit elevated volatility as markets digest the Federal Reserve’s ongoing dovish tilt and persistent global geopolitical tensions.
With uncertainty remaining a dominant theme across global risk assets, traders should prioritise disciplined risk management, as abrupt price swings and liquidity pockets may become increasingly common.
Furthermore, recent tariff announcements from President Trump, particularly those directed at China, have added another layer of instability to the macro landscape. These policy developments have the potential to intensify market turbulence, heighten risk‑off flows, and trigger sharp intraday reversals or whipsaw‑like behaviour in gold.
M15 Chart:

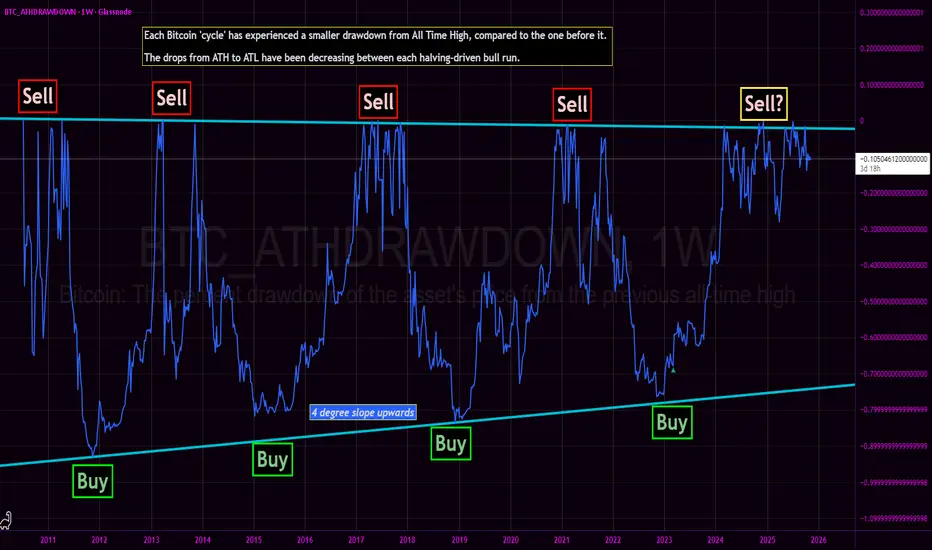
Bitcoin All Time High Drawdown - Bottom nowhere in sight?We revisit the Bitcoin All Time High Drawdown chart originally published in March 2023.
The core thesis of the BTC_ATHDRAWDOWN chart remains intact: each subsequent market cycle has exhibited a diminishing drawdown from its prior All-Time High, with generational cycle bottoms resting squarely on a discernible upward-sloping diagonal support (the 'Buy' line). The 2022-2023 bear market bottomed perfectly on this structural trendline, confirming the '4 degree slope upwards' trend.
Current Cycle Progress: The Sawtooth Fractal
Following the decisive breakthrough of the 2021 All-Time High, price action has entered an unprecedented and structurally complex phase. We are currently witnessing a prolonged high-frequency sawtooth waveform of continuous All-Time Highs.
This action represents the longest sawtooth fractal near ATH of any cycle prior.
This is a stark deviation from the swift, parabolic ascents that characterized previous blow-off tops:
Contrasting the 2017 Pattern: The 2017 bull run culminated in a sharp, almost vertical run-up to $20,000, immediately followed by a steep and rapid crash. That was a classic V-top.
The 2024/2025 Pattern: Instead of a quick V-top, the market is engaged in an extended, messy distribution/consolidation phase right at the very peak. The continuous setting of new, marginal ATHs followed by sharp, shallow pullbacks creates a dense, high-frequency signal in the ATH Drawdown chart.
This structural evolution—a prolonged struggle to hold and marginally exceed previous peaks—suggests that the market is either building a much larger, more resilient base for an extended super-cycle, or undergoing a slow, drawn-out distribution that fundamentally alters the historical BTC cycle cadence.
This is not financial advice, and presented merely as conjectural musing.
XAU/USD 16 December 2025 Intraday AnalysisH4 Analysis:
-> Swing: Bullish.
-> Internal: Bullish.
Analysis and bias remains the same as analysis dated 20 October 2025.
Price has printed as per previous intraday expectation by printing a bearish CHoCH which indicates, but not confirms, bullish pullback phase initiation.
Price is currently trading within an established internal range, however, I will continue to monitor price with regards to depth of pullback.
Intraday expectation:
Price to continue bearish, react at either discount of 50% internal EQ, or H4 supply zone before targeting weak internal high priced at 4,380.990.
Note:
The Federal Reserve’s sustained dovish stance, coupled with ongoing geopolitical uncertainties, is likely to prolong heightened volatility in the gold market. Given this elevated risk environment, traders should exercise caution and recalibrate risk management strategies to navigate potential price fluctuations effectively.
Additionally, gold pricing remains sensitive to broader macroeconomic developments, including policy decisions under President Trump. Shifts in geopolitical strategy and economic directives could further amplify uncertainty, contributing to market repricing dynamics.
H4 Chart:
M15 Analysis:
-> Swing: Bullish.
-> Internal: Bullish.
Analysis and bias remains the same as yesterday's analysis dated 15 December 2025.
As mentioned in my analysis and intraday expectation dated 11 December that I will allow price to print pause and to confirm an internal high.
Price has printed a bearish CHoCH and reacted at almost precisely 50% internal EQ.
Intraday expectation:
Price to target weak internal high priced at 4,353.555.
Note:
Gold continues to exhibit elevated volatility as markets digest the Federal Reserve’s ongoing dovish tilt and persistent global geopolitical tensions.
With uncertainty remaining a dominant theme across global risk assets, traders should prioritise disciplined risk management, as abrupt price swings and liquidity pockets may become increasingly common.
Furthermore, recent tariff announcements from President Trump, particularly those directed at China, have added another layer of instability to the macro landscape. These policy developments have the potential to intensify market turbulence, heighten risk‑off flows, and trigger sharp intraday reversals or whipsaw‑like behaviour in gold.
M15 Chart:

Ethereum looks good for a small long position.Ethereum looks good for a small long position. From the $2,927 range, it could rally toward $3,120. Keep a close eye on the critical level at $2,871.57. BINANCE:ETHUSDT

EURCAD opportunity for a SELLmy first entry was not triggered in Change of Structure, I'm eying another entry on the break of structure

great entry on GBPJPYthe buy limit taken at 1 hour discount zone, entry on 1 hour Change of market structure.

XAU/USD 15 December 2025 Intraday AnalysisH4 Analysis:
-> Swing: Bullish.
-> Internal: Bullish.
Analysis and bias remains the same as analysis dated 20 October 2025.
Price has printed as per previous intraday expectation by printing a bearish CHoCH which indicates, but not confirms, bullish pullback phase initiation.
Price is currently trading within an established internal range, however, I will continue to monitor price with regards to depth of pullback.
Intraday expectation:
Price to continue bearish, react at either discount of 50% internal EQ, or H4 supply zone before targeting weak internal high priced at 4,380.990.
Note:
The Federal Reserve’s sustained dovish stance, coupled with ongoing geopolitical uncertainties, is likely to prolong heightened volatility in the gold market. Given this elevated risk environment, traders should exercise caution and recalibrate risk management strategies to navigate potential price fluctuations effectively.
Additionally, gold pricing remains sensitive to broader macroeconomic developments, including policy decisions under President Trump. Shifts in geopolitical strategy and economic directives could further amplify uncertainty, contributing to market repricing dynamics.
H4 Chart:
M15 Analysis:
-> Swing: Bullish.
-> Internal: Bullish.
As mentioned in my analysis and intraday expectation dated 11 December that I will allow price to print pause and to confirm an internal high.
Price has printed a bearish CHoCH and reacted at almost precisely 50% internal EQ.
Intraday expectation:
Price to target weak internal high priced at 4,353.555.
Note:
Gold continues to exhibit elevated volatility as markets digest the Federal Reserve’s ongoing dovish tilt and persistent global geopolitical tensions.
With uncertainty remaining a dominant theme across global risk assets, traders should prioritise disciplined risk management, as abrupt price swings and liquidity pockets may become increasingly common.
Furthermore, recent tariff announcements from President Trump, particularly those directed at China, have added another layer of instability to the macro landscape. These policy developments have the potential to intensify market turbulence, heighten risk‑off flows, and trigger sharp intraday reversals or whipsaw‑like behaviour in gold.
M15 Chart:

Dow Jones Faces Potential Downside Correction“The Dow Jones may start a bearish correction from the current price range toward 47,423. The level at 48,916.77 is critical.” CMCMARKETS:US30

LONG OPPORTUNITY LOOMING ON SILVER!Will silver retest 60 before another rally to the upside?
N.B!
- XAGUSD price might not follow the drawn lines . Actual price movements may likely differ from the forecast.
- Let emotions and sentiments work for you
- ALWAYS Use Proper Risk Management In Your Trades
#silver
#xagusd

XAU/USD 12 December 2025 Intraday AnalysisH4 Analysis:
-> Swing: Bullish.
-> Internal: Bullish.
Analysis and bias remains the same as analysis dated 20 October 2025.
Price has printed as per previous intraday expectation by printing a bearish CHoCH which indicates, but not confirms, bullish pullback phase initiation.
Price is currently trading within an established internal range, however, I will continue to monitor price with regards to depth of pullback.
Intraday expectation:
Price to continue bearish, react at either discount of 50% internal EQ, or H4 supply zone before targeting weak internal high priced at 4,380.990.
Note:
The Federal Reserve’s sustained dovish stance, coupled with ongoing geopolitical uncertainties, is likely to prolong heightened volatility in the gold market. Given this elevated risk environment, traders should exercise caution and recalibrate risk management strategies to navigate potential price fluctuations effectively.
Additionally, gold pricing remains sensitive to broader macroeconomic developments, including policy decisions under President Trump. Shifts in geopolitical strategy and economic directives could further amplify uncertainty, contributing to market repricing dynamics.
H4 Chart:
M15 Analysis:
-> Swing: Bullish.
-> Internal: Bullish.
Price has printed as per analysis dated 02 December 2025 where I mentioned price to trade down to either discount of 50% internal EQ, or M15 demand zone before targeting weak internal high, priced at 4,264.700. This is how price printed.
Price has now tapped into a previous H4 demand zone and is continuing it's bullish trajectory, therefore, I am unable to confirm fractal high.
Current CHoCH positioning is denoted with a blue horizontal dotted line.
Intraday expectation:
Allow price to continue with its bullish trajectory as there has been no pause to confirm fractal high.
Note:
Gold remains highly volatile amid the Federal Reserve's continued dovish stance, persistent and escalating geopolitical uncertainties. Traders should implement robust risk management strategies and remain vigilant, as price swings may become more pronounced in this elevated volatility environment.
Additionally, President Trump’s tariff announcements, particularly against China, are expected to further amplify market turbulence, potentially triggering sharp price fluctuations and whipsaws.
M15 Chart:

Why This 2022 Bitcoin Fractal Might Fail The 2022 bear‑market fractal 📉
The fractal taken from the 2022 bear market. Back then Bitcoin built a rising wedge pattern and then dropped about 60% in value from the breakdown.
What “everyone” expects now 😱
Many traders now expect Bitcoin to repeat that same pattern crash.
Social media, bears and even cautious bulls keep pointing to the old wedge and saying “this dump is next.”
Why this time can be different 💡
Markets rarely give the majority the easy trade; when everyone leans to one side, that scenario often gets crowded and fails.
If most traders are positioned for a huge crash, any sustained bid or positive macro surprise can squeeze them and send price higher instead.
My view based on the chart 📊🚀
I consider an alternative path: a choppy but upward trend, driven by forced short covering and new buyers stepping in as the crash fails to appear.
Key takeaway ✅
Yes, the 2022 fractal shows what could happen.
But because almost everyone already sees and trades that same pattern, the higher probability play now is that Bitcoin does not repeat the exact 60% wipeout and instead grinds higher while late bears get trapped.

XAU/USD 11 December 2025 Intraday AnalysisH4 Analysis:
-> Swing: Bullish.
-> Internal: Bullish.
Analysis and bias remains the same as analysis dated 20 October 2025.
Price has printed as per previous intraday expectation by printing a bearish CHoCH which indicates, but not confirms, bullish pullback phase initiation.
Price is currently trading within an established internal range, however, I will continue to monitor price with regards to depth of pullback.
Intraday expectation:
Price to continue bearish, react at either discount of 50% internal EQ, or H4 supply zone before targeting weak internal high priced at 4,380.990.
Note:
The Federal Reserve’s sustained dovish stance, coupled with ongoing geopolitical uncertainties, is likely to prolong heightened volatility in the gold market. Given this elevated risk environment, traders should exercise caution and recalibrate risk management strategies to navigate potential price fluctuations effectively.
Additionally, gold pricing remains sensitive to broader macroeconomic developments, including policy decisions under President Trump. Shifts in geopolitical strategy and economic directives could further amplify uncertainty, contributing to market repricing dynamics.
H4 Chart:
M15 Analysis:
-> Swing: Bullish.
-> Internal: Bullish.
Analysis and bias remains the same as yesterday's analysis dated 02 December 2025.
Price has printed as per analysis dated 14 November 2025 where I mentioned price to trade down to either discount of 50% internal EQ, or M15 demand zone before targeting weak internal high, priced at 4,245.195.
Price subsequently printed a bearish CHoCH, however, as mentioned yesterday, I would closely monitor price with respect to depth of pullback.
Price did not pull back with any significance, therefore, I will apply discretion and not classify an iBOS. I have marked this with red dotted and dashed lines.
Price has since printed another bearish CHoCH.
We are currently trading within an established internal range, however, as per yesterday, I will continue to monitor price with respect to depth of pullback.
Intraday expectation:
Price to trade down to either discount of 50% internal EQ, or M15 demand zone before targeting weak internal high, priced at 4,264.700.
Note:
Gold remains highly volatile amid the Federal Reserve's continued dovish stance, persistent and escalating geopolitical uncertainties. Traders should implement robust risk management strategies and remain vigilant, as price swings may become more pronounced in this elevated volatility environment.
Additionally, President Trump’s tariff announcements, particularly against China, are expected to further amplify market turbulence, potentially triggering sharp price fluctuations and whipsaws.
M15 Chart:

XAU/USD 10 December 2025 Intraday AnalysisH4 Analysis:
-> Swing: Bullish.
-> Internal: Bullish.
Analysis and bias remains the same as analysis dated 20 October 2025.
Price has printed as per previous intraday expectation by printing a bearish CHoCH which indicates, but not confirms, bullish pullback phase initiation.
Price is currently trading within an established internal range, however, I will continue to monitor price with regards to depth of pullback.
Intraday expectation:
Price to continue bearish, react at either discount of 50% internal EQ, or H4 supply zone before targeting weak internal high priced at 4,380.990.
Note:
The Federal Reserve’s sustained dovish stance, coupled with ongoing geopolitical uncertainties, is likely to prolong heightened volatility in the gold market. Given this elevated risk environment, traders should exercise caution and recalibrate risk management strategies to navigate potential price fluctuations effectively.
Additionally, gold pricing remains sensitive to broader macroeconomic developments, including policy decisions under President Trump. Shifts in geopolitical strategy and economic directives could further amplify uncertainty, contributing to market repricing dynamics.
H4 Chart:
M15 Analysis:
-> Swing: Bullish.
-> Internal: Bullish.
Analysis and bias remains the same as yesterday's analysis dated 02 December 2025.
Price has printed as per analysis dated 14 November 2025 where I mentioned price to trade down to either discount of 50% internal EQ, or M15 demand zone before targeting weak internal high, priced at 4,245.195.
Price subsequently printed a bearish CHoCH, however, as mentioned yesterday, I would closely monitor price with respect to depth of pullback.
Price did not pull back with any significance, therefore, I will apply discretion and not classify an iBOS. I have marked this with red dotted and dashed lines.
Price has since printed another bearish CHoCH.
We are currently trading within an established internal range, however, as per yesterday, I will continue to monitor price with respect to depth of pullback.
Intraday expectation:
Price to trade down to either discount of 50% internal EQ, or M15 demand zone before targeting weak internal high, priced at 4,264.700.
Note:
Gold remains highly volatile amid the Federal Reserve's continued dovish stance, persistent and escalating geopolitical uncertainties. Traders should implement robust risk management strategies and remain vigilant, as price swings may become more pronounced in this elevated volatility environment.
Additionally, President Trump’s tariff announcements, particularly against China, are expected to further amplify market turbulence, potentially triggering sharp price fluctuations and whipsaws.
M15 Chart:

GOLD vs BITCOIN FRACTAL ! Let’s deeply analyze this Gold (1973-1980) and Bitcoin (2021-2025) fractal (price action similarity) within its historical, cyclical, and technical contexts.
1. The Macroeconomic Stage: 1970s vs. 2020s
It is no coincidence that these two charts resemble each other so closely. Both assets matured during similar periods of "monetary expansion and crises of confidence."
Gold (1970s):
Event: Nixon removing the US Dollar from the Gold Standard in 1971 (The end of Bretton Woods).
Environment: High inflation (Stagflation), oil crises, and geopolitical tensions. Investors fled from depreciating fiat currency into "real money" (Gold).
Bitcoin (2020s):
Event: The largest monetary expansion in history following COVID-19 (M2 Money Supply surge).
Environment: Global inflation waves, banking crises, conflicts, and digitalization. Investors are turning to "Digital Gold" as a hedge against inflation.
Common Ground: Both eras are characterized by shaken trust in fiat currency (the Dollar) and a flight toward assets with limited supply.
2. Technical Structure and Fractal Analysis
The similarity in the charts aligns perfectly with Elliott Wave Theory and Wyckoff Cycle principles. Let's break it down step-by-step:
A. "Double Top" and Correction
Gold (1974): Formed a double top at the $200 level and entered a harsh bear market (nearly 50% drop).
Bitcoin (2021): Formed a double top at the $69,000 level (April and November) and dropped 77%.
Psychology: This phase is the "Distribution" stage where the initial FOMO (Fear Of Missing Out) wave dies down and "weak hands" are flushed out of the market.
B. Accumulation and the "Mid" Bottom
In both charts, following the crash, a long, exhausting sideways/slightly declining "Rounded Bottom" (Cup) structure is formed.
Point 1 (The Bottom): The darkest point of the bear market. (1976 for Gold; the 2022 FTX collapse for BTC).
C. ATH (All-Time High) Breakout and the "Trap"
This is the most critical point of the fractal.
Gold (1978-1979): Broke its previous peak of $200. Everyone said "we are taking off," but the price pulled back to test this level.
Bitcoin (2024-2025): Broke the 2021 peak of $69,000 (and the upper band of the channel shown). It is currently trying to hold above this region.
D. "Most Say Double Top"
The arrows and the region marked '3' on the chart are the litmus test for market psychology.
As price consolidates just above the old high, fearful investors believe this is a "Bull Trap" and that the price will crash.
Gold Example: When Gold hovered around $250, analysts said, "that's enough, it will fall." However, this was merely the final shakeout before the Parabolic Rise (Mania Phase).
Bitcoin Situation: The current movement in the $90,000 - $100,000 band looks technically like a carbon copy of Gold’s action at $250.
3. Time Scale & Pace
The most important difference to note here is the Speed of Time.
Gold: It took approximately 7 years to complete this formation (1973-1980).
Bitcoin: Crypto markets move much faster than traditional markets (24/7 trading, algorithmic bots, internet speed). Bitcoin is completing this cycle in about 4 years.
Conclusion: The process in Bitcoin is progressing approximately 2x faster than Gold. What Gold did in 1 year, Bitcoin can do in 6 months.
4. Scenario Projection: What If the Fractal Plays Out?
If Bitcoin follows the path Gold took post-1979 (the parabolic vertical ascent shown in the chart):
Confirmation Phase (Point 3): The process we are currently in (or about to enter). The moment old resistance (70k-90k) flips into solid support.
Mania Phase (Parabolic Rise): After breaking $250, Gold shot up to $850 in a very short time (approximately 3.4x).
Bitcoin Target: If we apply a similar 3x-4x "Mania" multiplier from the breakout point of ~$74,000, this mathematically takes us to the $220,000 - $280,000 band.
This chart tells us one thing: We haven't started the real party yet.
Observation: The current volatility and the fear of "will it drop?" is simply the final ticket check before the major rally (Re-accumulation).
Risk: Fractals do not work 100% of the time. Macro dynamics (US interest rate decisions, regulations) can disrupt the process. However, the technical structure looks hyper-bullish.
Strategy:
Region 3 on the chart (the support test) is a buying opportunity.
If Bitcoin follows the historical Gold chart, we could see a very sharp, vertical, and parabolic rise (a "God Candle") within the next 12-18 months.
Conclusion: Gold was the "Analog Safe Haven" of the 1970s. Bitcoin is the "Digital Safe Haven" of the 2020s. The historical scenario suggests Bitcoin is currently "performing final engine checks on the runway."
--------------------------------------------------
The "cyclical similarity" between these two assets is not merely about price lines looking alike. This similarity rests on the universal laws of human psychology and economic liquidity cycles.
As a data analyst and market expert, I break down the 4 most critical cyclical similarities ("Cyclical Drivers") between these two charts as follows:
1. The "Fiat Currency Devaluation" Cycle
Both charts are actually pricing in the loss of value of money rather than the appreciation of the asset itself. This is the fuel of the cycle.
Gold (1970s): In 1971, Nixon abandoned the Gold Standard. Once the physical backing behind the Dollar was removed, a fear of "unlimited dollar printing" emerged. This triggered a 10-year inflation cycle.
Bitcoin (2020s): In 2020-2021, central banks printed an unprecedented amount of money (M2 Money Supply explosion). Bitcoin’s cycle is built upon absorbing this excess liquidity and the shaking of trust in fiat currency (banking crises, etc.).
Common Ground: Both cycles represent a "Flight to Safety."
2. The "Institutional Adoption and Financialization" Cycle
This is the phase where an asset moves from a "niche" market to a global asset class.
Gold (1974): The lifting of the ban on gold ownership for individuals in the US and the opening of Futures markets allowed institutional money to enter gold. This laid the infrastructure for the massive rise (mania) of the late 1970s.
Bitcoin (2024): The approval of Spot Bitcoin ETFs (BlackRock, Fidelity, etc.). Just as it happened with Gold in the 70s, the path is now open for institutional capital (pension funds, corporate treasuries) to enter Bitcoin via legal and easy routes.
Significance: "Phase 3" on the chart (confirmation after the breakout) is exactly the period where "Smart Money" takes positions and locks up the supply.
3. The Market Psychology Cycle (Wall St. Cheat Sheet)
The "Double Top" followed by the "Cup" structure in the charts is a direct reflection of the classic market psychology cycle.
Denial and Depression: The "Mid" bottom levels on the chart. While investors say "Bitcoin is dead" or "Gold will never rise again," the "Weak Hands" are actually being eliminated.
Disbelief: The phase we are currently in (Point 3 on the chart). Price breaks the old high (ATH), but no one believes it. It is called a "trap" or "it will fall again."
Cyclical Similarity: In both charts, the "pullback/test" movement that comes after the ATH breakout is the moment the "Last Skeptics" are thrown off the train. The "Mania" phase begins immediately after this.
4. The Supply Shock Cycle
Price is pushed up not just by demand, but also by constraints in supply.
Gold: In the 70s, rising mining costs and geopolitical crises constrained supply.
Bitcoin: The "Halving" mechanism. Every 4 years, the supply of new Bitcoin is cut in half. The current cycle (2024-2025) is the period where a supply shock (Bitcoin Halving) collides with a demand shock (ETFs).
In Summary; Why Do They Look Alike?
Bitcoin is the digital gold of the modern era.
The Gold chart of the 1970s is the best historical data available to show how an asset is priced when it completes the process of becoming "money." Bitcoin is currently undergoing the "Price Discovery" cycle—mathematically and algorithmically—that Gold experienced in the 1970s.

GBPUSDGU made and aggressive rally to the upside taking out previous highs.
We can look for continuations once price reaches an area or interest or the discounted price.

Litecoin's XRP-like breakout - 4 digitsIf you overlay XRP's 2024 breakout fractal on top Litecoin's current price action, it's nearly a perfect fit.
With new business cycle, dovish Fed stance acting as tailwinds (QE and rate cuts) as well as other regulatory and market access (CLARITY Act, Index ETFs, etc.), whenever Litecoin decides to break out of this long term compression - it will be violent.
Steven McClurg (Canary CEO) has said that Litecoin is the privacy token he is most bullish on.
Litecoin is the overall token that I am most bullish on.

XAU/USD 09 December 2025 Intraday AnalysisH4 Analysis:
-> Swing: Bullish.
-> Internal: Bullish.
Analysis and bias remains the same as analysis dated 20 October 2025.
Price has printed as per previous intraday expectation by printing a bearish CHoCH which indicates, but not confirms, bullish pullback phase initiation.
Price is currently trading within an established internal range, however, I will continue to monitor price with regards to depth of pullback.
Intraday expectation:
Price to continue bearish, react at either discount of 50% internal EQ, or H4 supply zone before targeting weak internal high priced at 4,380.990.
Note:
The Federal Reserve’s sustained dovish stance, coupled with ongoing geopolitical uncertainties, is likely to prolong heightened volatility in the gold market. Given this elevated risk environment, traders should exercise caution and recalibrate risk management strategies to navigate potential price fluctuations effectively.
Additionally, gold pricing remains sensitive to broader macroeconomic developments, including policy decisions under President Trump. Shifts in geopolitical strategy and economic directives could further amplify uncertainty, contributing to market repricing dynamics.
H4 Chart:
M15 Analysis:
-> Swing: Bullish.
-> Internal: Bullish.
Analysis and bias remains the same as yesterday's analysis dated 02 December 2025.
Price has printed as per analysis dated 14 November 2025 where I mentioned price to trade down to either discount of 50% internal EQ, or M15 demand zone before targeting weak internal high, priced at 4,245.195.
Price subsequently printed a bearish CHoCH, however, as mentioned yesterday, I would closely monitor price with respect to depth of pullback.
Price did not pull back with any significance, therefore, I will apply discretion and not classify an iBOS. I have marked this with red dotted and dashed lines.
Price has since printed another bearish CHoCH.
We are currently trading within an established internal range, however, as per yesterday, I will continue to monitor price with respect to depth of pullback.
Intraday expectation:
Price to trade down to either discount of 50% internal EQ, or M15 demand zone before targeting weak internal high, priced at 4,264.700.
Note:
Gold remains highly volatile amid the Federal Reserve's continued dovish stance, persistent and escalating geopolitical uncertainties. Traders should implement robust risk management strategies and remain vigilant, as price swings may become more pronounced in this elevated volatility environment.
Additionally, President Trump’s tariff announcements, particularly against China, are expected to further amplify market turbulence, potentially triggering sharp price fluctuations and whipsaws.
M15 Chart:

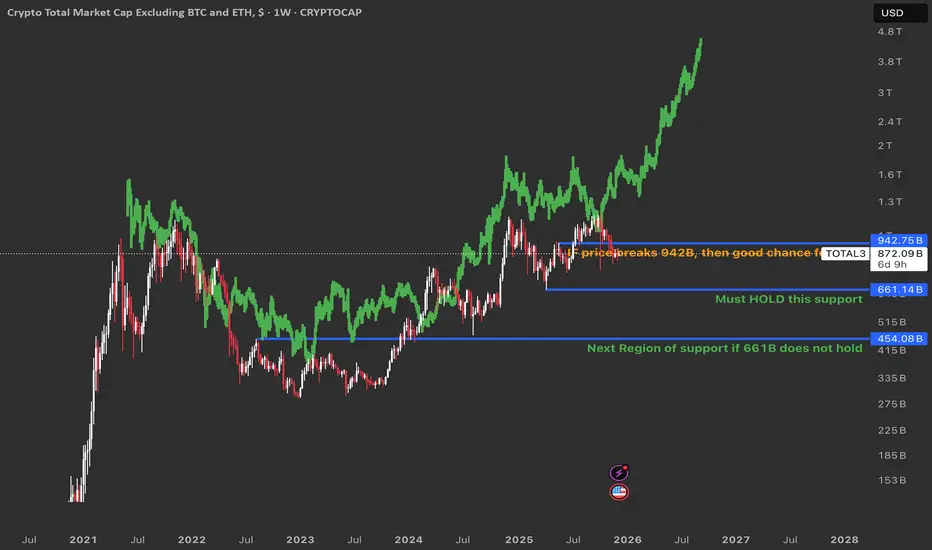
TOTAL3: Altcoin Market At A Big Decision PointThe green line is a fractal of gold’s price from 2011–2020, meaning the altcoin market is moving in a very similar pattern to how gold moved back then.
Scenario 1: Break above 942B 🚀
If TOTAL3 breaks and holds above 942B, it means buyers are strong and the market is likely ready for a big altcoin bull run.
In this case, there is a good chance the price action will continue to follow the green gold fractal, with higher highs and a long, powerful uptrend for altcoins.
Scenario 2: Lose 661B support 😬
If TOTAL3 falls below 661B, price can drop to the next major support area lower on the chart, where buyers previously stepped in.
This bearish scenario is less likely at the moment, but if it happens it would probably mean a deeper correction and a longer wait before a strong altcoin season returns.
Gold: Symmetry Support Node + Value Edge Reversal Setuprice reacted cleanly at a Symmetry Support Node (SSN), aligning with the lower edge of the composite Volume Profile. This level has acted as a recurring inflection zone across the recent cycle.
The current bounce forms at the intersection of:
• SSN structural support
• Composite Value Low (VAL)
• Micro LVA rejection on the 15m profile
• Compression line creating a higher-low structure
This creates a clear value-edge reversal, with price repeatedly rejecting the LVA and absorbing sell pressure. As long as price holds above this reclaimed value edge, continuation toward the next liquidity shelves remains the primary expectation.
Targets:
1. LVN fill above
2. HVA shelf
3. Upper Symmetry Node (SSN)
Setup remains valid while price trades above the reclaimed Value Edge and maintains bullish micro-structure.

XAU/USD 08 December 2025 Intraday AnalysisH4 Analysis:
-> Swing: Bullish.
-> Internal: Bullish.
Analysis and bias remains the same as analysis dated 20 October 2025.
Price has printed as per previous intraday expectation by printing a bearish CHoCH which indicates, but not confirms, bullish pullback phase initiation.
Price is currently trading within an established internal range, however, I will continue to monitor price with regards to depth of pullback.
Intraday expectation:
Price to continue bearish, react at either discount of 50% internal EQ, or H4 supply zone before targeting weak internal high priced at 4,380.990.
Note:
The Federal Reserve’s sustained dovish stance, coupled with ongoing geopolitical uncertainties, is likely to prolong heightened volatility in the gold market. Given this elevated risk environment, traders should exercise caution and recalibrate risk management strategies to navigate potential price fluctuations effectively.
Additionally, gold pricing remains sensitive to broader macroeconomic developments, including policy decisions under President Trump. Shifts in geopolitical strategy and economic directives could further amplify uncertainty, contributing to market repricing dynamics.
H4 Chart:
M15 Analysis:
-> Swing: Bullish.
-> Internal: Bullish.
Analysis and bias remains the same as yesterday's analysis dated 02 December 2025.
Price has printed as per analysis dated 14 November 2025 where I mentioned price to trade down to either discount of 50% internal EQ, or M15 demand zone before targeting weak internal high, priced at 4,245.195.
Price subsequently printed a bearish CHoCH, however, as mentioned yesterday, I would closely monitor price with respect to depth of pullback.
Price did not pull back with any significance, therefore, I will apply discretion and not classify an iBOS. I have marked this with red dotted and dashed lines.
Price has since printed another bearish CHoCH.
We are currently trading within an established internal range, however, as per yesterday, I will continue to monitor price with respect to depth of pullback.
Intraday expectation:
Price to trade down to either discount of 50% internal EQ, or M15 demand zone before targeting weak internal high, priced at 4,264.700.
Note:
Gold remains highly volatile amid the Federal Reserve's continued dovish stance, persistent and escalating geopolitical uncertainties. Traders should implement robust risk management strategies and remain vigilant, as price swings may become more pronounced in this elevated volatility environment.
Additionally, President Trump’s tariff announcements, particularly against China, are expected to further amplify market turbulence, potentially triggering sharp price fluctuations and whipsaws.
M15 Chart:
