XAU/USD 09 September 2025 Intraday AnalysisH4 Analysis:
-> Swing: Bullish.
-> Internal: Bullish.
Price has continued with it's bullish trajectory, printing further ATH's, breaching the $4000 mark for the first time.
Price is currently trading within an internal low and fractal high. CHoCH positioning is denoted with a horizontal blue dotted line
Intraday Expectation:
Price to indicate bearish pullback phase initiation by printing bearish CHoCH.
Note:
The Federal Reserve’s sustained dovish stance, coupled with ongoing geopolitical uncertainties, is likely to prolong heightened volatility in the gold market. Given this elevated risk environment, traders should exercise caution and recalibrate risk management strategies to navigate potential price fluctuations effectively.
Additionally, gold pricing remains sensitive to broader macroeconomic developments, including policy decisions under President Trump. Shifts in geopolitical strategy and economic directives could further amplify uncertainty, contributing to market repricing dynamics.
H4 Chart:
M15 Analysis:
-> Swing: Bullish.
-> Internal: Bullish.
Price continued bullish, printing further ATH's.
Price has printed a bearish CHoCH, however, as mentioned in yesterday's analysis, I will be monitoring depth of pullback. Pullback is insignificant, therefore, I will again apply discretion and not classify as such. I have however marked this in red.
Price has since printed a further bearish CHOCH which means that price is now trading within an established internal range. However, I shall, again, be monitoring depth of pullback.
Intraday expectation: Price to trade down to either discount of 50% EQ, or M15 supply zone before targeting weak internal high priced at 4,059.350.
Alternative Scenario: Price could potentially target strong internal low as H4 TF enters it's bearish pullback phase.
Note:
Gold remains highly volatile amid the Federal Reserve's continued dovish stance, persistent and escalating geopolitical uncertainties. Traders should implement robust risk management strategies and remain vigilant, as price swings may become more pronounced in this elevated volatility environment.
Additionally, President Trump’s tariff announcements are expected to further amplify market turbulence, potentially triggering sharp price fluctuations and whipsaws.
M15 Chart:
Fractal

BTC to 30k Upward trend, leads to sales, takes liquidity from buyers to continue.
See its execution pattern in shorter time frames.

XAU/USD 08 October 2025 Intraday AnalysisH4 Analysis:
-> Swing: Bullish.
-> Internal: Bullish.
Price has again printed a bearish CHoCH. However, I will apply discretion and not classify as such due to insignificant depth of pullback, relative to recent price action. I have however marked this in red once again.
Intraday Expectation:
Allow price to continue with it bullish trajectory and to show signs of bearish pullback phase initiation. This would typically be the printing of a bearish CHoCH, which would indicate bearish pullback phase initiation. Current CHoCH positioning is denoted with a blue horizontal dotted line.
Note:
The Federal Reserve’s sustained dovish stance, coupled with ongoing geopolitical uncertainties, is likely to prolong heightened volatility in the gold market. Given this elevated risk environment, traders should exercise caution and recalibrate risk management strategies to navigate potential price fluctuations effectively.
Additionally, gold pricing remains sensitive to broader macroeconomic developments, including policy decisions under President Trump. Shifts in geopolitical strategy and economic directives could further amplify uncertainty, contributing to market repricing dynamics.
H4 Chart:
M15 Analysis:
-> Swing: Bullish.
-> Internal: Bullish.
Price continued bullish, printing further ATH's.
Price has printed several bearish CHoCH's, however, as mentioned in yesterday's analysis, I would be watching depth of pullback. Pullback on all bearish CHoCH's was insignificant, therefore, I will apply discretion and not classify as such. I have however marked them in red.
Intraday expectation: Allow price to show more definitive signs of bearish pullback phase initiation. This would be for price to trade down to either discount of 50% EQ, or M15 supply zone.
Alternative Scenario: Price could potentially target strong internal low as H4 TF enters it's bearish pullback phase.
Note:
Gold remains highly volatile amid the Federal Reserve's continued dovish stance, persistent and escalating geopolitical uncertainties. Traders should implement robust risk management strategies and remain vigilant, as price swings may become more pronounced in this elevated volatility environment.
Additionally, President Trump’s tariff announcements are expected to further amplify market turbulence, potentially triggering sharp price fluctuations and whipsaws.
M15 Chart:

doge 1.50 2.60If doge can do this again, it maybe could go even higher, anyway , these are our targets.


BTC 167.000 240.000 how bullish?Don´t have an idea , maybe 167k or 240k. Major probability = 200-240k range

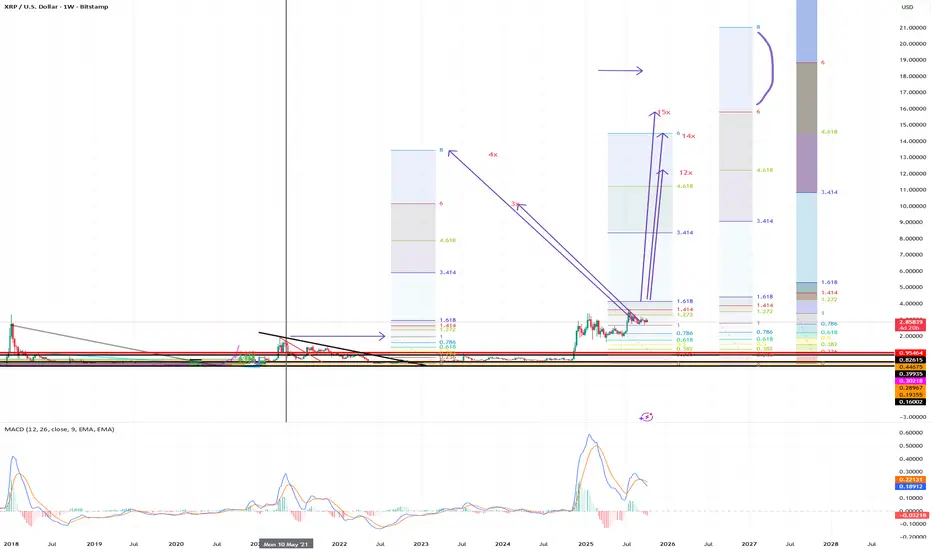
xrp 14 18 24Although we could expect 24 or more, it is possible that the very strong setback, in March 2025, could just let us get 10usd-12usd. If something goes wrong, only 6usd

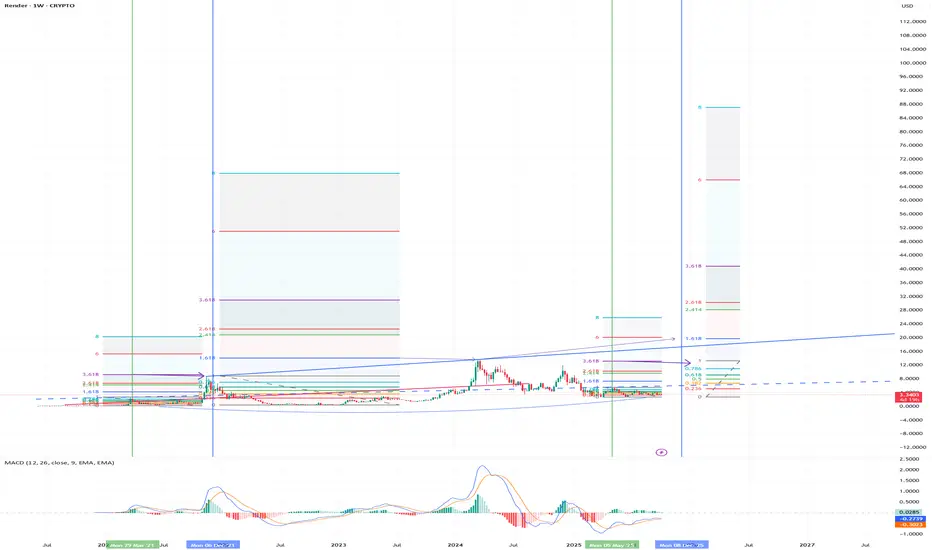
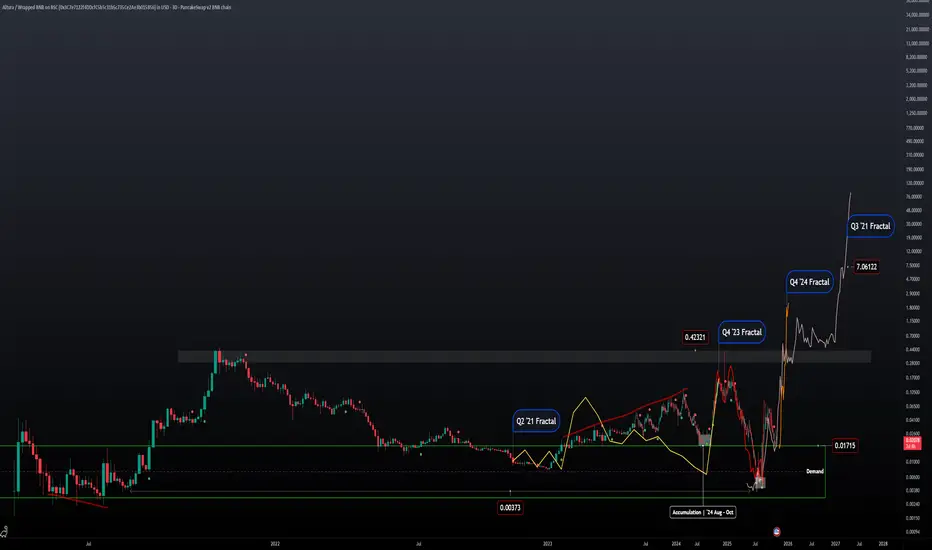
ALU | '21 Fractals | Price Projection Four different fractals with similar results. Q2 '21 price was in convergence and took off in July similarly to price action in '23 -'24. Except price was in divergence and stopped selling off in July and took off in November leaving the middle months for accumulation.
After the expansion phase of the market in '24 price action got tossed into the distribution phase and price was bound to fall to these lows today.
Looking at Q4 '23 Fractal it fits perfectly with what we saw early this year when price was distributing.
Regardless what the news and fundamentals where saying price was able to repeat the same fractal by using the lows of '21.
Q4 '24 Fractal is the most recent pattern that we can reference with todays price action to get a projected estimate.
Current price action has also stopped selling in July and has been accumulating since then
Would like to see price action close at ATHs going into the next year and into the next distribution phase.
XAU/USD 07 October 2025 Intraday AnalysisH4 Analysis:
-> Swing: Bullish.
-> Internal: Bullish.
Price had printed a bearish CHoCH. Where we were trading within an established internal range, however, bearish pullback was insignificant relative to recent price action, therefore, I will not classify the bullish, I have however marked this in red again.
Price has continued bullish printing further ATH's. Price has since printed a bearish CHoCH, which is the first indication, but not confirmation, of bearish pullback phase initiation, however, I will continue to monitor price with respect to dept of pullback.
Price is currently trading within and established internal range.
Intraday Expectation:
Price to trade down to either discount of internal 50% EQ, or H4 supply zone before targeting weak internal high priced at 3,977.400.
Alternative scenario: Price could potentially print higher-highs.
Note:
The Federal Reserve’s sustained dovish stance, coupled with ongoing geopolitical uncertainties, is likely to prolong heightened volatility in the gold market. Given this elevated risk environment, traders should exercise caution and recalibrate risk management strategies to navigate potential price fluctuations effectively.
Additionally, gold pricing remains sensitive to broader macroeconomic developments, including policy decisions under President Trump. Shifts in geopolitical strategy and economic directives could further amplify uncertainty, contributing to market repricing dynamics.
H4 Chart:
M15 Analysis:
-> Swing: Bullish.
-> Internal: Bullish.
Price continued bullish, printing further ATH's.
Price has printed a bearish CHoCH which indicates, but does not confirm, bearish pullback phase initiation. We are now confined with an establish internal range, however, I shall continue to monitor price with respect to depth of pullback.
Intraday expectation: Price to trade down to either M15 supply zone, or discount of 50% EQ before targeting internal high priced at 3,977.400
Alternative Scenario: Price could potentially target strong internal low as H4 TF enters it's bearish pullback phase.
Note:
Gold remains highly volatile amid the Federal Reserve's continued dovish stance, persistent and escalating geopolitical uncertainties. Traders should implement robust risk management strategies and remain vigilant, as price swings may become more pronounced in this elevated volatility environment.
Additionally, President Trump’s tariff announcements are expected to further amplify market turbulence, potentially triggering sharp price fluctuations and whipsaws.
M15 Chart:

BTCUSD | Daily Structure Analysis
Overview :
After breaking the last daily resistance and completing a correction on the weekly timeframe, Bitcoin is now trading below the 124,000 level.
If the price manages to break above 124,500, it could continue its bullish wave toward 127,500, and later 132,700, completing the upward structure.
📈 Resistance Levels:
🔺 124,500 — Key Level
🔺 127,500
🔺 132,500
📉 Support Levels:
🟩 117,700
🟩 114,500
🟩 107,300 — Key Level
🧠 Analytical Note:
A breakout and retest (pullback) of any key level could define the next directional move — whether bullish or bearish.
Currently, the market is testing a strong resistance area, and the reaction here will likely determine next week’s direction.
💬 What’s your outlook on Bitcoin?
Do you think BTC needs a short-term correction before continuing higher?
مرور کلی:
قیمت بیت کوین پس از شکست آخرین مقاومت در تایم فریم روزانه و تکمیل اصلاح در تایم فریم هفتگی، اکنون زیر سقف 124,000 دلار قرار دارد.
در صورتی که قیمت بتواند مقاومت 124,500 را با قدرت بشکند، احتمال حرکت صعودی تا نواحی 127,500 و سپس 132,700 وجود دارد و میتواند موج صعودی فعلی خود را تکمیل کند.
📈 نواحی مقاومت (Resistance Levels):
🔻 124,500 — Key Level
🔻 127,500
🔻 132,500
📉 نواحی حمایت (Support Levels):
🔰 117,700
🔰 114,500
🔰 107,300 — Key Level
🧠 نکته تحلیلی:
شکست هر یک از نواحی کلیدی و بازگشت (پولبک) به آن ها میتواند مسیر حرکت بعدی بازار را مشخص کند؛ چه در جهت صعودی و چه نزولی.
در حال حاضر بازار زیر ناحیهی مقاومتی کلیدی قرار دارد و واکنش قیمت به این سطح میتواند جهت هفته ی آینده را تعیین کند.
💬 نظر شما چیست؟
به نظر شما بیتکوین پیش از ادامه ی حرکت، نیاز به یک استراحت کوتاه ندارد؟

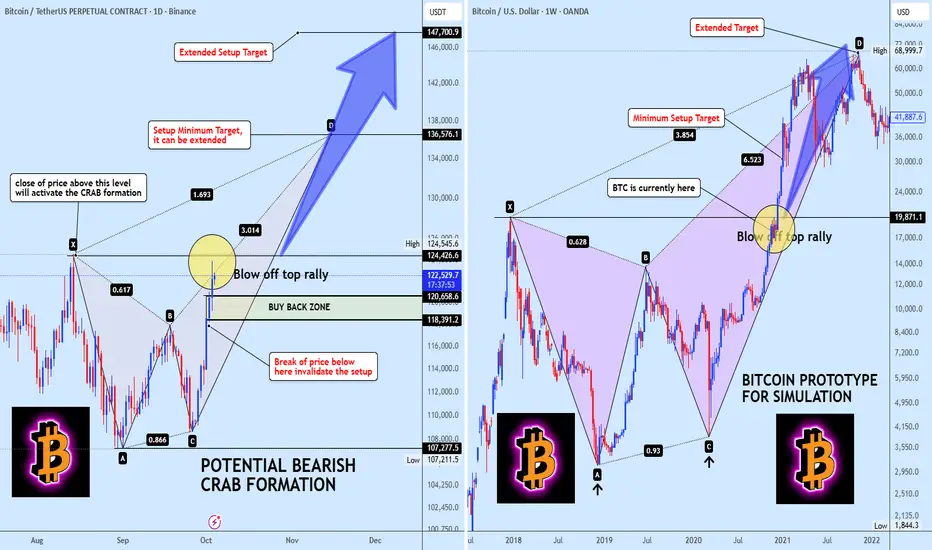
BTC's 2021 Playbook is Back Are You Ready for the Final Rally?History doesn't repeat itself, but it often rhymes. And right now, Bitcoin is composing a symphony we've heard before, one that ended in a PARABOLIC EXPLOSION.
We're looking at a potential BEARISH CRAB PATTERN on the daily chart, and it's a near perfect mirror of the 2017-2021 prototype that launched us to the last cycle top. Buckle up.
The Simple Breakdown:
1. THE ACTIVATION TRIGGER: A daily close ABOVE $124,545. This is the launch button.
2. THE BUY THE DIP ZONE: $118k to $120k. Any dip here could be a gift before the rip.
3. THE FAIL SAFE: A daily close BELOW $107k invalidates the setup. This is our line in the sand.
THE TARGETS:
1. Minimum Target: $136,576
2. Extended Target: $147,700-$160k
The Ghost of Cycles Past (Right Chart):
Look at the 2017-2021 prototype. The C to D leg wasn't just a rally; it was a BLOW OFF TOP of historic proportions. It delivered the targets and then some before exhaustion set in.
The current structure is screaming that we could be at the same inflection point.
This isn't just another pattern. This is a cyclical blueprint suggesting Bitcoin is gearing up for the FINAL, EXPLOSIVE LEG of this cycle.
If this Crab confirms, we are targeting the $136K to $147K+ zone as the potential cycle peak. This is where liquidity floods in and volatility goes vertical.
A Word of Caution:
Always trade with a plan. The invalidation level at $107K is crucial. A break below there means the setup is broken, and we must re-assess.
The takeaway? All eyes on the $124.5K breakout. This could be the start of the grand finale.
XAU/USD 06 October 2025 Intraday AnalysisH4 Analysis:
-> Swing: Bullish.
-> Internal: Bullish.
Price printed as per previous intraday analysis whereby I mentioned price to print bearish CHoCH to indicate bearish pullback phase initiation.
Price has printed a bearish CHoCH. We are currently trading within an established internal range, however, bearish pullback was insignificant relative to recent price action, therefore, I will not classify the bullish, I have however marked this in red.
Price has continued bullish printing ATH's. CHoCH positioning is denoted with a blue horizontal dotted line.
Intraday Expectation:
Price to print bearish CHoCH, thereafter trade down to either discount of internal 50% EQ, or H4 supply zone before targeting weak internal high priced at 3,949.670.
Alternative scenario: Price could potentially print higher-highs.
Note:
The Federal Reserve’s sustained dovish stance, coupled with ongoing geopolitical uncertainties, is likely to prolong heightened volatility in the gold market. Given this elevated risk environment, traders should exercise caution and recalibrate risk management strategies to navigate potential price fluctuations effectively.
Additionally, gold pricing remains sensitive to broader macroeconomic developments, including policy decisions under President Trump. Shifts in geopolitical strategy and economic directives could further amplify uncertainty, contributing to market repricing dynamics.
H4 Chart:
M15 Analysis:
-> Swing: Bullish.
-> Internal: Bullish.
Price printed as per my intraday analysis dated 02 October 2025 whereby I mentioned price to trade down to either M15 supply zone, or discount of 50% EQ before targeting weak internal high priced at 3,895.500.
Price has printed a bullish iBOS. CHoCH positioning is denoted with a blue horizontal dotted line.
Price is now trading within an internal low and fractal high.
Intraday expectation: Price to print bearish CHoCH to indicate, but not confirm bearish pullback phase initiation. Price to then trade down to either M15 supply zone, or discount of 50% EQ before targeting internal high priced at 3,949.670
Alternative Scenario: Price could potentially target strong internal low as H4 TF enters it's bearish pullback phase.
Note:
Gold remains highly volatile amid the Federal Reserve's continued dovish stance, persistent and escalating geopolitical uncertainties. Traders should implement robust risk management strategies and remain vigilant, as price swings may become more pronounced in this elevated volatility environment.
Additionally, President Trump’s tariff announcements are expected to further amplify market turbulence, potentially triggering sharp price fluctuations and whipsaws.
M15 Chart:

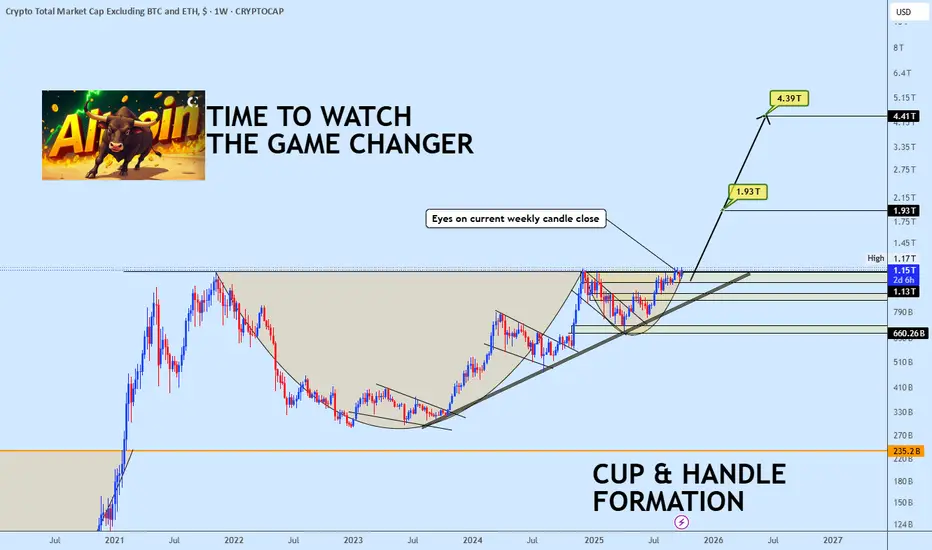
The Altcoin Breakout is HERE this is Your Game Changer!The stage is set. While Bitcoin consolidates its historic breakout, the real narrative shift is quietly unfolding in the altcoin universe.
The TOTAL3 chart (Total Crypto Market Cap Excluding BTC & ETH) is on the verge of confirming one of the most reliable and powerful bullish patterns in technical analysis: a massive Weekly Cup & Handle formation.
The current weekly candle isn't just testing the pattern's neckline, it's powering through it. This isn't just another test; this is the trigger event we've been waiting for.
The Moment of Truth: This Weekly Close is Everything
A confirmed weekly close above this neckline resistance is the final green light. It signals that the months of re-accumulation are over and the true Altcoin Cycle expansion phase is beginning.
This is the moment where "Alt Season" transitions from a hopeful whisper to a market structure reality.
Key Targets to Watch
The Cup and Handle pattern provides a clear, measured move projection.
1. Initial Breakout Target: $1.93 Trillion
2. Full Pattern Target (Cup & Handle): ~$4.39 Trillion
This is the grand prize. Achieving this target would represent a historic rally for the altcoin market cap and imply a period of explosive, parabolic growth for select altcoins.
What This Means For You
This breakout is more than just a lines on a chart event. It signals a profound shift in market dynamics.
1. Liquidity Rotation: As Bitcoin's dominance potentially stabilizes or dips, capital will aggressively flow into the altcoin space seeking higher returns.
2. Sentiment Shift: Fear and uncertainty will be replaced by FOMO (Fear Of Missing Out), driving valuations higher at an accelerating pace.
3. From Accumulation to Parabola: We are moving out of the stealth accumulation phase and into the public markup phase.
4. The message is crystal clear: If you thought you missed the run, think again. The altcoin chapter is just turning its most exciting page.
Here are the plan to follow
1. Aggressive: A confirmed weekly close above the neckline is a strong buy signal for broad altcoin exposure (via majors like ETH, or baskets).
2. Conservative: Use any retest of the former neckline (now turned support) as a high-probability entry point.
Watch this weekly close like a hawk. It's not just another candle, it's the starting pistol.
Like, follow, and let me know in the comments: Which altcoin sectors are you watching most closely for leadership in this oncoming bullrun?
$BTC / Total Global Liquidity / Treasury General Account How hilarious is this - ₿itcoin ended up reaching a new ATH just 5 days after I expected. I was 2 days off on my last call if you remember. And the several before I nailed to the day.
Remember all the grave-dancers last week who were showing you the decorrelation between CRYPTOCAP:BTC & Global Liquidity??
🐤 chirp chirp 😂
It was clear the Treasury General Account was the cause for this deviation, therefore I added it on this chart alongside Total Global Liquidity to monitor more closely.
Note - the TGA is already included in the TGL index, but it appears to hold much more weight so it’s best to look at it alongside.
I also took out the inverted DXY since it’s been tracking near 1 to 1 and was used simply to show confluence.
Now that Fiscal Year Q1 2026 has started, the TGA refill is complete, which will finance the ~$325 Billion outlined in the One Big Beautiful Bill for defense, border security etc. This will also be financed in the form of short-term T-Bill issuance (what I've written about before).
Then we see the trickle down effect as money makes it’s way through the economy and the business cycle booms which is tracked through the ISM PMI.
The latest print on Sept. 30th showed a 1-point uptick now at 49.1, which is a point higher than last month’s reading. I’m confident the next several months will show readings above 50 which show continued growth in the business cycle and health of the overall economy.
To all the haterz - FU HIGHER 🚀

EURUSD STRUCTURE IS NOW BULLISH AFTER HH/HL SINCE 2018!Fibre structure has turned bullish since 2018 when the pair has been creating a LL/LH. A further pullback into the discount area with good rejection, will likely strengthen the bullish outlook further...
N.B!
- EURUSD price might not follow the drawn lines . Actual price movements may likely differ from the forecast.
- Let emotions and sentiments work for you
- ALWAYS Use Proper Risk Management In Your Trades
#eurusd

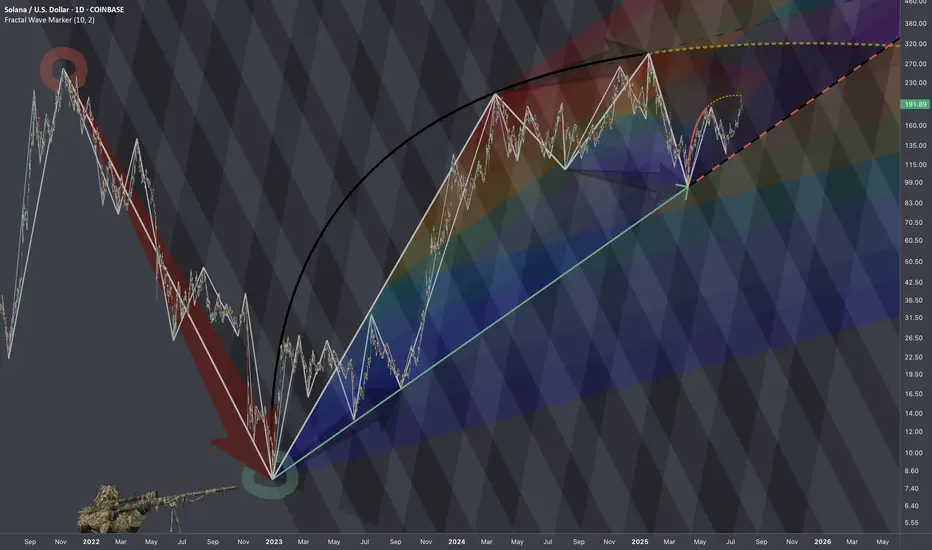
$SOLUSD: Scaling LawsResearch Notes
Progressions here are evident so I'll use the historic bits and organize them into structure that would determine the levels inside dark highlighted zone of the local scope.
If we scale back, it's hard to avoid the massive drop that structurally can serve as reference point.
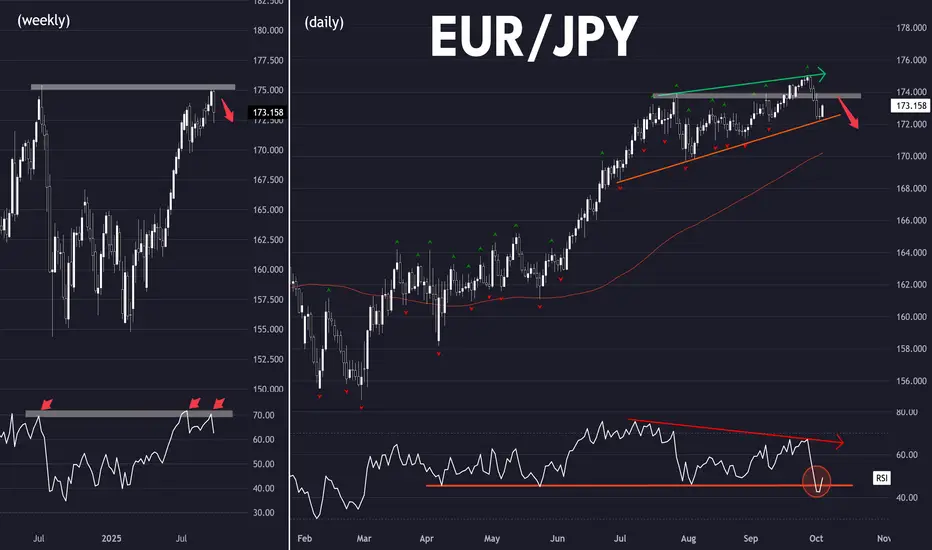
Getting in early on a trend reversal (EUR/JPY)Setup
Bearish: Potential long term top.
Bearish engulfing candlestick from multi-year highs
RSI has dropped from 70 overbought
Signal
Fakeout: Looking for rebound to stall near the former resistance at 174.
RSI bearish divergence, taken out support
Caution: uptrend line has held so far. A break would confirm trend reversal.
Too early to trade the reversal?
Would you weait for a breakdown first ?
Let's discuss
Ta, Jasper
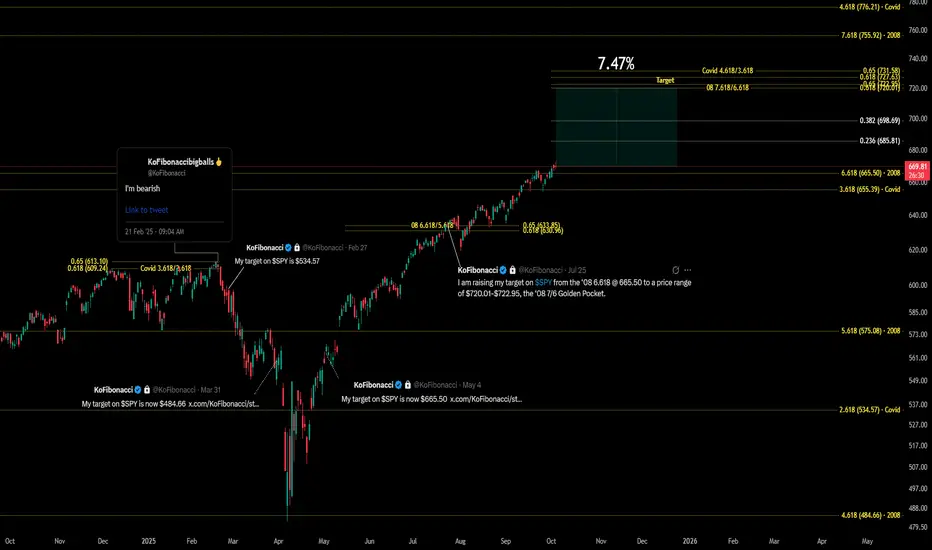
So complex, yet so simple. Only about 7.5% to go. $SPYAMEX:SPY Daily Historical Golden Ratio (9/24-Present)
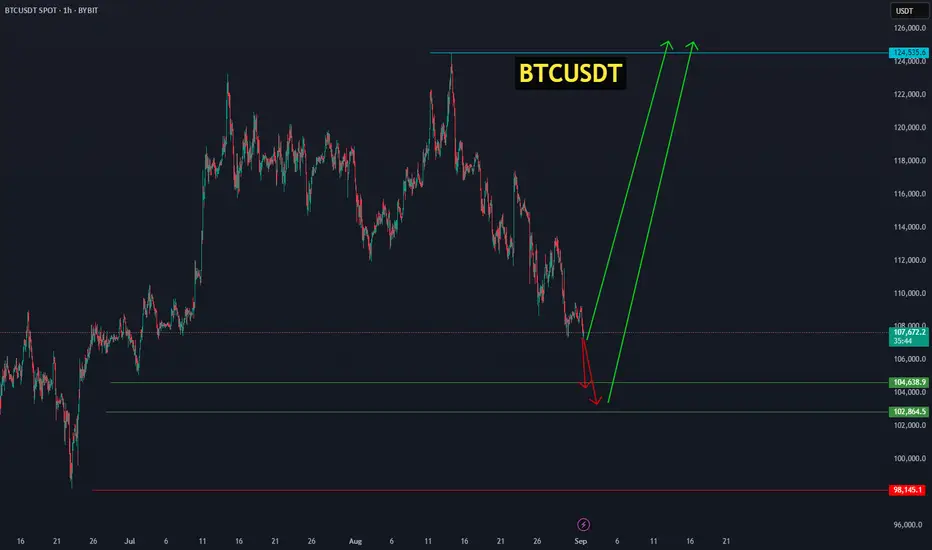
Bitcoin from the 102,864 zone is set to ignite its next bullish Bitcoin will either start its upward move from the current price or from the range of 104,638.9 – 102,864.5, aiming for targets between 118,000 and 124,535. BINANCE:BTCUSDT
XAU/USD 03 October 2025 Intraday AnalysisH4 Analysis:
-> Swing: Bullish.
-> Internal: Bullish.
Price printed as per previous intraday analysis whereby I mentioned price to print bearish CHoCH to indicate bearish pullback phase initiation.
Price has now printed a bearish CHoCH. We are currently trading within an established internal range
Intraday Expectation:
Price continue bearish, down to either discount of internal 50% EQ, or H4 supply zone before targeting weak internal high priced at 3,897.130.
Alternative scenario: Price could potentially print higher-highs.
Note:
The Federal Reserve’s sustained dovish stance, coupled with ongoing geopolitical uncertainties, is likely to prolong heightened volatility in the gold market. Given this elevated risk environment, traders should exercise caution and recalibrate risk management strategies to navigate potential price fluctuations effectively.
Additionally, gold pricing remains sensitive to broader macroeconomic developments, including policy decisions under President Trump. Shifts in geopolitical strategy and economic directives could further amplify uncertainty, contributing to market repricing dynamics.
H4 Chart:
M15 Analysis:
-> Swing: Bullish.
-> Internal: Bullish.
Analysis and bias remains the same as yesterdays analysis dated 02 October 2025.
As per previous intraday expectation, price has printed a bearish CHoCH to indicate, but not confirm, bearish pullback phase initiation .
Price is now trading within an established internal range
Intraday Expectation:
Price to trade down to either M15 supply zone, or discount of 50% EQ before targeting weak internal high priced at 3,895.500.
Alternative Scenario: Price could potentially target strong internal low as H4 TF enters it's bearish pullback phase.
Note:
Gold remains highly volatile amid the Federal Reserve's continued dovish stance, persistent and escalating geopolitical uncertainties. Traders should implement robust risk management strategies and remain vigilant, as price swings may become more pronounced in this elevated volatility environment.
Additionally, President Trump’s tariff announcements are expected to further amplify market turbulence, potentially triggering sharp price fluctuations and whipsaws.
M15 Chart:

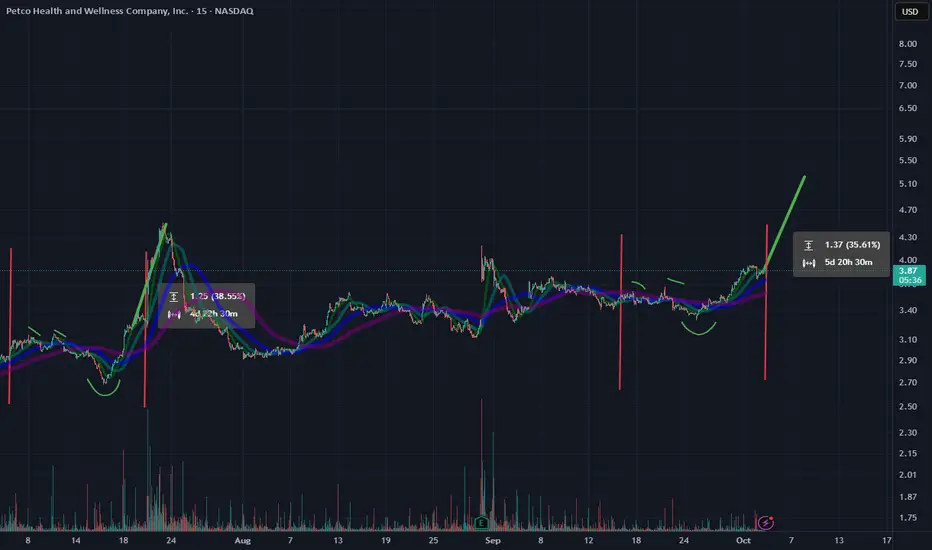
PETCO (WOOF) Fractal into TargetOn the higher timeframes, WOOF has consolidated above all major moving averages, signaling a reversal from its long-term downtrend. It has also established support along trend lines. From a fundamental perspective, the impact of store closures appears fully priced in, and these closures should improve net profit by eliminating underperforming locations. Combined with the onset of a new market cycle, this positions WOOF for potential upside momentum.
With both the technical and fundamental factors aligned, the current short-term fractal fits neatly into broader trading patterns, pointing toward a near-term target in the $5.10–$5.20 range.