DOGE Daily MA Hints and CluesDOGEUSD Daily Outlook: Signs of Accumulation?
Thanks for taking the time to check out my analysis on DOGEUSD. Let’s dive in.
Most traders are familiar with moving averages and crossover signals — and while these are often viewed as lagging indicators, I’ve found that using multiple moving averages together can offer much clearer insights, especially when paired with other supporting tools.
On this chart, I’m using a combination of simple moving averages (SMA) and exponential moving averages (EMA). I’ll break down the specific MAs I'm using in a follow-up post, but for now, I want to highlight what the moving average structure is showing us right now — and how it compares to similar price action in the past.
Take a look at the yellow arrows on the chart:
The arrow on the right marks the current price position relative to the moving averages.
The arrow on the left points to a similar setup from the past.
As the old saying goes: “History doesn’t repeat itself, but it often rhymes.”
The last time DOGEUSD price action sat in this zone, we saw about 45 to 50 days of consolidation and chop before the market broke into a strong parabolic move higher. Projecting that same timeframe forward puts us somewhere around mid-June.
While nothing is guaranteed in the markets, this chart suggests that accumulation around this zone could present a favorable risk-reward setup for a potential run in the near to mid-term.
My Approach:
I began accumulating a position today and plan to add on pullbacks if the opportunity presents itself.
As always, this is not financial advice — just sharing my personal outlook and strategy. Wishing you all success out there — stay patient, stay sharp.
Fractal

With Last Trading Week Indecision Next Week Will be BIG for GoldGold shows indecision after the close of trading hours for last week, and with the long sellers' wick exhibited on the candlestick, XAUUSD will require a huge geopolitical uncertainty news for price to continue to rise. A further rejection will drag gold's price to its mean.
N.B!
- XAUUSD price might not follow the drawn lines . Actual price movements may likely differ from the forecast.
- Let emotions and sentiments work for you
- ALWAYS Use Proper Risk Management In Your Trades
#gold
#xauusd

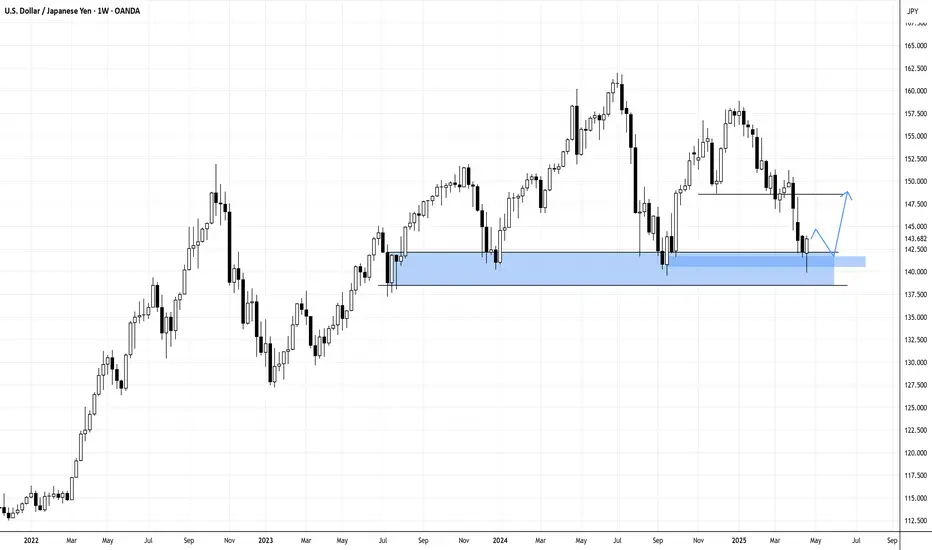
USDJPY Weekly Rejection at Support-Revisit Bearish Order Block?USDJPY pair last trading week got rejected at the same level that the pair has previously acted as a support level. Will this rejection cause USDJPY to rally towards a bearish order block above 147.50?
Risk Zones: 146.50
N.B!
- USDJPY price might not follow the drawn lines . Actual price movements may likely differ from the forecast.
- Let emotions and sentiments work for you
- ALWAYS Use Proper Risk Management In Your Trades
#usdjpy
#usd
#jpy
XAUUSD (Gold) - ICT AnalysisI'm currently looking for higher levels on Gold,
after we reversed from a Daily IRL zone and printed a clear 1H structure shift.
Price just rejected from a 4H IRL, and my first target is the 4H ERL,
which is already marked on the chart.
Watching price action closely for continuation confirmation.

GBPUSD AnalysisGBP could potentially start its next bearish leg from the current level.
Price has reacted off a lower timeframe IFVG, which is currently acting as support.
If we get a clean close below this IFVG, along with proper short confirmation,
I'll be looking for bearish setups to target lower levels

$BTC Tracks $GOLD Very Closely With 12-Week LeadCould it really be this simple?
Maybe we can just throw Global M2 out the window and track TVC:GOLD with a 12-Week Lead.
Someone pointed this out to me yesterday when I posted Gold's near 1/1 tracking with Global M2.
*Note the deviation in CRYPTOCAP:BTC PA from the ETF hype.

longLong level. Looking pretty good by feel. I just feel that long bitch. I visualise and it happens.
Feels good winning.

$GOLD Continues to Move in Lockstep With Global M2It's amazing how accurate TVC:GOLD follows Global M2 with NO LEAD.
Near instant liquidity injection into the asset as the money supply rises 🪙
I do not see the price of Gold falling until Global M2 does.

GBPUSD Analysis with ICT ConceptsMy current outlook on the British Pound is bearish, with an expectation of lower levels in the near term.
A key level I am anticipating price to reach is the Weekly Open, which has not yet been touched.
Yesterday's price action seems to be confirming this potential move towards the Weekly Open.
Therefore, I am actively looking for confirmed short position opportunities to align with this view.
Trade safe!

SUI Long-Term H&S: Epic Crash Ahead?
SUI daily chart paints a clean Head and Shoulders pattern, pointing to a massive drop to around $0.83 by late Summer. As a fractal, this model also aligns with the trough-to-trough cycle from October 2023 to August 2024.
What do we think?

ZkSync Main Trend. L2 for ETH. $458 million funds 21 02 2025Logarithm. Time frame 3 days.
🟢Reversal zone. At the moment, there is a fractal repetition with the previous reversal zone. The logic and key local levels on which the direction of the secondary trend will depend are shown with arrows.
🔴Also showed the range and future levels of an unlikely extremely negative scenario. That is, a breakthrough of the long stop collection zone of a large squeeze (this happens very rarely, since it is irrational, but since in the news background earlier during the listing - funds of 458 million investments, then why not) and the formation of a capitulation channel under the channel with a full range (hold the chart and pull it down), or only from its median (dotted, more likely if we go this way).
Also, regardless of the implementation of scenario 1 or 2, the maximums of this cycle are shown (hold the chart and pull it up). Or rather, the zone. The percentage itself will be different, the "levels" of the zone, most likely, will not.

Will Nasdaq Test Liquidity at 17,800 Before an Upside Move?NASDAQ is experiencing bearish slow down at the support level for the past 3 weeks. A re-test of the recent low looks imminent. and if price could be rejected after clearing H4 liquidity at 17,800, then we could see a sharp upside move.
Key risks: Fed commentary, major tech earnings, and geopolitical headlines.
N.B!
- NASDAQ price might not follow the drawn lines . Actual price movements may likely differ from the forecast.
- Let emotions and sentiments work for you
- ALWAYS Use Proper Risk Management In Your Trades
#nq!
#nasdaq

PLTR: Fibonacci Fractal MappingA quick work on identification of key pattens and Mapping its intrinsic rhythm with Fibonacci Ratios.
Pattern I
Fib Mapping Pattern I
Validation of Pattern I: Match in frequency of cycles within patterns
Pattern II
Validation of Pattern II: Match in frequency of cycles

Global M2 MONEY SUPPLY VS GLOBAL LIQUIDITYWhich is the best to track ₿itcoin price action?
Lots of macro gurus have been arguing over the two.
For comparison, I have indexes for both metrics on a 12-Week Lead, tracking the 4 largest central banks:
The Federal Reserve (including TGA & RRP), People’s Bank of China, European Central Bank and Bank of Japan.
Let’s start by defining each.
Global M2 Money Supply covers physical cash in circulation and cash equivalents such as checking and savings deposits, as well as money market securities.
Global Liquidity covers a broader measure of liquid assets driven by central bank balance sheets, private sector financial activity (e.g., lending, corporate cash), and cross-border capital flows.
Historically, both move closely in lock-step and act as a great leading indicator for ₿itcoin, however we can see that Global Liquidity can have more drastic fluctuations.
We saw a large divergence in CRYPTOCAP:BTC PA with both metrics when the Blackrock iShares ₿itcoin ETF appeared on the DTCC list, a procedural step signaling progress toward potential approval.
When you look at the charts of all three, you can see there are points where either metric might follow CRYPTOCAP:BTC PA a bit closer, so in the end I would say it’s best to track both to find confluence in the signal.

GLD/SPX as a risk-off signal for BTC/SPXFor all the "Bitcoin will follow gold" crowd...
This chart tells a very different story.
Every time we’ve seen GLD/SPX rally sharply, BTC/SPX has underperformed for months afterward.
📉 See the shaded red zones – they highlight periods when:
GLD/SPX (gold line) made strong relative moves,
BTC/SPX (aqua line) lagged or outright dropped.
We're in another one of those zones right now.
Unless you’ve got a strong reason why "this time is different," the base case is clear:
BTC/SPX likely underperforms for another 3–6 months.
If you're positioning long BTC expecting it to mimic gold's run, be aware — that hasn't played out well historically.
🧭 Trade Idea:
Patience: Don't rush the BTC long. Let the GLD/SPX spike play out.
Timeframe: Revisit BTC/SPX for potential re-entry mid-to-late 2025.

$ETH = Silver and $BTC = Gold Means WHAT!?They say Ethereum is the Silver to ₿itcoin being Gold.
If that's the case, does that mean that the ceiling for CRYPTOCAP:ETH will forever be stuck at $4,800
just like TVC:SILVER being capped at $48 for the past 45 years?
Does anyone really think ETH will be higher than $4,800 in 45 years???😆
A true store of value 💯

Tesla Long Longseems like we are done with those lower prices; this week´s target is $305.
as you can see the SL and TP
GL

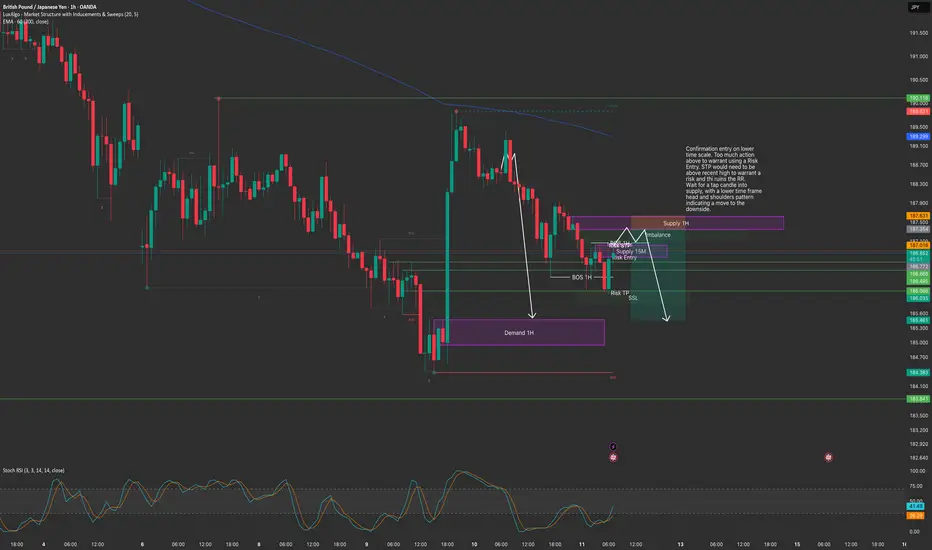
SHORT GBPJPY from 1H supplyThere was a risk entry on the 15M chart which may yet play out but if it breaks to the upside I expect it to return to the 1H supply zone marked ready to take out the remaining imbalance below with the news candle from Weds evening.
We're still in a downtrend but I suspect with the news of tariffs being paused for the next 90 days there may be a rally, would only confirm an uptrend once its broken that upward move from the weds evening.
SPX: Market Reflexivity & Fractal PatternsIn this idea I would like to walk you through some principles which I use to find and relate historical complexities within rhyming cycles.
Market Reflexivity
Market reflexivity is a concept introduced by George Soros that defies the traditional TA notion of efficient markets by revealing that price movements do not merely reflect fundamentals — they actively shape them. As prices rise, optimism fuels further buying, creating a self-reinforcing loop inflating bubbles. Conversely, declining prices trigger fear, accelerating downturns. Reflexivity explains why trends persist and why reversals can be abrupt, as self-sustaining cycles eventually reach a exhaustion point.
To put it simply, there is a feedback loop between market participants’ perceptions and actual market conditions, suggesting that financial markets are not always in equilibrium because collective investor behavior actively drives price movements, which in turn influences future investor behavior.
Feedback Loops
Each massive rally eventually creates conditions that lead to overvaluation, resulting in sharp corrections.
Self-Fulfilling Expectations
Market participants, reacting to past price behavior, reinforce trends until a breaking point.
Structural Adaptation
Every major correction resets valuations, allowing for the next cycle to begin with renewed confidence and capital inflows.
Practical Application of Reflexivity
Compared to many tickers, SPX has exhibited relatively stable growth throughout history. Over the past 70 years, the most significant panic-driven decline occurred after its 2007 peak, with a 57% drop that defined a major cycle. Growth resumed in 2009, making this swing a key reference point for establishing historical relationships.
I see the Dotcom and Housing crisis-induced declines as part of a broader complexity, shaped by prior long-term growth. The two cycles appear as they do because they stem from an extended structural uptrend, not just the 250% surge from 1994 to the bubble top, which lacked a significant preceding decline. Cause-and-effect logic suggests that these crashes were a reaction to a much larger uptrend that began in 1974. A 2447% rally provides a more compelling reason for mass panic and selling, as corrections of such magnitude are rare.
Intuitively, the 2447% long-term upswing should have been preceded by a decline similar to the Dotcom and Housing crashes. This holds true, as the market experienced a nearly 50% drop after peaking in 1973 and 37% in 1968, following the same cyclical pattern of deep corrections leading to extended expansions. These corrections were relatively smaller than the Dotcom and Housing crashes because they are followed by a comparatively smaller 1452% rally from the end of WWII.
Multi-Fractals
Multifractals in market analysis describe the non-linear, self-similar nature of price movements, where volatility and risk vary across different scales. Unlike simple fractals with a constant fractal dimension, multifractals exhibit multiple fractal dimensions, creating varying levels of roughness. Benoit Mandelbrot introduced multifractal Time Series to refine the classic random walk theory, recognizing that price movements occur in bursts of volatility followed by calm periods. Instead of a single Hurst exponent, markets display a spectrum of exponents, reflecting diverse scaling behaviors and explaining why price action appears random at times but reveals structured patterns over different time horizons.
This justifies viewing price action within its structural cause-and-effect framework, where micro and macro cycles are interdependent, while oscillating at different frequencies. Therefore, we will apply the building blocks independently from boundaries of Full Fractal Cycle.
Since volatility varies, this reserves us the right to extract patterns with identical slope and roughness, and by method of exclusion relate to recent cycles starting from covid.

Arbitrum ARB price analysis💰 One can lose count of how many times the “next bottom” from #ARB has been given as "a gift".
⁉️ The only thing that can be assumed is that the behavior of the #Arbitrum price will repeat itself in a fractal fashion and grow to at least $0.57-0.67 by summer.
🪐 And then, if all the stars align with the parade of planets, and the OKX:ARBUSDT price will be able to gain a foothold above the aforementioned zone, it may continue to grow to $1-1.2.
It seems that once upon a time, this was the price at which #ARB was given away for free, and they forgot to think through one nuance: who will be pumping it if they are generously given to everyone)
_____________________
Did you like our analysis? Leave a comment, like, and follow to get more

PEG @ 0.22 DEBT/ASSET @ 0.09 NVIDIA LOOKS CHEAP WITH SELL-OFFFundamental metrics favour NVIDIA and with the company's return on equity (ROE) stands above 119%, NVDA stock price looks irresistible below 105.
N.B!
- NVDA price might not follow the drawn lines . Actual price movements may likely differ from the forecast.
- Let emotions and sentiments work for you
- ALWAYS Use Proper Risk Management In Your Trades
#nvda
#nasdaq
#nyse

Xauusd/M15The 4-hour structure of global gold has turned bearish, and after the structural break, as expected, we observed a pullback to higher levels. Currently, the price has entered an important price zone, and if it is not influenced by specific news, we can expect a price reversal from this range and see further decline. Therefore, depending on the trading style you follow, after observing a trigger, you can enter sell trades.

Can $DOGE Still Leapfrog $BTC...?The original thesis has not yet been invalidated, only pushed farther into the future.
The historical pattern is still there, and the reversal is part of it.
Does that mean DOGE will definitely flip BTC to the extreme upside?
Not necessarily.
But the two hypothetical trend lines will not validate/invalidate until DOGE begins to flip BTC more aggressively.
Then we'll know for sure by how much it flips BTC.
DYOR, STFU, Praise the Lord, and Pass the Ammunition.
