EUR GBP clear as dayIf you can not see how strong the support at 0.87310 is then you should really go away and learn some more.
We are looking for price to re test this price and bounce, we can see a good level of resistance at 0.89282 which again may act act as a wall and bounce, but we will keep a close eye on this pairing if it did try and test this resistance level.
To sum it up we can see price moving further to the downside.
This pairing will experience quiet a lot of volatility as key brexit votes take place this week, but we are using that to our advantage.
Remember to use correct risk management.
Freemoney

GBP USD hitting old resistanceAs you can see from our arrows on the 4h chart that price has touched 1.28802 a number of 17 times just in this chart, this is classed as strong resistance and not to be ignored.
The current 4h candle that is forming is hovering around this resistance level at the moment and has already touched this level and retraced a little, this gives us an indication that it may be used as resistance yet again.
Now we have stated before that there is no need to wait for confirmation candles at such key levels as you may miss out on a good opportunity, so we are in this trade but with a tight SL.
We are looking at further downside movement to around the 1.26230 level and could even break and test 1.25362 support, but remember don't get too greedy when trading as the market will eat you alive!
And ALWAYS use correct RISK MANAGEMENT.

GOLD where the big players set ordersMarked on the chart you can see some key levels 1356.478 ( resistance ) 1297.420 ( resistance ) and 1182.906 ( support )
You can see that price has touched and bounced off these levels 10+ times each, why do you think this is? this is because the big banks and the big players in the game set orders at these levels ( big amounts of money ) this will make the market move in the direction they want ( manipulating the market )
Now if we can identify these key levels that the big players are getting in the trades then we too can benefit from these, this is all we need key levels of support and resistance! Because if you spot these levels but wait for candlestick confirmation they you will probably miss the trade and loose out as the big players would have made there money and pulled out.
Keep an eye out for these key levels, and remember the HIGHER the chart timeframe the more RELIABLE the support or resistance level will be.

EUR USD bears continueBears are strong with this pairing, we can see further downside movement as far as 1.13075 support level, price bounced off key resistance at 1.14039 and is ready to sink.
We could see some support at 1.13470 that has been used as support and resistance before, but this should only be a slight pullback which will provide good opportunities to add sell positions.
Remember only use our analysis if it lines up with your own analysis, and always use correct risk management.

EURJPY 1HForeverFX Here With Our First Analyses; Please Be So Kind And To Give Us Some Love. Support & Resistance Levels are shown and if you place this trade I hope you enjoy, Yen news is out Thursday and it's looking positive for the interest. We are predicting a strong Yen of 2019 the year of the emerging markets! Especially when the Olympics is hosted there. That's not all too relevant as this is on the 1H timeframe, though. Something definitely to take into consideration though.

FB: mid term bear market preparationI don't like the situation around facebook, I don't like their model and the fact they attempted to lie about it, and they are already behind the market as far as performance. They focused too much on cashing in early and didn't listen to their consumers and Instagram is pushing forward.
I have FB at 73.21 inside 6 - 8 months.
156.43 was the acceptable bottom from the technical bullish setup we saw late October, and this is why we go on technical stops and play patient in the overview.

AMZN: mid term bear market preparationThe RSI indicates the potential for a bottom attempt. This TA matches the supp/res shown as 1339.7 is our pivot point in the overview. Below the 1339.7 support we would expect quick movement towards 856.2 and in the worse case parabolic movement we should expect a bottom around 695.06.

AAPL, mid term bear market preparationMore than likely we will have movement down towards 100.46 support. With the present technicals, and our new understanding of moving averages, we are preparing for a much larger move to the downside over the next 6 - 18 months

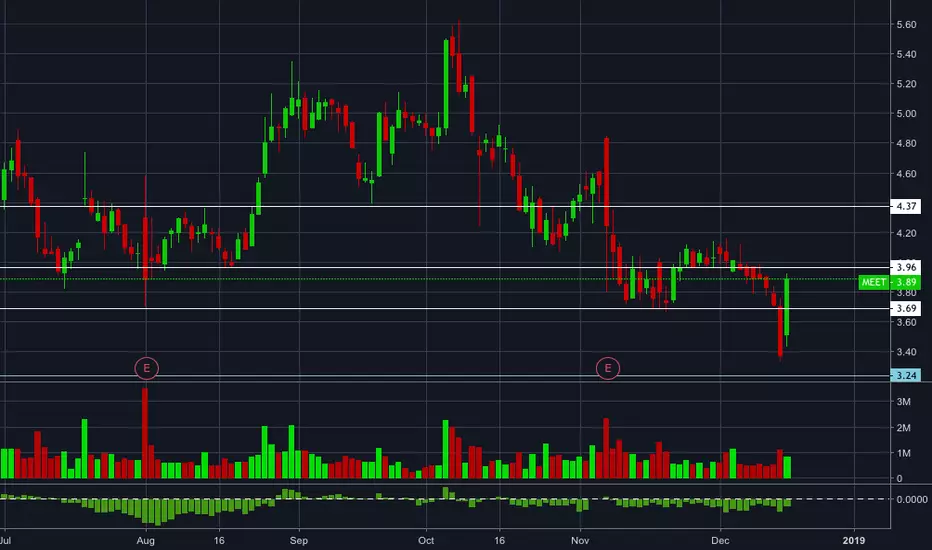
MEET; channel overlap b/o possibleAn excellent question by our member @Jabda#8321 on MEET
We see a channel from 3.24 - 3.96 with an overlapping channel at 3.69 - 4.37
as this is being played now it's attempting to reclaim the mid range of the first channel or the bottom of the second at 3.69, either way this looks strong for a continuation above 4.01 (the 200ema from the daily)
We are in play long above 3.69 :D
EUR/USD KEY LEVELSwaiting for confirmation to enter next position, got a decent profit off a little dead cat bounce on this support level, but if this level doesn't hold then i'm looking to enter big shorts at next little rally

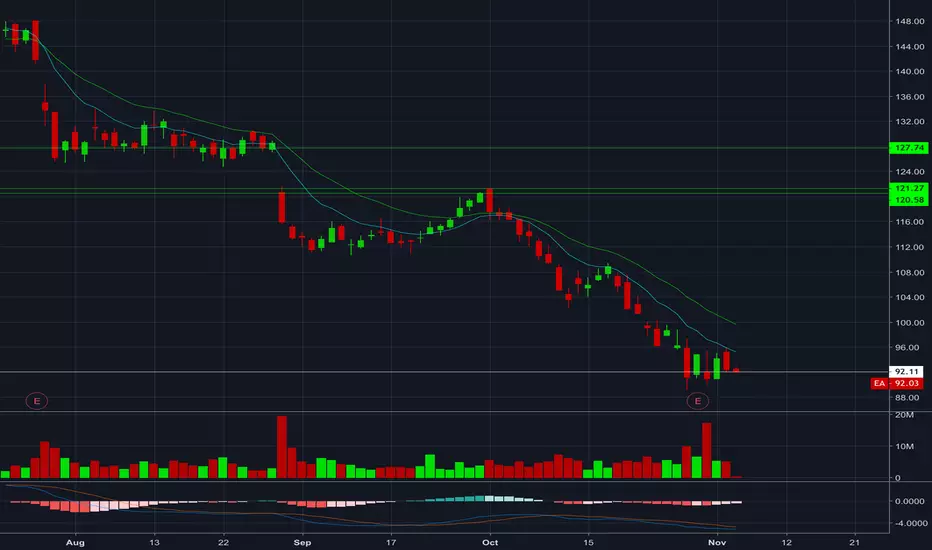
EA; get your head in the gameEA like many others, is lining up for a much larger pullback. We will watch 92.11 to act as support and if this fails we will expect a gap further down to test support 77.22. Great entries before this gap down team. Don't miss out on this profit.
Facebook pullback to continueWith the bear market looming and a weak close overall on Friday, I will be watching for FB to continue to pullback as this descending wedge confirms in the coming week. The key level we are watching here is the 150.75.


Altcoin selection, Day #2: MCOBTCI selected this coin from two reasons. I dont want to hold unused bitcoin on exchanges and second, it looks like something is going on silently in the back. Altho the BINANCE:MCOBTC is relatively expensive, I alway like invest in coins based in asia. and the drop already happened. If we take into the considsration, that BITSTAMP:BTCUSD price drop didnt affect price of BINANCE:MCOBTC at all, I am looking forward to first correction UP. I hope you catch some good entries and dont be foolish when holding the positions.

IBM - FREE MONEY!Dear Traders,
IBM has struck a deal to acquire cloud software company Red Hat for $34 billion.
IBM will pay $190 per share for the software company, which it described as the world’s leading provider of open source cloud software, a more than 60% premium to Red Hat’s closing stock price of $116.68 on Friday. Shares traded upwards of $175 in June, but disappointing earnings combined with a volatile market had seen the price drop sharply.
Here are the key points from the deal announcement:
IBM will acquire all of the issued and outstanding common shares of Red Hat for $190.00 per share in cash, representing a total enterprise value of approximately $34 billion.
JPMorgan advised IBM on the deal and provided most of the financing. Guggenheim Partners represented Red Hat on the deal.
IBM will remain committed to Red Hat’s open governance, open source contributions, participation in the open source community and development model, and fostering its widespread developer ecosystem.
IBM and Red Hat also will continue to build and enhance Red Hat partnerships, including those with major cloud providers, such as Amazon Web Services, Microsoft Azure, Google Cloud, Alibaba and more, in addition to the IBM Cloud.
Red Hat will join IBM’s Hybrid Cloud team as a distinct unit, preserving the independence and neutrality of Red Hat’s open source development heritage and commitment, current product portfolio and go-to-market strategy, and unique development culture.
Red Hat will continue to be led by Jim Whitehurst and Red Hat’s current management team. Jim Whitehurst also will join IBM’s senior management team and report to Ginni Rometty. IBM intends to maintain Red Hat’s headquarters, facilities, brands and practices.
“IBM will become the world’s #1 hybrid cloud provider, offering companies the only open cloud solution that will unlock the full value of the cloud for their businesses,” Ginni Rometty, IBM chairman and CEO, said.
“Joining forces with IBM will provide us with a greater level of scale, resources and capabilities to accelerate the impact of open source as the basis for digital transformation and bring Red Hat to an even wider audience – all while preserving our unique culture and unwavering commitment to open source innovation,” Jim Whitehurst, president and CEO of Red Hat, said.
Let's talk about TA now:
Weekly RSI is OVERSOLD !
Daily looks superrr zweeeeet! I see a possible divergence!
Hourly chart confirms my Bullish Divergence.
This is free money.
Key resistance points: 132$ - 145$


SQ Fib Price Targets for 2018SQ looks to have found support after a HEALTHY retracement. I will look to add some shares to my longer term accounts as well as take advantage of some nice Intra day setups.

BTC Bearish BreakdownIf the current daily closes below the 200 EMA (red) and lower EMA (orange) Ill look for the the $7400 level to be met this week. This zone as well aligns with the .618 FIB retracement. If the blue zone is broken the lower daily trend line should provide an additional support level. Once these levels are reached I will come back to reassess the lower targets if the downwards pressure continues. For now all eyes are on where the current session closes.

BTC Short Term AnalysisSeems to me the upcoming hours will dictate the short term direction. If we can get a closure above the upper trend line in the current wedge Ill look for the .786 fib level to be fulfilled. (Daily fib retracement from $5,850 to $$10,000) I agree that this would be a quick higher high, trapping all the noobs, before reversing lower. However as indicated by the .618 Fib this is a reasonable place for us to reverse lower, with no need for a higher high. If the lower Trend line is taken out and the $7800 support region is then violated itll confirm the reversal IMO.

0x Scalp Trade AnalysisZRX has been consolidating over the recent days within the $1-$1.2 channel. Market Contractions lead to market expansions. ZRX has had lots of buying over the past 24 Hrs on most exchanges which is being reflected on the current charts. Im expecting an increase in volatility as we are testing the upper trendline resistance on the daily, which has applied pressure to the downside. I am looking for a break through in the following hours/days which would lead to another meeting of the $1.35 region where we wicked to priorly. Once this region is fulfilled I will watch for a continuation to the upside to the $1.50 level. Not only Is this a resistance level on the daily but it also aligns with the 200% FIb target. At this level I will look to take some short term profits and look to buy back at a lower level.

BTC Bullish short TermAfter bouncing from the $6000 supply zone and coming back into the $6800 resistance last week. BTC retraced to the 61.8% fib support level and formed a lower low respecting the Head and Shoulders pattern. As well creating a cross over on the daily moving averages. Last night BTC broke through the neckline resistance level resulting in a surge through the prior $6,800 resistance level. It has now met my upper .618 target. But with the current bullish momentum I believe that will not stop it. I am now looking for the $7,800 resistance level to be fulfilled in the short term which as well aligns with the daily 200 EMA (red). Once this level is met I will not be suprised if BTC is snapped back down to the lower levels once again.

BTC Bottom? In my opinion with the recent bearish move down to the key $6500 level and now proceeding towards $6,000. IF the bearish momentum continues I believe the $6,000 price region followed by $5,500 level will be met. Which align with my 2.382(red) and 2.618(green) Fib targets. As well if you check the daily RSI levels...BTC has bounced with precision at the <30% level previously. If the pressure continues on BTC to these lower levels I believe that would force the institutional shorts to cover their positions (to take profits) and activate a bull run.

