EUR/JPY Channel Formation (6.08.2025) The EUR/JPY Pair on the M30 timeframe presents a Potential Selling Opportunity due to a recent Formation of a Channel Pattern. This suggests a shift in momentum towards the downside in the coming hours.
Possible Short Trade:
Entry: Consider Entering A Short Position around Trendline Of The Pattern.
Target Levels:
1st Support – 169.74
2nd Support – 169.25
🎁 Please hit the like button and
🎁 Leave a comment to support for My Post !
Your likes and comments are incredibly motivating and will encourage me to share more analysis with you.
Best Regards, KABHI_TA_TRADING
Thank you.
Disclosure: I am part of Trade Nation's Influencer program and receive a monthly fee for using their TradingView charts in my analysis.
Fundamental-analysis

EUR/USD - Bearish Outlook (05.08.2025)The EUR/USD Pair on the H4 timeframe presents a Potential Selling Opportunity due to a recent Formation of a Bearish Flag Pattern. This suggests a shift in momentum towards the downside in the coming Days.
Possible Short Trade:
Entry: Consider Entering A Short Position around Trendline Of The Pattern.
Target Levels:
1st Support – 1.1400
2nd Support – 1.1300
🎁 Please hit the like button and
🎁 Leave a comment to support for My Post !
Your likes and comments are incredibly motivating and will encourage me to share more analysis with you.
Best Regards, KABHI_TA_TRADING
Thank you.
Disclosure: I am part of Trade Nation's Influencer program and receive a monthly fee for using their TradingView charts in my analysis.

NZD/CAD - Triangle Breakout (05.08.2025)The NZD/CAD Pair on the M30 timeframe presents a Potential Selling Opportunity due to a recent Formation of a Triangle Breakout Pattern. This suggests a shift in momentum towards the downside in the coming hours.
Possible Short Trade:
Entry: Consider Entering A Short Position around Trendline Of The Pattern.
Target Levels:
1st Support – 0.8096
2nd Support – 0.8087
🎁 Please hit the like button and
🎁 Leave a comment to support for My Post !
Your likes and comments are incredibly motivating and will encourage me to share more analysis with you.
Best Regards, KABHI_TA_TRADING
Thank you.
Disclosure: I am part of Trade Nation's Influencer program and receive a monthly fee for using their TradingView charts in my analysis.


Fundamental Market Analysis for August 6, 2025 GBPUSDSterling stays on the back foot ahead of tomorrow’s Bank of England decision: consensus expects the Bank Rate to be held at 5.25 percent, but markets price only one or two modest cuts by year-end as inflation has slowed to 2.6 percent while June retail sales fell 0.9 percent m/m.
Additional pressure stems from fiscal concerns: the UK Treasury warned that GBP 4 billion of spending cuts will be needed in 2026 to keep the deficit at the 3 percent-of-GDP target, stoking stagflation fears and capping the pound’s upside.
The dollar is buoyed by inflows into US yield assets: the 10-year Treasury yield has climbed to 4.47 percent, widening the spread over 10-year gilts to 155 basis points—historically associated with GBPUSD weakness.
Trading Recommendation: SELL 1.32850, SL 1.33050, TP 1.31800

THE CHART DOESN'T LIE: A NEW DAWN FOR ETHEREUM
🔍 TECHNICAL ANALYSIS
1. The long-term downtrend , which lasted approximately 3.5 years, has been **broken on the monthly chart**, signaling a confirmed breakout (BO).
2. The horizontal resistance level at 4045 USDT is a critical zone. This is expected to act as the next stop following the breakout. A clear breach of this level could potentially lead to **more aggressive upward movements**.
Note: We do not consider the all-time high at 4631 USDT to be a major resistance, as it previously acted not as a strong sell zone but rather as a **momentum acceleration point**. With the entry of new investors and resulting FOMO (Fear of Missing Out), we anticipate minimal resistance around this level.
3. Since its launch in 2016, the **MACD indicator** has issued three **buy signals** on the monthly timeframe:
* Two resulted in strong bull runs .
* One led to a ** 60% rally **.
* Currently, a new bullish crossover is forming.
4. The RSI indicator has historically provided clear insight into when rallies may begin to slow. In particular, the 88 level and above has marked overbought territory, which could be a suitable area for gradual profit-taking .
5. Important Fibonacci-based accumulation zones are located between 3262 and 2697 USDT.
🧠 FUNDAMENTAL ANALYSIS
1. Smart Contracts
Ethereum is a programmable blockchain that enables the execution of smart contracts—automated agreements without intermediaries.
🧠 Example: “If Team A wins, send payment automatically.”
2. Decentralized Application Platform (dApps)
Ethereum empowers developers to build dApps whose data is stored across the network, not on centralized servers—making it resistant to censorship.
3. Foundation of DeFi and NFT Ecosystems
* Most DeFi platforms (lending, staking, earning interest) are built on Ethereum.
* Roughly 80% of NFTs originated on Ethereum (OpenSea, Bored Ape, CryptoPunks, etc.).
4. Approval of Spot Ethereum ETFs (U.S.)
* Following Bitcoin ETFs, some Ethereum spot ETFs have been approved.
* This has **opened the door to institutional investment**, creating **upward price pressure**.
5. ETH 2.0 Upgrade & Staking
* Ethereum transitioned from Proof of Work to Proof of Stake, making the network more sustainable and scalable.
* Users can now stake ETH to earn passive income.
6. Enterprise Adoption
* Corporations such as Visa and JPMorgan are testing Ethereum’s infrastructure.
* Use cases: payments, data storage, contract management.
7. Favorable Regulatory Shifts Support Altcoins
* U.S. laws like GENIUS and CLARITY have laid a framework for stablecoins.
* This has increased institutional interest in **infrastructure coins** like Ethereum and Solana.
8. Capital Rotation into Altcoins
* While Bitcoin consolidates between \$115K–\$118K, capital is flowing into altcoins.
* Tokens like XRP, DOGE, BONK, PEPE, HYPE have surged.
* XRP is particularly favored due to its enterprise use case, with price targets of \$4–\$6 being speculated.
9. Growth in Futures and Institutional Trading
* CME Group data shows growing open interest in Solana and XRP futures.
* ETH farms also reflect strong institutional interest, as companies begin to hold crypto assets under treasury models.
10. Risks to Monitor
* Potential downward pressure may come from **Fed rate decisions**, **ETF inflows/outflows**, *miner selling, or regulatory actions (e.g., MiCA).
* Altcoins remain volatile and sensitive to regulation.
💹 IN SUMMARY – Key Accumulation Zone:
3262 – 2697 USDT
We haven't provided detailed Ethereum analysis in a while, as both technical and fundamental structures often require time to form. In short: not all assets are worth analyzing until they are.
"Wealth does not come from the number of trades, but from the patience to wait for the right trade." – Bull Investment
⚠️ DISCLAIMER:
Maintain proper capital and risk management to protect your psychology during market corrections.
This analysis is for educational purposes only and does not constitute financial advice. Making decisions based on this commentary may lead to losses.
Avoid following unverified tips and rumors.

Fundamental Market Analysis for August 5, 2025 EURUSDEvent to pay attention to today:
17:00 EET. USD - ISM Services PMI
EUR/USD continues to fall for the second day in a row, trading around 1.1560 during Tuesday's Asian session. The pair is devaluing amid the strengthening of the US dollar (USD) due to caution among traders caused by recent events in global trade and changes in expectations regarding monetary policy.
Market sentiment is becoming cautious due to growing concerns about the independence of the Federal Reserve (Fed). On Monday, Fed board member Adriana Kugler unexpectedly resigned. This event gave US President Donald Trump the opportunity to influence the central bank earlier than expected.
However, the US dollar may face difficulties amid growing chances of an interest rate cut by the US Federal Reserve (Fed) in September after weak labor market data reinforced concerns about the US economic outlook. Markets estimate the probability of a Federal Reserve rate cut next month at 91.6%.
By comparison, the European Central Bank (ECB) is expected to keep rates unchanged, as annual inflation in the eurozone remained at 2.0% in July, slightly above the forecast of 1.9%. Meanwhile, traders are cautious amid the introduction of 15% US tariffs on goods imported from the European Union (EU).
Trade recommendation: BUY 1.1580, SL 1.1500, TP 1.1685

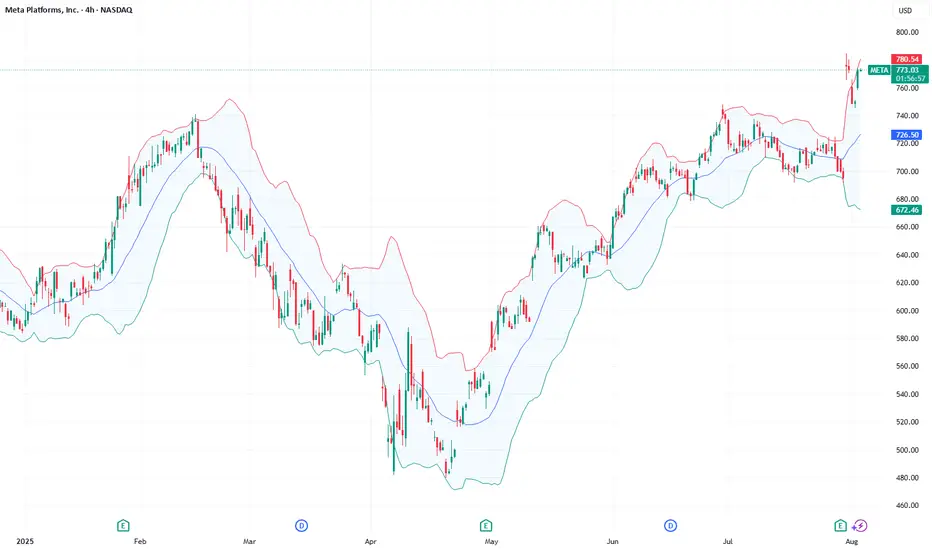
Microsoft, Meta, Nvidia — Lifting Off in the AI MarketThe “Big Three” are breaking new records: #Facebook (Meta) surged to $784.39 as AI-powered targeting tools pushed ad revenues higher, #Microsoft hit $551.10 by combining rapid Azure growth with new monetization from Copilot across its ecosystem, and # Nvidia climbed to a record $183.21, driven by unwavering demand for AI computing.
Key growth drivers:
#Facebook (Meta): Markets welcomed strong ad revenue projections, outweighing concerns about capex. AI tools for ad targeting significantly improved performance.
#Microsoft: Azure’s YoY growth reached ~39%, Copilot crossed 100M monthly users, and the company committed up to $30B in upcoming AI infrastructure.
#Nvidia: Persistent demand for AI GPUs and networking gear from hyperscalers, plus a $4T valuation milestone, keeps momentum strong.
What’s fueling continued upside:
#Facebook (Meta): AI tools like Advantage+ improve audience targeting and ad creatives, while Reels and recommendation feeds increase impressions and eCPM. Large-scale investment in data centers and in-house AI models open new monetization paths. Stable rate expectations also favor growth stocks like META.
#Microsoft: Growth is driven by Azure’s ongoing expansion (~39% YoY), the second wave of cloud migration, and strong monetization via Microsoft 365 and GitHub Copilot. A $30B capex plan will expand data center capacity. A broad portfolio — Windows, Office, Gaming — supports steady margins.
#Nvidia: The AI compute supercycle is in full swing. Demand for H-series GPUs and InfiniBand networks exceeds supply. The clear upgrade roadmap (H200/Blackwell) extends through 2026, while CUDA ecosystem expansion strengthens customer lock-in. Strong cash flow and record valuation support M&A, buybacks, and accelerated development.
According to FreshForex , current price levels make #Meta and #Microsoft attractive for long positions. #Nvidia offers room for both upside and pullbacks, depending on news flow.
Fundamental Market Analysis for August 4, 2025 USDJPYAfter Friday’s weak U.S. jobs report, USD/JPY fell sharply, breaking below 150. At the start of the new week the pair stabilized around 147–148, yet the fundamental backdrop remains tilted against the dollar: expectations for Fed cuts in the coming months are weighing on U.S. yields and narrowing the U.S.–Japan yield spread—the primary long-run driver of USD/JPY.
Exclusive for our readers – a 202% bonus on deposits of $202 or more! Give the promo code PROFIT202 to customer support and start trading with TRIPLED capital. Full promo details are available via the link.
The Bank of Japan continues an ultra-loose stance, with forecasts showing inflation around target but little appetite for aggressive tightening in the near term. That leaves the main channel of yen support tied to U.S. yield dynamics and global demand for safe-haven assets. With softer U.S. yields and elevated U.S. political uncertainty, demand for defensive currencies may stay resilient.
Additional risk factors include commentary from Japan’s Ministry of Finance regarding the yen and potential bouts of volatility around Fed communications and incoming U.S. data. Today’s base case favors selling USD/JPY on corrective upticks toward 146, as pressure from lower U.S. yields persists.
Trade idea: SELL 147.550, SL 148.550, TP 146.050

GBP/CAD - H4 - Bearish Flag (26.07.2025)The GBP/CAD Pair on the H4 timeframe presents a Potential Selling Opportunity due to a recent Formation of a Bearish Flag Pattern. This suggests a shift in momentum towards the downside in the coming Days.
Possible Short Trade:
Entry: Consider Entering A Short Position around Trendline Of The Pattern.
Target Levels:
1st Support – 1.8242
2nd Support – 1.8139
🎁 Please hit the like button and
🎁 Leave a comment to support for My Post !
Your likes and comments are incredibly motivating and will encourage me to share more analysis with you.
Best Regards, KABHI_TA_TRADING
Thank you.
Disclosure: I am part of Trade Nation's Influencer program and receive a monthly fee for using their TradingView charts in my analysis.

IONQ: is it the time to secure IonQ position ?Next week we will have some quantum computing stocks that announce earnings results, so will see if it the time to secure this position. Noting that this is a very long-term position, the company still not profitable yet.
Disclaimer: This content is NOT a financial advise, it is for educational purpose only.

NZDJPY – Bearish Momentum BuildingPair: NZDJPY
Timeframe: 4H
Bias: Bearish
🔍 Technical Setup:
NZDJPY has broken sharply from its recent consolidation and is now testing a critical 4H support zone near 87.00. A decisive break below this zone would open the path toward lower support levels.
📍 Entry Trigger: Break and close below 86.95
🎯 Target 1: 85.95
🛑 Stop Loss: Above 87.35
📉 RSI: Near oversold, confirming strong bearish pressure
This setup reflects a classic bearish continuation with momentum and structure aligned.
🧠 Fundamental + Macro Confluence:
🔻 New Zealand (NZD):
RBNZ cut rates to 3.25% citing weak inflation, growth slowdown, and spare capacity.
Employment data remains fragile; upcoming releases add downside risk.
NZD is under pressure due to falling export demand amid global trade tensions.
CFTC positioning shows longs reducing, net positioning weakening — sentiment turning bearish.
🔺 Japan (JPY):
Bank of Japan is gradually tightening — while still accommodative, the bias is shifting hawkish.
JPY benefits as risk-off sentiment grows — fueled by weak equity markets and rising VIX (20.42).
CFTC shows a massive drop in NNCs, aligning with institutional flows favoring JPY strength.
🌐 Risk Sentiment:
VIX > 20 confirms risk-off sentiment, bolstering safe-haven demand for JPY.
NZD, being a high-beta risk currency, weakens as global risk appetite fades.
Seasonal bias also aligns with weakness in NZD and strength in JPY.
📌 Final Take:
Macro, sentiment, and technicals all align for further downside in NZDJPY. Watch for a clean H4 close below 86.95 to confirm entry. This pair offers strong confluence — from central bank divergence to institutional flows and global volatility.

GBPJPY – Bearish Continuation Setup AheadPair: GBPJPY
Timeframe: 4H
Bias: Bearish
🔍 Technical Overview:
GBPJPY has broken down with high momentum and is now hovering at a 4H support zone (195.30). A clean break and close below this level opens the door for a deeper move toward the next support areas:
Entry Trigger: Break below 195.30
🎯 Target 1: 194.05
🎯 Target 2: 192.50
🛑 Stop Loss: Above 195.95 (previous resistance-turned-supply zone)
📉 RSI: 27.63 (Oversold but momentum-driven selloff suggests more downside)
🧠 Macro + Fundamental Confluence:
🏦 Central Bank Policy:
BOE (Bank of England) cut rates by 25bps (to 4.25%) in a hawkish tone, with internal disagreement (7–2 vote), signaling uncertainty and potential for further divergence.
Despite the “hawkish cut,” the market interpreted it cautiously, especially with falling UK economic momentum and weak retail data.
💴 Bank of Japan:
BoJ is slowly tightening policy — signaling an eventual exit from ultra-loose conditions.
Real interest rates remain negative, but the direction is now incrementally hawkish, strengthening the JPY across the board.
💡 Market Sentiment:
VIX at 20.42 = Risk-Off Environment → capital flows into safe-haven JPY, out of GBP.
With Nasdaq bullish, but volatility ticking up, JPY benefits from its safe-haven role.
📊 CFTC Positioning:
GBP: Longs decreasing, shorts rising, NNCs decreasing → Bearish bias
JPY: Longs flat, but massive drop in NNCs → institutional positioning is turning defensive
🧾 Economic Weakness:
UK Services PMI showing signs of stagnation
CPI and Retail Sales remain weak, suggesting limited scope for further GBP upside
Japan's latest Household Spending and Economy Watchers Survey show stabilizing conditions, supporting yen strength
📌 Final Take:
Fundamentals support the breakdown as monetary divergence and global sentiment drive capital into the JPY. Watch for confirmation via H4 close below 195.30 before entering the trade.
🧭 Trade idea aligns with macro, technicals, seasonality, and institutional flows.

Fundamental Market Analysis for August 1, 2025 GBPUSDThe pound remains under pressure due to the strengthening of the dollar and expectations of further easing of the Bank of England's policy at its meeting on August 7. The regulator's rhetoric in June-July pointed to a “gradual and cautious” course of rate cuts amid weak growth, and the market is pricing in the likelihood of another move at the next meeting. The situation is complicated by the fact that July inflation in Britain unexpectedly accelerated, but the regulator interprets it as a temporary consequence of tariff and price shocks, not wanting to tighten financial conditions excessively.
The external environment is also unfavorable for the GBP: the US has imposed new tariffs on a number of trading partners, strengthening demand for the dollar as a risk-free asset. For the UK, the trade implications are mixed: part of the supply chain is focused on the dollar zone, and industry is sensitive to global demand, which, in the context of prolonged uncertainty, is hitting investment and employment expectations. The risks of a decline in private sector business activity remain elevated.
Today, attention is focused on US employment data: if the labor market confirms its stability, the likelihood of a Fed rate cut in September will decrease further, which will keep the dollar in the ascendancy. All these factors combined create a bearish bias for GBPUSD in the short term, with any brief rebounds from local oversold conditions typically being used for selling.
Trading recommendation: SELL 1.32000, SL 1.32500, TP 1.31000

XAU/USD (Gold) - Triangle Breakout (1.08.2025)The XAU/USD Pair on the M30 timeframe presents a Potential Selling Opportunity due to a recent Formation of a Triangle Breakout Pattern. This suggests a shift in momentum towards the downside in the coming hours.
Possible Short Trade:
Entry: Consider Entering A Short Position around Trendline Of The Pattern.
Target Levels:
1st Support – 3249
2nd Support – 3225
🎁 Please hit the like button and
🎁 Leave a comment to support for My Post !
Your likes and comments are incredibly motivating and will encourage me to share more analysis with you.
Best Regards, KABHI_TA_TRADING
Thank you.
Disclosure: I am part of Trade Nation's Influencer program and receive a monthly fee for using their TradingView charts in my analysis.

DXY USDOLLAR CRASH Incoming!Long-term fundamentals are bearish
Long-term sentiment = bearish
Long-term technicals = bearish
Trump wants a weaker dollar + FED injecting endless amounts of cash into the markets
driving stocks/ gold up, and the dollar down, losing purchasing power.
My plan is to look for shorts on the 1hr-4hr timeframe with lower timeframe confirmation.
Once price starts turning over, day-traders can join in.
Agree or disagree?

FOMC rate decision 30-07-2025FOMC announced no change to interest rate, but the new tariffs is the major player for the upcoming quarter, we shall see its effect on the economy and corporates earnings soon, then the fed can make better judgment whether to lower interest rate or not.
Disclaimer: This content is NOT a financial advise, it is for educational purpose only.

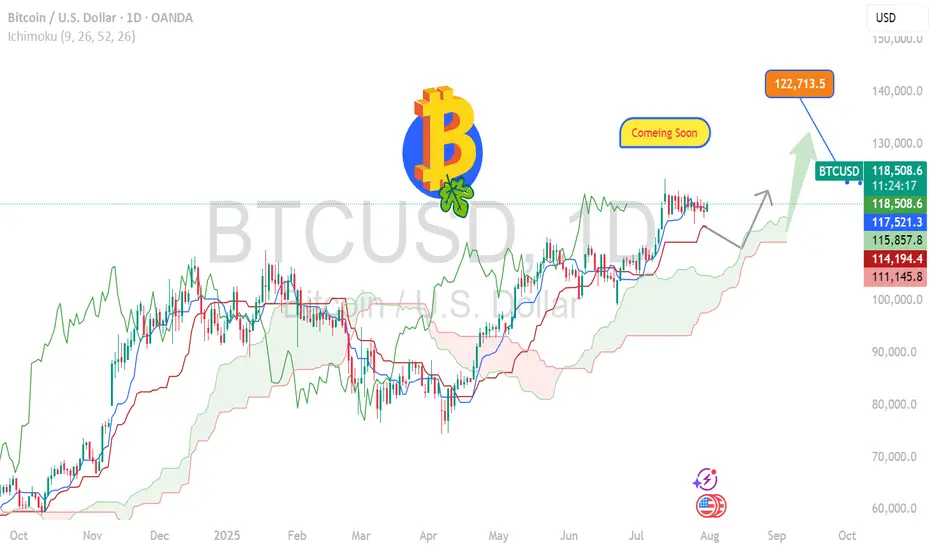
BITCOIN- Charging Towards 122k Momentum Building BTC/USD Long Setup – Targeting 122K 🔥
Bitcoin is holding strong above 118500, signaling bullish momentum.
✅ Price broke key resistance & forming higher lows.
🟢 Current structure favors buy-side continuation with next major target at 122000.
Support Zones:
🔹 117800 – intraday bullish retest
🔹 116500 – strong demand zone
Resistance Ahead:
🔸 120200 – short-term reaction
🔸 122000 – major target
🚀 Expecting bullish wave continuation.
If momentum sustains above 118K, 122K breakout highly probable!
#BTC #Bitcoin #CryptoSetup #BTCUSD #CryptoTrading #BTC122K #ChartAnalysis #BullishBreakout
Fundamental Market Analysis for July 31, 2025 GBPUSDGBPUSD:
The pound remains under pressure as consumer spending and the labor market in the UK are weakening, reducing the likelihood of an aggressive response from the Bank of England. Core inflation has dropped to 3.3% y/y – the lowest in two years – allowing the regulator to keep rates steady for longer.
External factors are also unfavorable: demand for the defensive dollar is strengthening ahead of the FOMC meeting, and the yield spread between 10-year gilts and USTs has narrowed to 115 basis points – the lowest since March, stimulating flows into the dollar.
Additional negative dynamics come from the rise in the UK current account deficit to 3.9% of GDP, amid higher prices for imported energy and declining exports of services. Expectations of tighter fiscal consolidation are increasing fiscal risks and encouraging investors to reduce long GBP positions.
Risks to the bearish outlook are limited: these would be a surprise in the form of hawkish Bank of England comments or a sharp deterioration in US macro data that could weaken the dollar.
Trade recommendation: SELL 1.32700, SL 1.32900, TP 1.31700

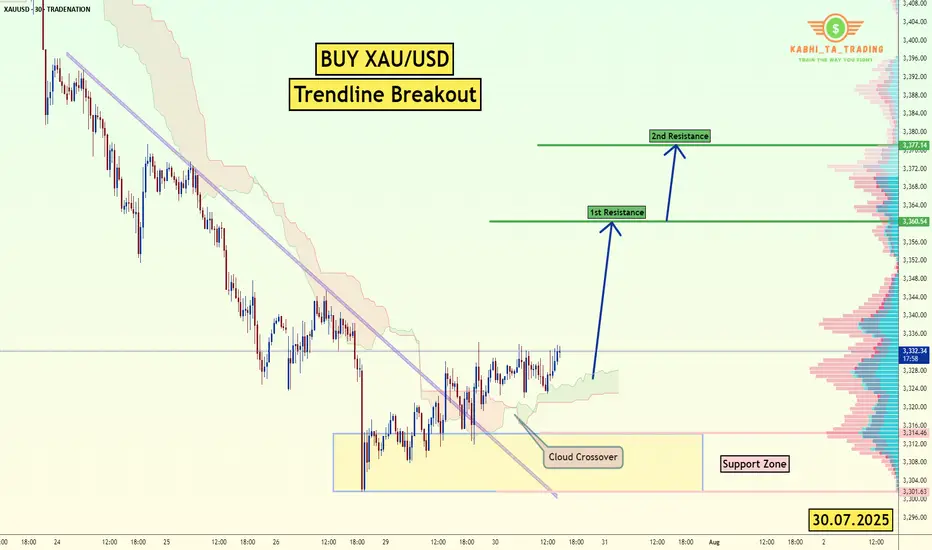
XAU/USD Trendline Breakout (30.07.2025)The XAU/USD pair on the M30 timeframe presents a Potential Buying Opportunity due to a recent Formation of a Trendline Breakout Pattern. This suggests a shift in momentum towards the upside and a higher likelihood of further advances in the coming hours.
Possible Long Trade:
Entry: Consider Entering A Long Position around Trendline Of The Pattern.
Target Levels:
1st Resistance – 3360
2nd Resistance – 3377
🎁 Please hit the like button and
🎁 Leave a comment to support for My Post !
Your likes and comments are incredibly motivating and will encourage me to share more analysis with you.
Best Regards, KABHI_TA_TRADING
Thank you.
Disclosure: I am part of Trade Nation's Influencer program and receive a monthly fee for using their TradingView charts in my analysis.
BA: Boeing down on better than expected results! 30-07-2025Yesterday we get Boeing earnings report which came better than expected, but the stock down more than 4% as the company is not expected to make positive profit or free cashflow before 2026. No dividends currently paid, so there is nothing attractive to me now.
Disclaimer: This content is NOT a financial advise, it is for educational purpose only.

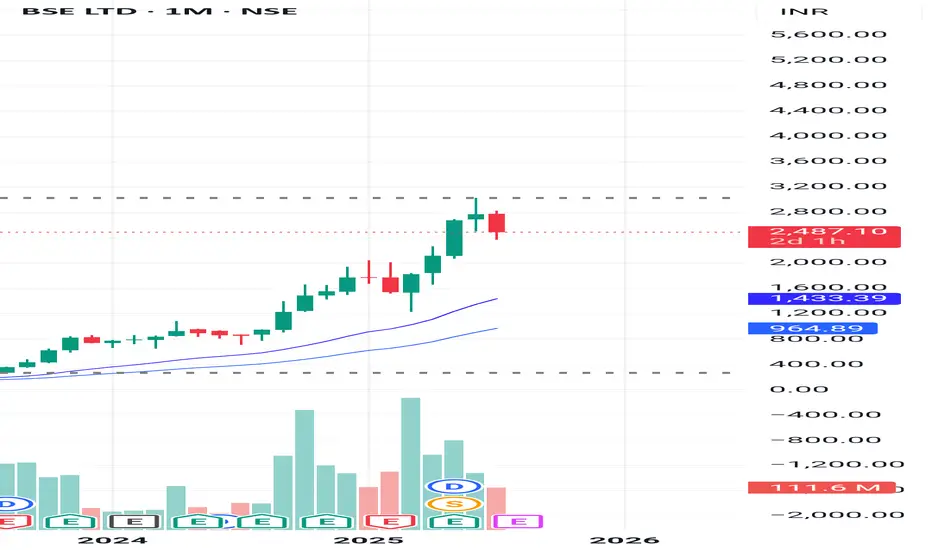
DCF VALUATION ANALYSIS OF BSEConclusion: OVERVALUED
:-OVERVIEW
BSE Limited has shown strong financial growth in recent years. Its revenue jumped from ₹924.84 crore in FY23 to ₹1,592.50 crore in FY24 (a 72% increase), and further surged to ₹3,212 crore in FY25, doubling year-on-year. EBITDA grew impressively to ₹1,779 crore in FY25 with a 60% increase, and EBIT reached ₹1,670 crore, up 56%. Net profit also rose significantly to ₹1,112 crore, with earnings per share increasing to ₹81. Dividend per share improved to ₹23, reflecting healthy returns
DCF:
-The valuation was performed using a Discounted Cash Flow (DCF) approach based purely on verified financial data and market risk parameters without relying on user-specific growth assumptions.
-The cost of equity was calculated using an adjusted risk-free rate plus equity risk premium multiplied by beta, resulting in a discount rate of approximately 13.58%. The terminal growth rate was conservatively taken as 4%. Using these reliable inputs and actual EBIT cash flows, the intrinsic enterprise value was estimated at around ₹36,839 crore, translating to an intrinsic value per share of approximately ₹1,364.
-Currently, BSE’s market price is around ₹2,480 per share, which is substantially higher than the intrinsic value derived from fundamentals, indicating the stock is trading at a significant premium. This valuation is grounded in audited company financials and globally accepted valuation methodologies, providing a trustworthy reference point for investors.
Fundamental Market Analysis for July 29, 2025 EURUSDThe pair is consolidating at 148.500, leaving behind a nearly 1% gain since the start of the week. High Treasury yields (10-year bonds — 4.34%) are supporting demand for the dollar, while the easing of the US-Japan trade conflict is reducing defensive demand for the yen. As part of yesterday's statement by the US Treasury, tariffs on Japanese cars are being reduced to 10%, which improves the outlook for export-oriented corporations, but at the same time reduces investors' need for safe-haven currencies.
Despite inflation of 3.7% y/y and rising food costs, the Bank of Japan is likely to keep its rate at 0.5% following its July 30-31 meeting and only revise its CPI forecasts upward. Former Deputy Governor of the Central Bank Hiroshi Nakaso acknowledges that further increases are only possible after assessing the effect of US tariffs, i.e., not before 2026. This scenario reinforces negative real interest rates and a widening yield differential with the US.
In addition, the inflow of Japanese investment into foreign bonds has resumed amid confidence in a gradual, rather than sharp, normalization of BOJ policy. Taken together, these factors point to the likelihood of a test of 150.00 in the coming days in the absence of verbal intervention by the Japanese Ministry of Finance.
Trading recommendation: BUY 148.500, SL 147.900, TP 150.500
