DOGE Short Term pullback prior to breaking trendI am bearish on Dogecoin for the next 10 days or so, but overall bullish to break the downward trend for months now.
Waiting for a break above the longterm downward then a retest would be the safest play. A more aggresive approach may be to put some orders in at the recent support levels with a stop loss near the recent lows.
Doge is a popular token and meme that has a large following. I think there are many long term holders than any other meme.
Fundamental Analysis

End of Week analysis (USDJPY)Sorry for the late video but we are looking good for another continuation day. we have some strong bullish momentum now to tap into that untapped daily wick. from there we will see some strong resistance.
Happy trading everyone hope everyone had a great week.

NewtekOne | NEWT | Long at $10.92NewtekOne NASDAQ:NEWT is a financial holding company providing business and financial solutions to small- and medium-sized businesses across the U.S. Services include Newtek Bank, business lending, SBA loans, electronic payment processing, payroll and benefits, insurance, and technology solutions. While the stock has taken a major hit recently, insiders have scooped up over $1 million in shares with an average price of $11.70. Currently trading at a P/E of 5.6x, forward P/E of 6.6x, and near book value, the stock may be poised for a move up soon with the anticipation of interest rates dropping. Revenue is up 24.93% from $271.15M (2023) to $338.73M (2024) and earnings are forecast to grow 11.63% per year, but the company does have a high debt-to-equity ratio (over 5x).
Tariffs could indirectly impact NASDAQ:NEWT by increasing costs for its small- and medium-sized business clients, particularly in industries reliant on imports (e.g., manufacturing, retail). Higher costs may reduce client profitability, increasing loan default risks or reducing demand for Newtek’s lending and payment processing services. But an interest rate reversal may greatly limit the impact (longer-term).
So, at $10.92, NASDAQ:NEWT is in a personal buy zone.
Targets into 2027:
$12.00 (+9.9%)
$14.00 (+28.2%)

battle of patentGiven the robust claims of Spruce's US Patent No. 11,344,557 and Neurocrine's stock chart performance, the patent's invalidation would likely be both challenging and detrimental to the plaintiff.

XAUUSD (GOLD): Sell setupXAUUSD (GOLD): Sell setup. It is ready for a sell, it will open in Asian session, and also market is complex now, but here is my plan.
Cheers

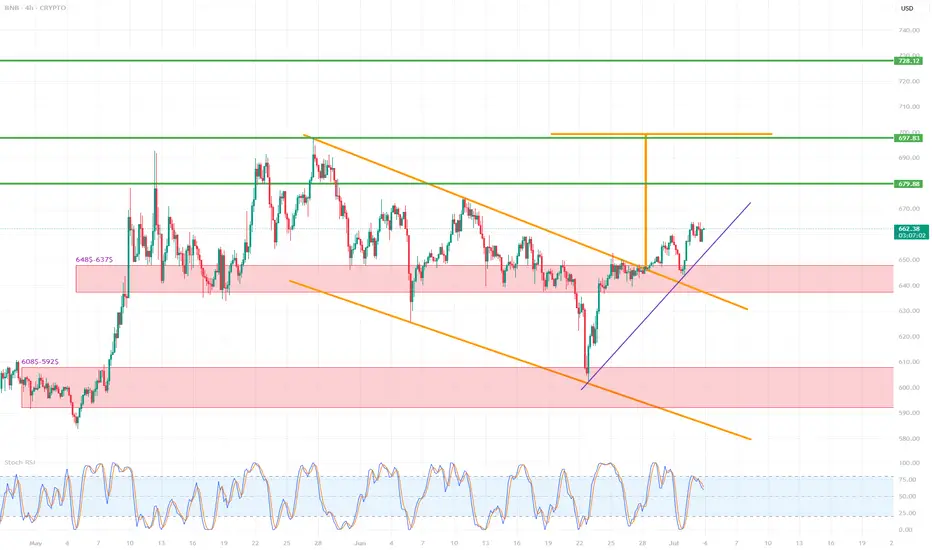
BNB/USD (4h interval)🔍 1. Chart structure
Instrument: Binance Coin / USD (BNB/USD)
Interval: 4 hours
📐 2. Technical formations
🔸 Breakout from the descending wedge formation
The descending wedge (orange lines) is a bullish formation - it suggests a potential breakout upwards.
The breakout occurred dynamically, with a large breakout candle (confirmation of the formation).
The goal of breaking out of the wedge is usually the height of the entire formation - this is marked with an orange arrow.
📈 Breakout range (target): around $697–710
🟢 Potential next targets:
697.83 (local resistance/projection result)
710.73 (main wedge height projection)
728.12 (strong resistance from history)
📊 3. Supports and resistances
🟥 Support zones (red rectangles):
$648.5–637.5 – previous resistance, now tested as support after the breakout.
$608.5–592.5 – strong support from previous lows.
🔼 Currently, the price has tested the upper support zone (648–637), reacted positively and continues to move up.
🟩 Resistance levels (green horizontal lines):
679.88 USD – local resistance, first target after breaking out of the wedge.
697.83 USD – projected range from the formation.
710.73 USD – full technical range of the breakout.
728.12 USD – strong resistance from history, may be a long-term target.
📉 4. Trends and support lines
Purple upward trend line – currently the price is above, which confirms the short-term upward trend.
Its break may lead to a retest of 648–637 USD.
Only below this zone can a larger correction be considered.
📈 5. Stochastic RSI indicator
Currently in the overbought zone (above 80).
Possible temporary cooling – signal for local correction / consolidation.
It is worth waiting for the indicator to go down to around 20 to re-enter the long.
✅ 6. Scenarios
🔼 Bullish (base) scenario:
Staying above 648–637 USD.
Maintaining the uptrend line.
Continuation to 679.88 → 697.83 → 710.73.
🔽 Bearish scenario:
Breaking the purple trend line.
Returning below 648 USD → going down to the 608–592 zone.
Negation of the breakout from the wedge.
📌 Final conclusions
Breaking out from the descending wedge is a strong pro-growth signal.
The price behaves in accordance with technical analysis, testing the previous resistance as support.
Currently, the retest and consolidation phase is underway – maintaining the trend line and the level of $648 will be key.
The medium-term target is $697–710.
Trading the July RBA decision The Reserve Bank of Australia (RBA) will deliver its latest policy decision on Tuesday, 9 July. Markets are heavily positioned for a 25-basis point cut, which would bring the official cash rate down to 3.60%.
Major Australian banks including CBA, Westpac, NAB and ANZ are aligned in expecting a cut this month, with some anticipating further easing in August and November. A confirmed cut paired with dovish guidance could place further downside pressure on the Australian dollar, particularly against the US dollar and Japanese yen.
AUD/USD remains capped below the 0.6580–0.6600 region, with repeated rejections suggesting strong overhead resistance. A break above this zone would be needed to shift momentum higher. Conversely, a confirmed break below 0.6520 could open a move toward the 0.6450 area. Meanwhile, AUD/JPY has rebounded firmly off its May lows and is now testing resistance near 95.30. This area has repeatedly capped upside since mid-June, making it a key level to watch into the RBA decision.

Yen-Carry Trade isn't overWhat we witnessed last summer was just the start. Equities will take a hit as a result.

How to grasp the key entry opportunity in the gold market?The market is changing rapidly, and going with the trend is the kingly way. When the trend comes, just do it. Don't buy at the bottom against the trend, so as not to suffer. Remember not to act on impulse when trading. The market is good at dealing with all kinds of dissatisfaction, so you must not hold on to orders. I believe many people have experienced this deeply. The more you resist, the more panic you will feel, and your floating losses will continue to magnify. You will not be able to eat or sleep well, and you will miss many opportunities in vain. If you also have these troubles, then you might as well keep up with my pace and try to see if it can make you suddenly enlightened.
The non-agricultural data was unexpectedly cold, with a large negative impact. The stochastic indicator in the daily chart formed a golden cross, which was a main multi-signal. The BOLL range shrank, and the range shrank to 3418-3280. This range is the main range. The price pierced up and down the central axis and hovered, waiting for the news data to stimulate. The upper track of the 4-hour Bollinger band is at $3380, and the integer mark of $3400 is also near the high point of gold prices last week. The 5-day moving average and the MACD indicator cross upward, and the KDJ and RSI indicators cross upward. In the short-term technical aspect, gold has a trend of further rebound. At present, the upper resistance is at 3360-3365, and the support position is around 3310-3300.
Gold operation strategy: It is recommended to go long near 3312-3315, with a target of 3330-3340. It is recommended to go short once it touches 3340 for the first time, with a target of 3320-3310.

How to accurately grasp gold trading opportunities?Gold rebounded as expected, and fell under pressure at the 3295-3296 line during the European session. This position was the key resistance level for the previous top and bottom conversion, and the range shock pattern continued. In terms of operation, the high-altitude and low-multiple ideas remain unchanged, and we will continue to pay attention to the short opportunities after the rebound.
📉 Operational ideas:
Short orders can be arranged in batches in the 3295-3311 area, and the target is 3280-3270 area;
If the support below 3260-3255 is effective, you can consider taking the opportunity to reverse long orders and participate in short-term.
📌Key position reference:
Upper pressure: 3295, 3311
Lower support: 3278-3275, 3260-3255
Gold strategy idea suggests shorting at 3291-3293, perfectly capturing the rebound high point! Smoothly reached the profit target of 3275, gaining 18pips! If you are not able to flexibly respond to the market in trading, and are not good at adjusting your trading ideas and rhythm in time with the market rhythm, you can pay attention to the bottom notification 🌐 to get more specific operation details and strategy updates. Let us work together to flexibly and steadily pursue more profits in the ever-changing market!

Nonfarm Payroll and some other news 03.07.2025Nonfarm Payrolls surprisingly turned out to be moderate. These are excellent arguments for the Fed not to touch the rate, since labor market is their main mandate along with inflation.
At the same time, stock market is showing steady growth and overheating in some places.
What should the US economy be saved from by lowering the Fed rate?
From Trump's future decisions, or create an influx of liquidity for a good picture so that Trump can further report on GDP growth?
These questions should be asked by engaged Fed chairman.
At 5:00 PM, an interesting ISM services report was released: the growth of new orders against background of falling employment immediately makes us wonder why then such a level of applications to Nonfarm.
The answer is simple, Elon Musk fired a lot of employees during his short career in the White House.

Japanese pharmaceutical companyJapanese pharmaceutical company Windtree Therapeutics stock price could rise to the top of the valuable region due to the acceptance of a patent for a new cancer-fighting drug

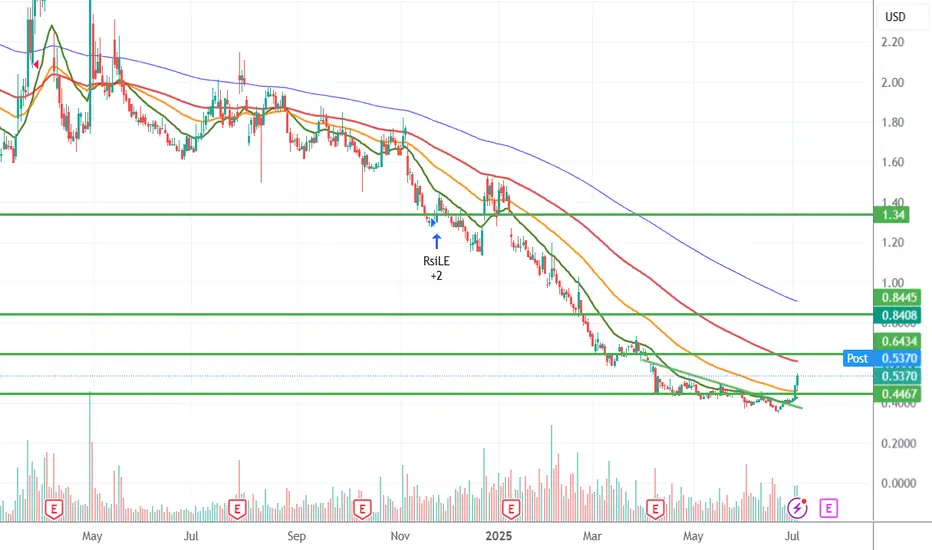
TLRY Trade Update – Island Reversal in Play?🚨 TLRY Trade Update – Island Reversal in Play? 🚨
I’ve been tracking Tilray (TLRY) for a while now. While the company has struggled, it’s now trading well below book value and showing some life on the charts. Here’s what I’m seeing — and how I’m positioned.
My Position:
50 contracts Jan 2026 $0.50 Calls @ $0.11
50 contracts Jan 2027 $0.50 Calls @ $0.18
Defined risk, big potential. I’m playing both the short-term breakout and the long-term value thesis.
Why I Entered When I Did:
When I watch stocks, I’m always focused on the chart, not just the price. I zoom out — monthly, weekly, daily — then zoom in: hourly, even 5–10 min on high-volume names.
On June 25th, TLRY broke above the hourly trendline. That was a key technical shift. From there, it began forming a bullish flag-like pattern — right after hitting new lows. That setup caught my attention.
I debated buying shares or options. I chose long-dated calls to fully define my risk and selected a strike that I believed could end up in the money. Ultimately, I went out to 2026 and 2027 to give the pattern — and potential catalyst flow — time to work.
Because in the end:
👉 Time is more important than price.
📊 Technical Breakdown:
1-Hour Chart:
Clean breakout above $0.41–$0.44
Targeting a test of $0.64 (prior breakdown zone)
Solid momentum and volume
Daily Chart:
Potential island reversal forming
Gap fill potential to $1.34
Confluence with moving averages turning up
Fundamentals:
Trading at ~$0.48 with book value near $2.80
Market cap under $500M
Exposure to cannabis, beverages, CBD, and European growth
Possible M&A or policy tailwinds still on the table
🎯 TLRY Price Targets:
$0.64
Retest of breakdown zone
Short-term (1–2 weeks)
$0.80–$0.90
Previous consolidation/resistance
Medium-term (1–2 months)
$1.34
Gap fill zone
Long-term (3–6 months)
$2.80+
Return to book value
Tail event (6–18 months)
Risk is defined. Structure is forming. If price and fundamentals align, TLRY could have room to run. Keep an eye on volume at each level and how it handles the $0.64 test.
Let’s see if the reversal holds 🔄
P.S. Since writing this breakdown, TLRY has continued its move and closed strong. While short-term price action may vary, the core thesis remains intact: the structure, volume, and breakout levels are all part of the bigger setup I'm tracking. This is a long-term swing with defined risk, and I’ll continue to post updates as the trade unfolds.
Xauusd Expecting Selling movement Gold XAU/USD on the 15-minute chart shows a clear rejection from a key resistance zone near $3332 $3335 marked by the blue rectangle Price initially spiked into this zone but quickly reversed forming a bearish engulfing pattern highlighted with a red circle indicating strong selling pressure
Following this rejection the market structure shifted to lower highs and lower lows suggesting the beginning of a bearish continuation pattern A temporary pullback occurred but failed to break above the previous swing high reinforcing bearish sentiment
Projected Move
Price is currently forming a descending pattern and is expected to break lower
Target 1 $3312 a key support and previous consolidation level.
Target 2: $3295 a stronger support zone highlighted by the black box likely the final bearish target if momentum continues
Conclusion
As long as the price remains below the resistance zone bearish momentum is favored. A clean break below $3312 could accelerate the drop toward the second target Watch for confirmation with bearish candlesticks and volume near support levels

BONK longBONK bounced off the support level after the successful retest. Bullish movemen to next resistance level is expected to continue

GBPAUD – Swing Trade OpportunityGBPAUD has confirmed another bounce from long-term trendline support, combining technical signals with a supportive macro backdrop to set up a bullish swing opportunity.
Technical Highlights:
🔹Trendline support holding with multiple rejections, reinforcing bullish structure.
🔹Stochastic RSI has crossed up from oversold, signaling bullish momentum building.
🔹RSI recovering above 45, showing improving sentiment.
📰 Fundamental Backdrop:
The Bank of England remains hawkish on inflation, keeping GBP supported.
Australian Dollar under pressure as China growth concerns weigh on commodity demand.
Broader risk-on environment limits AUD’s safe-haven appeal compared to GBP.
🎯 Bullish Targets:
✔️ TP1: 2.0727 – First key resistance zone for partial take profit.
✔️ TP2: 2.0874 – Major resistance and next swing target.
✔️ TP3: 2.1000+ – Full potential if momentum extends.
🔒 Stop-Loss: Below 2.0461 – Clear invalidation if support fails.
📝 This setup provides a healthy Risk/Reward ratio with defined invalidation and multi-target upside. Manage actively as the trade develops.

XAU/USD remains subdued beneath 3352, with downward pressure perXAU/USD Below Pivot, Eyes on 3352 for Bullish Clarity
Gold remains pressured under the 3347 pivot and the 3352 resistance, aligning with the 1h–2h supply zone. Despite brief upside attempts, price action still struggles to gain bullish momentum.
A clear 4H close above 3352 is essential to confirm any bullish shift toward 3365. Until then, the sentiment stays bearish, especially with repeated rejections from the pivot and supply zone.
Failure to reclaim 3352-3365 could trigger further downside towards 3320 and 3295, with the support line sitting at 3295.
⸻
Key Levels
Resistance: 3352 · 3365 · 3400
Support: 3320 · 3295 · 3264
Pivot: 3347

RSKD - breakout confirmed, now waiting for retestRiskified (RSKD) shows a textbook breakout setup: daily triangle plus 4H bullish flag. Price already broke out and is now retesting the 0.618 Fibonacci retracement at $5.21, which also matches the flag resistance flip and EMA cluster. This is a clean buy zone with strong technical alignment.
Volume spiked during the breakout, trend structure remains intact, and moving averages are converging — usually a precursor to strong moves. The current pullback is orderly, and if buyers show strength on this retest, the price could target $6.00, then $6.54, and potentially $7.25 (1.618 extension).
Fundamentally, Riskified offers fraud prevention tech for e-commerce. The business is benefiting from global growth in online transactions and improved margin control. While still unprofitable, recent quarters showed progress toward positive operating leverage and strong client acquisition.
Tactical plan:
— Entry on confirmation from $5.21 retest
— TP1: $6.00
— TP2: $6.54
— TP3: $7.25
— SL: below $4.90 or $4.43 support zone
You’ve been watching this one. The triangle broke. The pullback is clean. Maybe it’s time to stop watching and start participating.

Skeptic | SUI Breakdown: Precision Triggers for Spot & FuturesWelcome, traders, its Skeptic! 😎 Ready to unlock SUI’s next big move? I’m delivering a pro-level breakdown of SUI, the #12 crypto with a $10.4B market cap.This Analysis dives into recent performance, ecosystem growth, and technical triggers for spot and futures trading, all rooted in cycle-based strategies. Trade with no FOMO, no hype, just reason , Let’s conquer SUI! 🚖
Recent Performance & Key Events
SUI , trading at $ 2.98 with a $ 10.4 billion market cap, ranks as the # 12 cryptocurrency globally. A Layer-1 blockchain using the Move programming language, it boasts parallel transaction processing with over 160,000 TPS. In July 2025, SUI showed strong momentum, surging 10% in 24 hours and 12% weekly after bottoming in the $2.30–$2.40 range. However, a 44 million token unlock ($122M) on July 1 introduces potential selling pressure. 📊
Technical & Market Position
SUI’s Total Value Locked ( TVL ) reached $ 2.1 billion in early 2025, ranking it the 8th largest blockchain by TVL. Its DeFi ecosystem is exploding, with stablecoin volume jumping from $ 400M to $ 1.2B . Bitcoin integration and a Microsoft partnership bolster institutional adoption, signaling strong fundamentals despite volatility.
Technical Analysis
Daily Timeframe
The Daily (HWC) is in an uptrend, holding above the upward trendline (marked in blue). The major trend remains bullish unless this trendline breaks. However, the MWC is bearish, with declining volume during recent price rises suggesting a secondary corrective trend rather than a primary bullish trend. As Mark Andrew Lim notes in The Handbook of Technical Analysis, rising prices need increasing volume to confirm trader conviction and bullish momentum. Low volume indicates trend weakness, typical of corrective moves.
Spot Trigger (Long): Break of the downward corrective trendline with consolidation above resistance at $ 3.0408 . The last series breaking this trendline saw 85 % growth, but don’t rush in. Confirm with:
Falling BTC.D (Bitcoin dominance).
Total 3 long triggers (market-wide altcoin signals).
SUI/BTC uptrend, with an initial trigger on breaking its downward trendline and a primary trigger at 0.00003998 resistance.
Key Insight: Volume confirmation is critical. Without a volume surge on breakout, the risk of fakeouts is high.
4-Hour Timeframe (Futures Triggers)
On the 4-hour chart, if price reacts again at resistance $ 3.0890 , you can go long on a breakout, confirmed by RSI entering oversold. If it rejects sharply, the next long trigger is a break of $3.1606. For shorts, a break below support at $2.6593 is a strong trigger, especially with volume confirmation.
Pro Tip: Volume is king for all triggers. Without a volume spike on breakout, fakeout risk is high. Always apply capital management—1%–2% risk per trade to stay safe.
Final Vibe Check
This SUI Analysis equips you with precise triggers for spot ($3.0408) and futures ($3.0890/$3.1606 long, $2.6593 short) trading, leveraging cycle-based strategies. Want more cycle setups or another pair? Drop it in the comments! If this analysis sharpened your edge, hit that boost—it fuels my mission! 😊 Stay disciplined, fam! ✌️
💬 Let’s Talk!
Which SUI trigger are you eyeing? Share your thoughts in the comments, and let’s crush it together!

7/3/25 - $bmnr - Imagine not selling $100k/ETH7/3/25 :: VROCKSTAR :: AMEX:BMNR
Imagine not selling $100k/ETH
- somehow your eth bag is worth more than BTC per token
- and you're convinced it's going higher
- anyone who's not using this liquidity to get light literally deserves what's coming, 100%.
V

7/3/25 - $meta - Still a buy sub $1k/shr7/3/25 :: VROCKSTAR :: NASDAQ:META
Still a buy sub $1k/shr
- reality is, why would you bet against zuck
- his platforms are hitting on all strides. he is willing to internally build the best AI when he's falling behind by hiring the best talent and it is a LOT cheaper to hire for collectively $500 mm than say pay billions for a developed product and internalize it. great move Zuck!
- and their ad tools are second to none and don't suffer as much from "Google search" narrative as the ecosystem is one of those that's incrementally chipping away from Google.
- at mid 20s + PE, the stock is not "cheap" but it's actually quite affordable for the environment we're in
- some market POV: I think we've seen the "garden variety" pullback already. believe it or not... when you look at the individual names from recent highs, we've seen a lil 3 to 10% shuffle and not all on the same day (take for instance the TSLA dip the other day, large, and not on a day where nasdaq or other Mag7's were red).
- i continue to see small caps failing on large cap peers
- i see more money still floating lager caps higher at the expense of small caps, even tho it might look the opposite in the immediate term (this is a story as old as time... newbs chase quick thrills, get squashed and can afford less of the assets they should be buying to begin with). so word to the wise: if you've made some nice tendies lately on slightly more degen plays... buying stuff like Mag7's or even indices at highs is not necessarily a "bad" buy.
- anyway i like NASDAQ:META at sub $1k and sub 35x PE into the print
- would like to own more, so would be buying dips
- but think this is a winner in 2H
V

ServiceNow Is Up Some 55% Since April. What Might Happen Next?ServiceNow NYSE:NOW has risen nearly 55% in the past three months as the AI-focused business-management firm and member of the S&P 500 SP:SPX gained ground ahead of and following its well-received Q1 earnings. With Q2 earnings due out later this month, what does the stock's fundamental and technical analysis say now?
Let's take a look:
ServiceNow's Fundamental Analysis
For those unfamiliar with NOW, the company sells an AI-powered platform that links clients' workers and devices to a firm's work processes and data. This helps increase productivity, improve efficiency and maximize business outcomes.
ServiceNow's cloud-based platform helps businesses digitize workflows, manage client relationships and reimagine customer experience.
The company said on Wednesday that it will report Q2 results on July 23, which could be a key date for the stock. After all, NOW rose 15.5% on heavy volume the day after management released Q1 earnings on April 23 after the bell.
As for Q2, the Street is looking for NOW to post $3.57 of adjusted earnings per share on $3.12 billion of revenue. That would compare well to the $3.13 in adjusted EPS and $2.6 billion of revenue that ServiceNow reported in the same quarter last year.
Perhaps most importantly, NOW had $10.3 billion of performance obligations as of Q1's end. That was good for 22% year-over-year growth, which bodes well for the company's future.
That said, 24 of the 35 sell-side analysts that I found who cover NOW have lowered their Q2 earnings estimates since the quarter began, while only 11 have raised their outlooks. That's typically bearish.
ServiceNow's Technical Analysis
Now let's check out NOW's chart going back to January and running through earlier this week:
image]https://www.tradingview.com/x/T9PMI1X8/
Readers will see that ServiceNow hit an $1,198.09 all-time intraday high in late January, then went into what appears to be a fairly standard "cup-with-handle" pattern from there. That's generally considered a bullish set-up.
Another bullish consideration is the so-called "golden cross" that the stock saw in late June. That's when ServiceNow's 50-day Simple Moving Average (or "SMA," marked with a blue line) crossed above the stock's 200-day SMA (denoted with a red line) at the chart's right.
Lastly, the bulls might point to a still-unfilled gap that NOW has from late January. Stocks don't always fill in such gaps, but historically, most eventually do.
However, let's now look at the other side of the coin -- the potentially bearish signals that the above chart is showing.
First, the "handle" part of NOW's "cup-with-handle" pattern has flattened out somewhat and really is rather shallow. Some technicians feel that the deeper the handle, the stronger the rally that follows. So, some might see ServiceNow's shallower handle in this pattern as not especially bullish.
Meanwhile, NOW's Relative Strength Index (the gray line at the chart's top) is neutral, but appears to be weakening.
Similarly, the stock's daily Moving Average Convergence Divergence indicator (or "MACD," marked with black and gold lines and blue bars at the chart's bottom) looks slightly bearish here.
The histogram of the ServiceNow's 9-day Exponential Moving Average (or "EMA," denoted by blue field) is below zero and has been since late May. This can typically be seen as bearish.
On top of that, the stock's 12-day EMA (the black line) and its 26-day EMA (the gold line) appear to be wrestling for the upper hand, although they both remain in positive territory.
The bulls will be rooting for the 12-day EMA to win out, while the bears will be cheering for the 26-day EMA.
Add it all up and ServiceNow looks like it's well-positioned to go ... somewhere. The question is where.
The stock's upside pivot stands at $1,046 in the chart above, having been created by the cup-with-handle pattern. That's somewhat below the $1,052.77 that ServiceNow was trading at intraday Thursday, but the stock hasn't yet held that level.
NOW's downside pivot would be its 200-day SMA (around $969 in the chart above). Losing that support line would likely force portfolio managers who are invested in the name to reduce their long-side exposure.
(Moomoo Technologies Inc. Markets Commentator Stephen “Sarge” Guilfoyle had no position in NOW at the time of writing this column.)
This article discusses technical analysis, other approaches, including fundamental analysis, may offer very different views. The examples provided are for illustrative purposes only and are not intended to be reflective of the results you can expect to achieve. Specific security charts used are for illustrative purposes only and are not a recommendation, offer to sell, or a solicitation of an offer to buy any security. Past investment performance does not indicate or guarantee future success. Returns will vary, and all investments carry risks, including loss of principal. This content is also not a research report and is not intended to serve as the basis for any investment decision. The information contained in this article does not purport to be a complete description of the securities, markets, or developments referred to in this material. Moomoo and its affiliates make no representation or warranty as to the article's adequacy, completeness, accuracy or timeliness for any particular purpose of the above content. Furthermore, there is no guarantee that any statements, estimates, price targets, opinions or forecasts provided herein will prove to be correct.
Moomoo is a financial information and trading app offered by Moomoo Technologies Inc. In the U.S., investment products and services on Moomoo are offered by Moomoo Financial Inc., Member FINRA/SIPC.
TradingView is an independent third party not affiliated with Moomoo Financial Inc., Moomoo Technologies Inc., or its affiliates. Moomoo Financial Inc. and its affiliates do not endorse, represent or warrant the completeness and accuracy of the data and information available on the TradingView platform and are not responsible for any services provided by the third-party platform.

7/3/25 - $sym - Crackhead central7/3/25 :: VROCKSTAR :: NASDAQ:SYM
Crackhead central
- it's almost laughable that i'm hedging my "risky" BTC, NXT, GAMB and OSCR/HIMS positions with
- the most crackheaded stocks, QUBT, now SYM, CVNA
- i'm really not sure if the chart bros will win this one
- but given the risk/ reward merits stepping up a position here in an effort to offset any change in mkt beta... where the magnification is likely 5-10x to 1... consider me interested
- for those of you who are interested in the "fundamentals" i think the only one that's driving this stock is softbank's involvement - kind of like a PE shop - but worse
- so enjoy it while it lasts
- but this stock is ultimately going to sub $10. you can bet on it. in the meanwhile... who knows. 50% 100% 1000% higher? i'm not the one to ask. ask one of these high fiving chart "investors"
- i'm just here playing the long game
- and just warning you... the real robotics company worth owning is NASDAQ:TSLA , even if it's worth a heck of a lot more (for a reason)
V

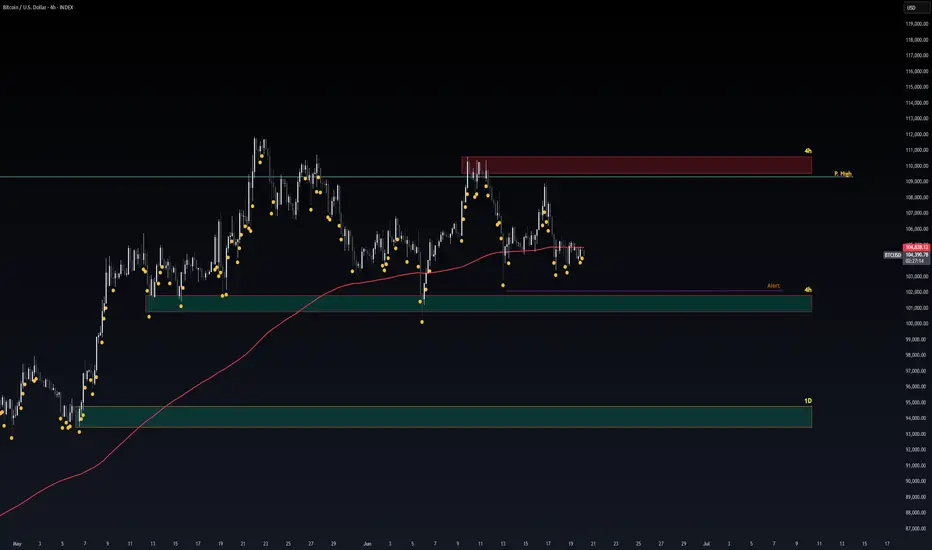
Safe Entry Zone BTCBTC Current Movement Ranging.
P.High's (Previous Highs) acts as good Support and resistance level.
4hh & 1D Green Zone Is Buying Zone.
4h Red Zone is Selling Zone.
If No Buying Power showed at 4h Zone BTC will target 1D is safest Entry Zone.
if price went above Red Zone BTC Movement will change to Up-Movement and Vice Versa
Note: 1- Potentional of Strong Buying Zone:
We have two scenarios must happen at The Mentioned Zone:
Scenarios One: strong buying volume with reversal Candle.
Scenarios Two: Fake Break-Out of The Buying Zone.
Both indicate buyers stepping in strongly. NEVER Join in unless one showed up.
2- How to Buy Stock:
On 15M/1h TF when Marubozu/Doji Candle show up which indicate strong buyers stepping-in.
Buy on 0.5/1h Fibo Level of the Marubozu/Doji Candle, because price will always and always re-test the imbalance.