GOLD trades in narrow range, leading market pulseThe current market pulse is still mainly revolving around the Trump-initiated tariff story, with spot OANDA:XAUUSD trading in a fairly narrow range and currently reported at $3,376/oz, down 0.13% on the day. Gold is also awaiting further impact from the Fed's interest rate cut, with a weaker Dollar providing support for non-yielding gold.
Tariff News Update
US President Donald Trump said on Tuesday (August 5) that US tariffs on imported semiconductors and pharmaceuticals will be announced “in about a week”. The progressive tariffs on imported pharmaceuticals could be as high as 250%.
US news agency Bloomberg News said the Trump administration is now preparing to target key economic sectors and pledge to reshape global trade.
“We’re going to start with a lower tariff on drugs, but within a year, not more than a year and a half, it’s going to be 150%, then 250% because we want drugs made in our country,” Trump said in an interview with CNBC on Tuesday. He did not specify what the initial tariff would be.
“We’re going to be announcing measures on semiconductors and chips, which is a different category,” Trump added. However, Trump did not provide further details.
The U.S. Commerce Department has been investigating the semiconductor market since April as it prepares for possible tariffs on an industry with estimated global sales of nearly $700 billion. The U.S. has imposed tariffs on imported cars, auto parts, as well as steel and aluminum under the Trump administration.
Tariffs on imported chips could significantly raise costs for major data center operators, including Microsoft Corp., OpenAI, Meta Platforms Inc. and Amazon.com Inc., which plan to spend billions of dollars on the advanced semiconductors needed to power their artificial intelligence businesses.
On the Fed’s interest-rate path
US job growth in July missed expectations, while nonfarm payrolls data for May and June were revised down significantly, with a combined loss of 258,000 jobs, suggesting a worsening labor market.
Furthermore, San Francisco Fed President Mary Daly said on Monday: "We may need more than two rate cuts, and more is likely." She also noted: "The labor market is not too weak, but it is weakening, and further weakening would be detrimental."
Surprising US labor market data and Daly’s dovish comments have all but confirmed the likelihood of a Fed rate cut in September. According to CME’s FedWatch tool, the market is now pricing in a 90% chance of a Fed rate cut in September.
OANDA:XAUUSD is often seen as a safe haven asset during times of political and economic uncertainty, and performs better in low-interest-rate environments.
Technical Outlook Analysis OANDA:XAUUSD
Gold is still trading in a fairly narrow range yesterday, but the price action is still mainly held above the EMA21 and it still has all the conditions for a possible increase. However, although the range is quite large, the overall situation is still showing a sideways accumulation trend.
Currently, gold is supported by the EMA21, followed by the short-term $3,310 level and the raw price point of $3,300. As long as it remains above the psychological $3,300 level, it is still eligible for a short-term bullish outlook.
Meanwhile, a break above $3,400 would open the door for a new short-term bullish cycle with the next target around $3,430 – $3,450.
On the momentum front, the RSI maintains its price action above 50 and is still far from the overbought zone (80 – 100) suggesting that there is still plenty of room for upside ahead.
During the day, in terms of technical position, gold has unchanged conditions that are inclined to increase in price, and the notable positions will be listed as follows.
Support: 3,350 – 3,340 – 3,310 USD
Resistance: 3,400 – 3,430 – 3,450 USD
SELL XAUUSD PRICE 3431 - 3429⚡️
↠↠ Stop Loss 3435
→Take Profit 1 3323
↨
→Take Profit 2 3317
BUY XAUUSD PRICE 3329 - 3331⚡️
↠↠ Stop Loss 3325
→Take Profit 1 3337
↨
→Take Profit 2 3343
Futures
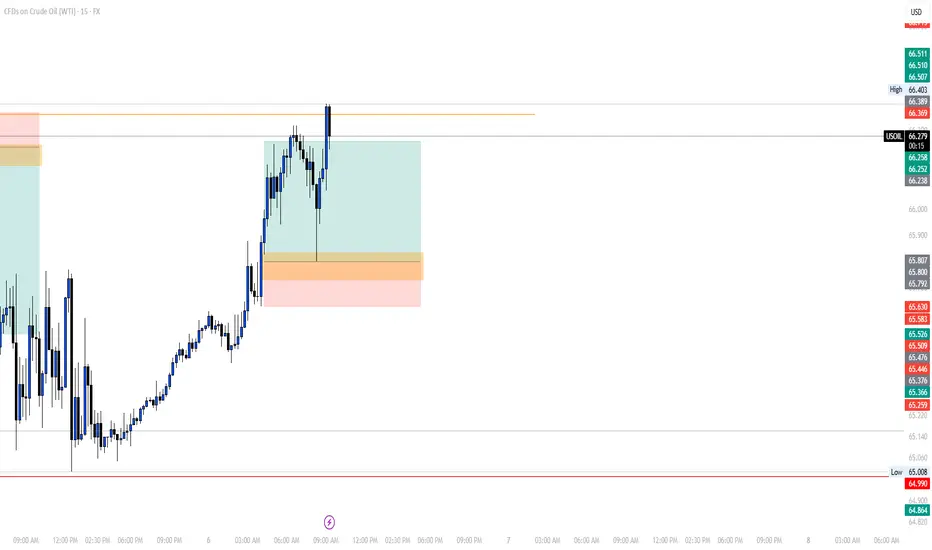
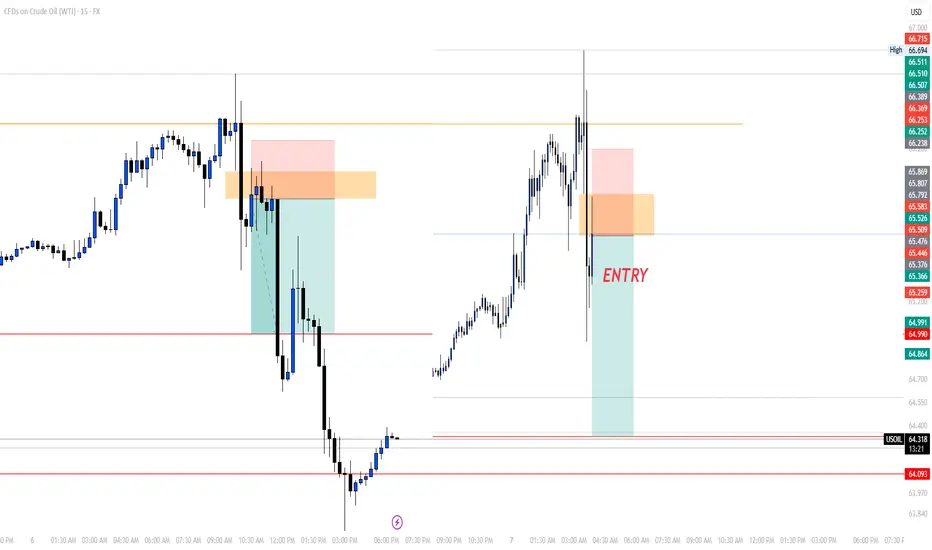
BUY USOILI'm sharing with you our trade today on OIL.
The reason we're buying is because yesterday the market grabbed the LQ now it is reversing to climb higher to fill all of the FVG we got in the previous movement.
For a safe entry, wait for the price to come back to our entry poin at 65.800 since I myself am waiting for the price to come to our entry point.
Follow for more!

TRADE CANCELEDThis morning I posted to take a long trade and we canceled it since the price didn't come to our entry point which is a normal thing to happen, now after that it took the daily LQ, we'll be waiting for the price to give us a sort entry to take.
Follow for more!
Strength in Precious Metals ContinuesThere was a good mix in price action across many asset classes on the day today where the precious metals traded higher led by the Silver market, which traded up near 1.3% on the day. There was a mixed set of data being released today with manufacturing data and PMI, and the S&P and Nasdaq finished the day lower. Over the past few weeks, there has been significant volatility in the precious metals looking at Gold, Silver, and Copper, and the last few trading days Gold and Silver have strung together a few positive days in a row. Both Gold and Silver have been trading at or near all time high prices and have been able to hold at these levels even with slight selling pressure.
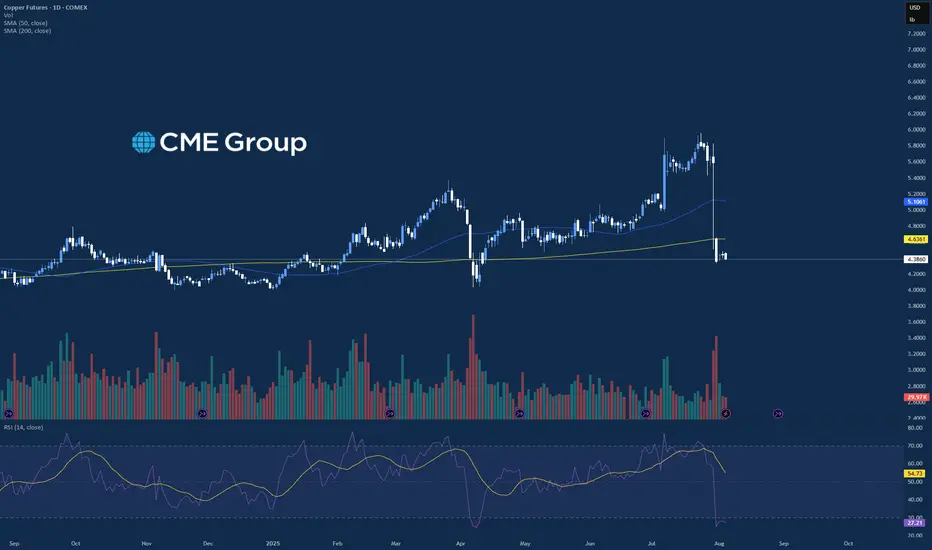
Copper on the other hand has continued to struggle after the 50% tariff on all imports was announced last week, and the market has dropped from “overbought” to “oversold” levels on a daily basis in a matter of a few days. There will be a good amount of earnings coming out for the remainder of the week that could add additional volatility to the equity indices along with the precious metals to wrap up the week.
If you have futures in your trading portfolio, you can check out on CME Group data plans available that suit your trading needs tradingview.com/cme/
*CME Group futures are not suitable for all investors and involve the risk of loss. Copyright © 2023 CME Group Inc.
**All examples in this report are hypothetical interpretations of situations and are used for explanation purposes only. The views in this report reflect solely those of the author and not necessarily those of CME Group or its affiliated institutions. This report and the information herein should not be considered investment advice or the results of actual market experience.
TP REACHED ON OUR TRADE ON OILEarly this morning I posted to sell on OIL, now here I am with the results of the price reaching our TP.
Our entry was based on a reversal and a FVG as you can see on the chart, target was the previous low which the market exactly reached.
Follow for more!

GOLD down slightly, watch today's data, technical conditionsOANDA:XAUUSD edged lower in Asian trading on Tuesday (August 5), currently trading around $3,380/ounce. On Tuesday, the US ISM services PMI will be released, which is the most important economic data of the week and is expected to impact the gold market.
OANDA:XAUUSD prices surged after weak jobs data increased the possibility of the Federal Reserve cutting interest rates.
Data released last Friday showed that the number of new jobs in the US non-farm sector in July was much lower than expected, and the total number of non-farm jobs in the first two months was revised down by 258,000, indicating a sharp deterioration in the labor market.
Traders now see an 87% chance of a rate cut in September, up from 63% last week, according to CME Group's FedWatch tool. Expectations of a rate cut have boosted gold prices, as the dollar provides support for the precious metal.
The US ISM non-manufacturing purchasing managers index (PMI) for July will be released today (Tuesday) and is expected to be 51.5, up from 50.8 previously.
The July ISM services PMI could impact the US dollar and gold, depending on whether it is biased towards supporting a rate cut or pausing rate cuts for an extended period.
Gold itself does not generate interest, but generally performs well in low-interest-rate environments and is seen as an inflation hedge.
On the trade front
Today (August 5), US President Donald Trump threatened to raise tariffs on Indian goods in protest at India's purchase of Russian oil. New Delhi called Trump's attack "absurd" and pledged to protect its economic interests, deepening the trade rift between the two countries.
Trump posted on the social media platform Truth Social: "India not only buys massive amounts of Russian oil, but also sells much of it on the open market at a huge profit. They don't care how many people are being killed in Ukraine by the Russian war machine."
Trump added: "Accordingly, I will be substantially increasing the tariffs that India pays to the United States."
However, Trump did not specify the specific tariff amount.
Responding to Trump's remarks, an Indian foreign ministry spokesperson said on Monday that India would "take all necessary measures to protect its national interests and economic security." The spokesperson added: "These actions against India are unjustified and unjustifiable."
Over the weekend, Reuters reported that India would continue to buy oil from Russia despite Trump’s threats.
In July, Trump announced that he would impose a 25% tariff on imports from India, and US officials have also pointed to a range of geopolitical issues as holding up the signing of a US-India trade deal.
Trump has also described the BRICS group as generally hostile to the US. Those countries have rejected Trump’s accusations, saying the group protects the interests of its members and the developing world as a whole.
Technical Outlook Analysis OANDA:XAUUSD
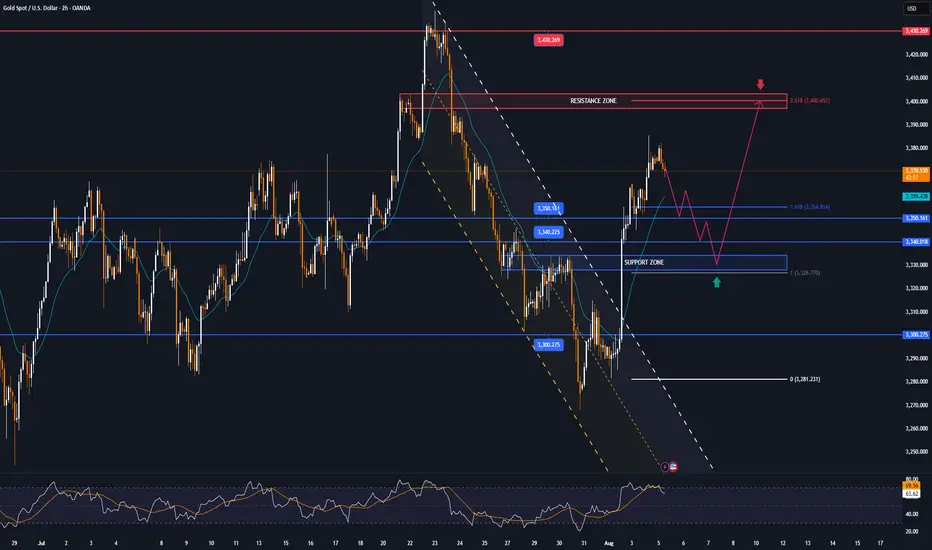
On the daily chart, although gold has been very volatile in recent times, it is still moving sideways, with price action clinging to the EMA21. And after a strong recovery in the past three trading sessions, gold is temporarily limited by the 0.236% Fibonacci retracement level, which was the bullish target that readers paid attention to earlier. The return above the EMA21 provides gold with initial conditions for bullish expectations, but a new trend has not yet formed.
If gold takes its price action above the 0.236% Fibonacci retracement level and stabilizes above it, it will have room to continue rising with the next target being the raw price point of $3,400 rather than the $3,430-$3,450 target. But at its current position, it still has no clear trend either up or down.
Meanwhile, once gold sells below the 0.382% Fibonacci retracement level, it could continue to decline with a target of $3,246 in the short term, which also means that the $3,300 – $3,292 area is the current key support area.
Momentum-wise, the Relative Strength Index (RSI) is also hovering around 50 with little fluctuation, indicating a hesitant sentiment in the market without leaning to either side.
For the day, the technical outlook for gold is a sideways consolidation but the technical conditions are slightly more bullish, and the notable positions are listed as follows.
Support: $3,350 – $3,340 – $3,300
Resistance: $3,400 – $3,430
SELL XAUUSD PRICE 3402 - 3400⚡️
↠↠ Stop Loss 3406
→Take Profit 1 3394
↨
→Take Profit 2 3388
BUY XAUUSD PRICE 3329 - 3331⚡️
↠↠ Stop Loss 3325
→Take Profit 1 3337
↨
→Take Profit 2 3343
OUR TRADE FOR THE DAYEarly today, I posted that we'll be waiting for the market to give us an entry after grabbing the liquidity, we did have it and caught it.
I didn't share it since it was given to my students.
As you can see on the chart, the market gave us a FVG after that it did grab the liquidity which we entered based on to target again the LQ level to close with a good margin.
Follow for more!
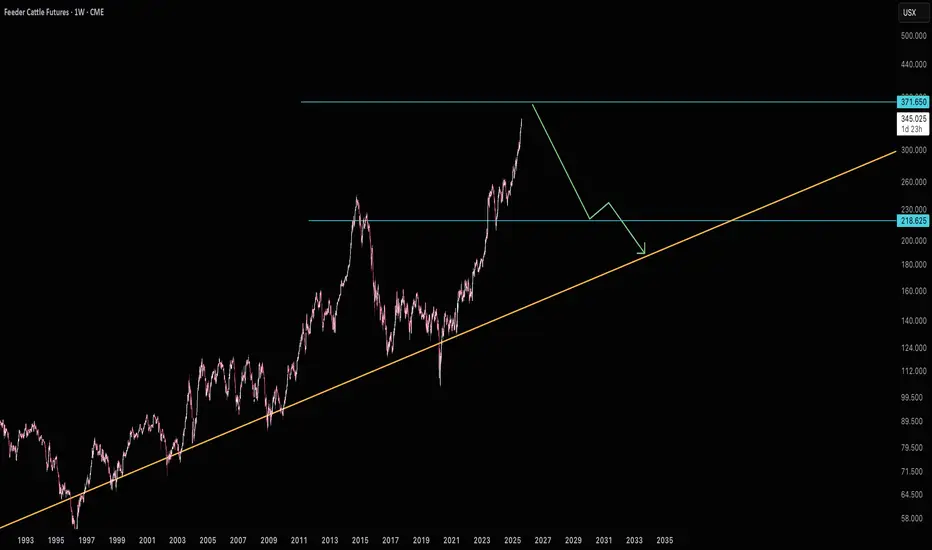
Feeder Cattle to $371 Then Back Down to $218GF is well above it's long term average. Great short opportunity at $371.
Good luck!
ES THOUGHTSES is on the verge of retracing to its monthly 50% correction mark, so my bias is bearish. Price retrace up nicely, looking for shorts to go lower. simple, sweet and short.

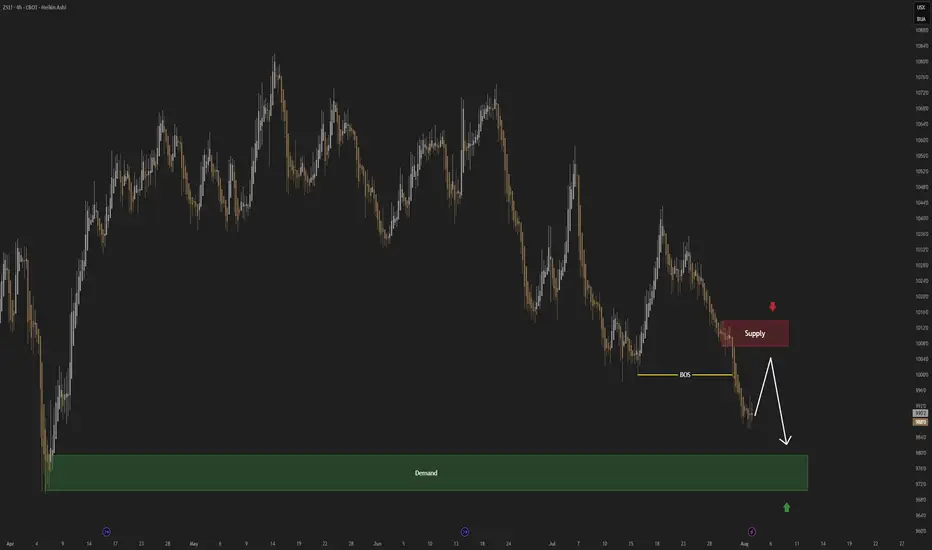
US30; Heikin Ashi Trade Idea📈 Hey Traders!
Here’s a fresh outlook from my trading desk. If you’ve been following me for a while, you already know my approach:
🧩 I trade Supply & Demand zones using Heikin Ashi chart on the 4H timeframe.
🧠 I keep it mechanical and clean — no messy charts, no guessing games.
❌ No trendlines, no fixed sessions, no patterns, no indicator overload.
❌ No overanalyzing market structure or imbalances.
❌ No scalping, and no need to be glued to the screen.
✅ I trade exclusively with limit orders, so it’s more of a set-and-forget style.
✅ This means more freedom, less screen time, and a focus on quality setups.
✅ Just a simplified, structured plan and a calm mindset.
💬 Let’s Talk:
💡Do you trade supply & demand too ?
💡What’s your go-to timeframe ?
💡Ever tried Heikin Ashi ?
📩 Got questions about my strategy or setup? Drop them below — ask me anything, I’m here to share.
Let’s grow together and keep it simple. 👊

SELL USOILI'm sharing with you our trade for this morning on OIL, which we caught based on a reversal and the 2:25am (NY Time) FVG.
Follow for more!

After data shock, GOLD has bullish conditions againOANDA:XAUUSD rose more than 2% on Friday, hitting a one-week high, as weaker-than-expected U.S. non-farm payrolls data boosted hopes of a Federal Reserve rate cut and the announcement of new tariffs boosted safe-haven demand.
On the economic data front
Gold prices rose more than 2% in U.S. trading on Friday (Aug. 1), hitting a one-week high, as weaker-than-expected U.S. non-farm payrolls data fueled hopes of a Federal Reserve rate cut and safe-haven demand was boosted by the announcement of new tariffs.
The U.S. Department of Labor's Bureau of Labor Statistics reported that nonfarm payrolls increased by just 73,000 jobs in July, well below market expectations of 110,000. June's data was revised down to just 14,000, indicating a significant slowdown in job growth. The unemployment rate rose to 4.2%, indicating a cooling labor market.
The jobs data was weaker than expected, but slightly higher than the market's lowest forecast. This increases the likelihood of a rate cut by the Fed later this year. As a non-yielding asset, gold typically performs better in a low-interest-rate environment.
According to CME Group's FedWatch tool, market participants now expect the Federal Reserve to cut rates twice before the end of the year, starting in September. Earlier this week, the Fed held rates steady at 4.25%-4.50%. Chairman Powell said it was too early to determine whether a rate cut would be forthcoming in September, citing inflation and employment data.
On the trade front
Trump has imposed a new round of tariffs on exports from dozens of trading partners, including Canada, Brazil, India and Taiwan, causing a global market crash.
Countries are scrambling to negotiate a better deal. In times of economic and geopolitical uncertainty, safe-haven gold is in high demand.
So far in 2025, gold prices have risen more than $400, hitting a record high of $3,167.57/oz on April 3, driven by safe-haven demand and central bank buying.
Weak jobs data also sent the dollar lower against major currencies, further supporting gold prices as a weaker greenback makes gold more attractive to investors holding other currencies.
Investors' Attention Turns to September FOMC Meeting
Markets are now focused on the September Federal Open Market Committee (FOMC) meeting. Facing the dual pressures of volatile inflation, slowing employment and escalating global trade tensions, the Fed will have to balance its inflation target with economic growth.
Markets are betting on the Fed to begin a new round of easing, and gold, as a hedge against currency devaluation and economic uncertainty, is expected to continue to benefit.
Gold prices have risen more than 30% year-to-date, reflecting the market’s preference for safe-haven assets. If weak U.S. economic data continues in the coming weeks, or if new geopolitical conflicts emerge, gold prices are expected to continue their upward trend, challenging new highs for the year.
Summary, Commentary
Weak employment, new tariffs and a slumping stock market have all contributed to a strong recovery in gold prices. With the possibility of the US Federal Reserve cutting interest rates in September increasing significantly, gold market sentiment has warmed and risk aversion has returned.
Investors will need to keep a close eye on inflation data, Fed officials’ speeches, and whether Trump continues to stoke trade tensions, which could lead to greater volatility in the gold market.
Against the backdrop of the unexpected non-farm payrolls report and moderate inflation, the market has essentially “locked in” the possibility of a rate cut in September, but whether the cut will be 25 or 50 basis points, and whether there will be further rate cuts in the future, will depend on the interaction between the Fed members’ verbal guidance and market expectations.
Technical Outlook Analysis OANDA:XAUUSD
On the daily chart, affected by the sudden weak data that shocked the market, gold broke most of the technical structure that was leaning towards the downside. Price action was pushed above the EMA21, while the short-term downtrend channel was also broken above and the Relative Strength Index crossed above 50.
These are the initial conditions for a short-term uptrend. But to confirm an uptrend and a new uptrend in the near term, gold needs to continue to break above the 0.236% Fibonacci retracement level (3,371 USD) first, then the target will be around 3,400 USD in the short term.
If gold breaks above $3,400 again, traders should set a new target of $3,430 in the short term, rather than $3,450 which is the all-time high.
Motivationally, the RSI has not reached oversold territory to provide pure reversal support, but it has been pushed by the market shock after the NFP data release, so this rally may not be sustainable in a purely motivational way either.
Overall, gold is now more bullish after a rally on Friday, opening up initial conditions for expectations of a new uptrend. And the notable points will be listed as follows.
Support: 3,323 – 3,310 – 3,300 USD
Resistance: 3,371 – 3,400 – 3,430 USD
SELL XAUUSD PRICE 3376 - 3374⚡️
↠↠ Stop Loss 3380
→Take Profit 1 3368
↨
→Take Profit 2 3362
BUY XAUUSD PRICE 3327 - 3329⚡️
↠↠ Stop Loss 3323
→Take Profit 1 3335
↨
→Take Profit 2 3341
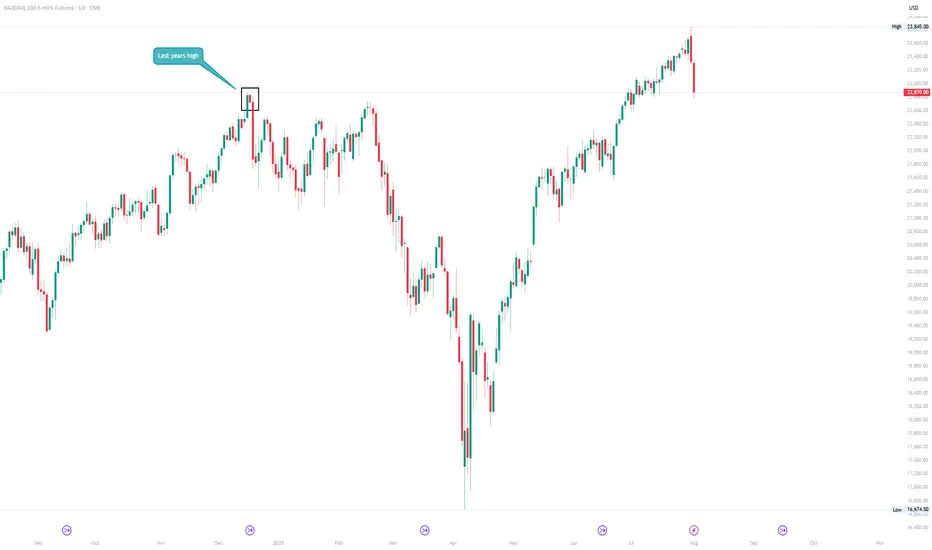
E-Mini Nasdaq Futures Markets Close at a Major Inflection PointAs the new month begins, the market just closed right at last year’s high, a critical level that could act as either resistance or new support.
These return-to-origin zones aren’t random. They often mark key decision points for institutional capital.
The question now:
Does this level hold as a launchpad, or does it reject?
What to watch :
VIX curve: contango or hedging pressure?
Bond market: confirming risk-on or signaling caution?
Breadth: is this rally broadening or narrowing?
No need to predict. Let price and flow do the talking.
See you on the inside. CME_MINI:NQ1!
NQ | NASDAQ - Weekly Recap & Gameplan - 03/08/25📈 Market Context:
The market is pricing in a potential 0.25% rate cut in the September FOMC meeting, keeping the overall structure bullish.
Although we saw a retracement after the Non-Farm Employment Change came in weaker than expected, bullish sentiment remains intact.
Currently, market sentiment has shifted to neutral from last week’s greed. Augusts are often choppy and prone to retracement/accumulation, but structurally, bulls still hold the upper hand.
🧾 Weekly Recap:
• NQ started the week strong with price discovery, pushing higher from Monday to Thursday.
• Eventually, price ran a key 4H swing liquidity, which led to another all-time high.
• That move was followed by the start of a healthy retracement, signaling short-term distribution.
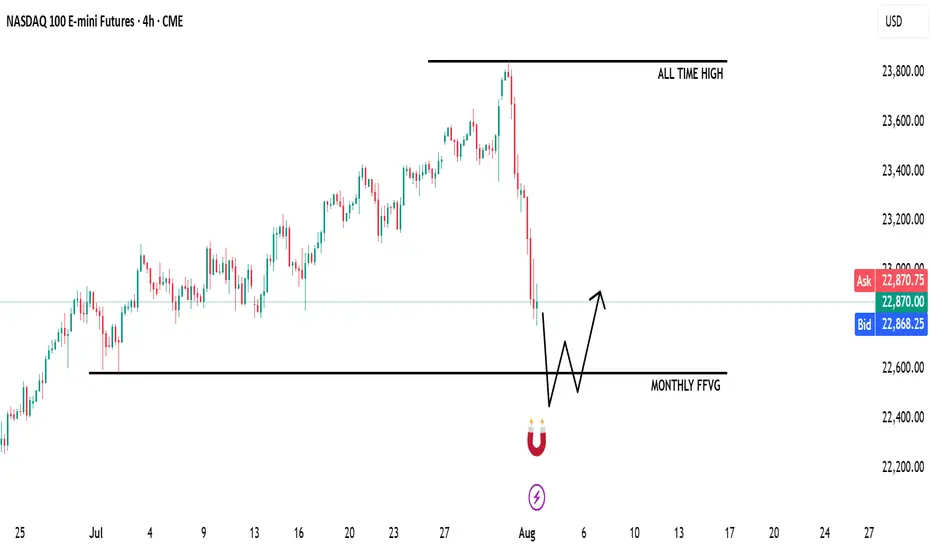
📌 Technical Outlook & Game Plan:
→ I'm expecting price to run into the Monthly Fair Value Gap — a major liquidity magnet in my model.
→ That move could generate significant bullish energy — at least a short-term bounce, if not a full reversal.
→ Until then, I remain bearish targeting 22,583 (my marked black line).
🎯 Setup Trigger:
After price takes 22,583, I’ll watch for:
• 4H–1H break of structure (BOS)
• Formation of fresh demand zones
→ Upon LTF confirmation, I’ll look to go long aiming for another test of all-time highs.
📋 Trade Management:
• Stoploss: Below the 1H–4H demand zone
• Target: Trailing stop strategy; aggressive profit-taking on the way up
• Note: Final target could be all-time highs, but I’ll manage the position actively
💬 Like, follow, and comment if this outlook adds value to your trading. Educational content and more setups are coming soon — stay tuned!
SAHARA ANALYSIS🔮 #SAHARA Analysis 💰💰
📊 #SAHARA is making perfect and huge rounding bottom pattern in daily time frame, indicating a potential bullish move. If #SAHARA retests little bit and breakout the pattern with high volume then we will get a bullish move📈
🔖 Current Price: $0.1043
⏳ Target Price: $0.1062 and above
⁉️ What to do?
- We have marked crucial levels in the chart . We can trade according to the chart and make some profits. 🚀💸
#SAHARA #Cryptocurrency #Pump #DYOR

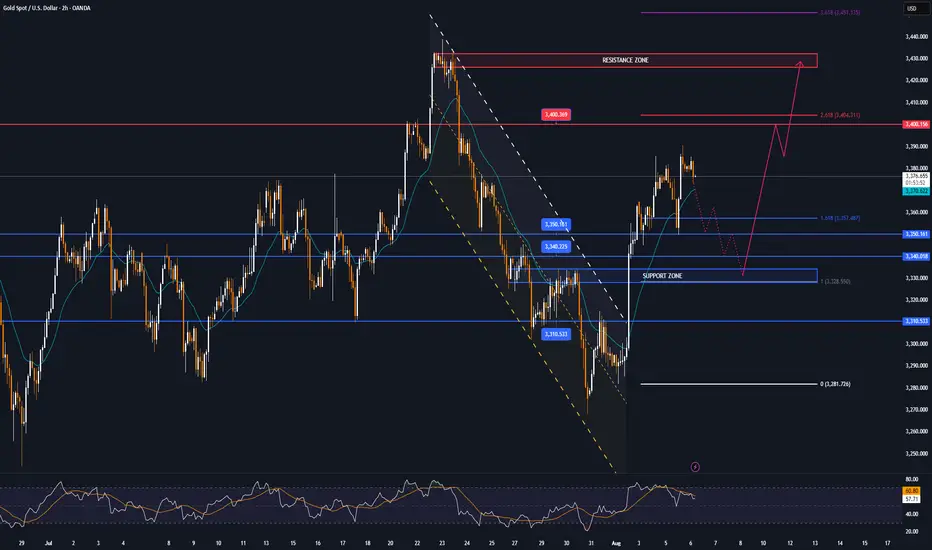
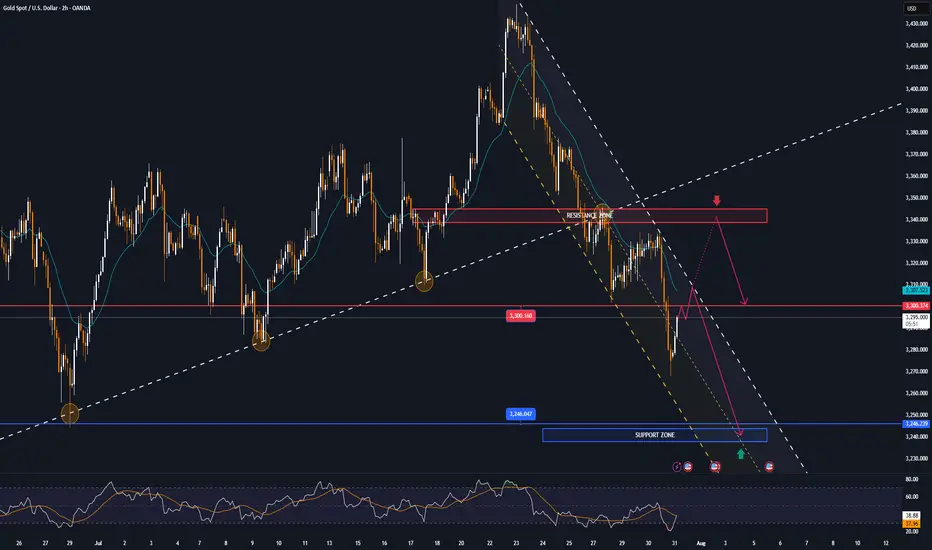
GOLD MARKET ANALYSIS AND COMMENTARY - [Aug 04 - Aug 08]This week, the price of OANDA:XAUUSD fell sharply from $3,345/oz to $3,268/oz after the FED Chairman said that the FED has no plans to cut interest rates at the upcoming September meeting. However, at the end of the week, the US Bureau of Labor Statistics announced that the number of non-farm jobs (NFP) in the US reached only 73,000 jobs in July, much lower than the forecast, and the unemployment rate increased higher, up to 4.2%. This pushed the price of gold up sharply from $3,281/oz to $3,363/oz.
The weak labor market has significantly changed expectations for the Fed's interest rate.
With a relatively light economic data calendar next week, investors will continue to monitor Friday's jobless claims report. Meanwhile, some analysts predict that the risk of global economic uncertainty after President Donald Trump announced new tariffs will continue to boost safe-haven demand for gold.
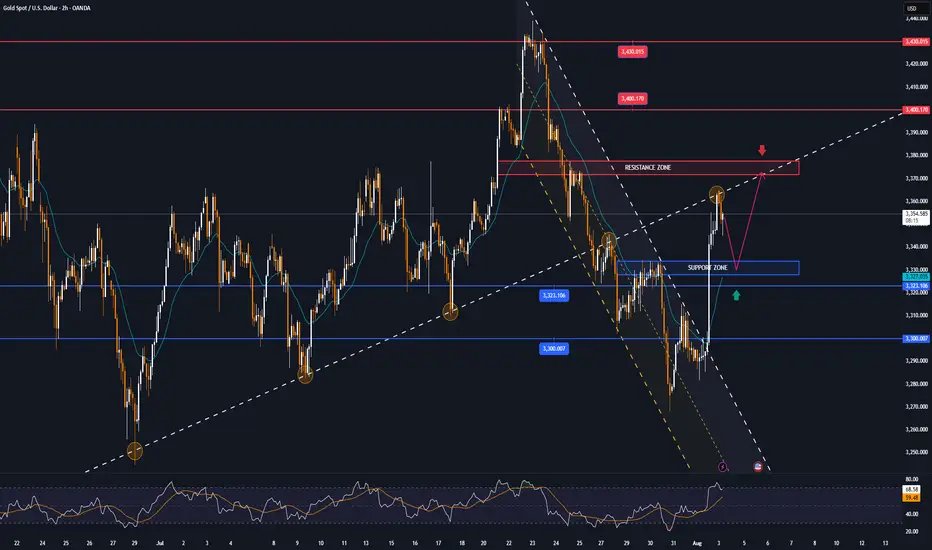
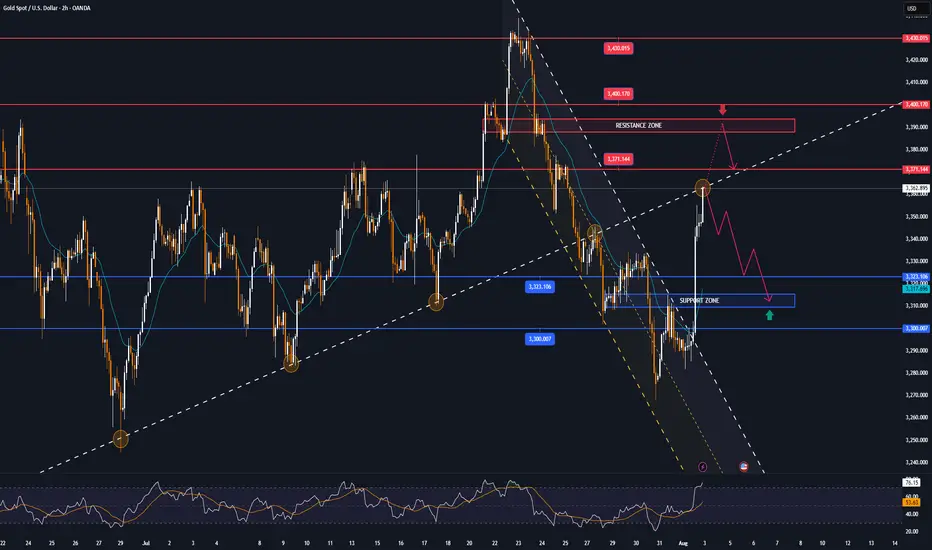
📌Technically, the resistance level for gold next week will be the round resistance of 3,400 USD/oz, followed by 3,440 USD/oz. Meanwhile, the support level is around 3,268 USD/oz.
Perspective on the H4 chart, gold is currently in a corrective recovery cycle testing the Trendline, it is likely that early next week there will be an increase around 3375 and then a correction decrease again.
Notable technical levels are listed below.
Support: 3,323 – 3,310 – 3,300USD
Resistance: 3,371 – 3,400 – 3,430USD
SELL XAUUSD PRICE 3394 - 3392⚡️
↠↠ Stop Loss 3398
BUY XAUUSD PRICE 3310 - 3312⚡️
↠↠ Stop Loss 3306
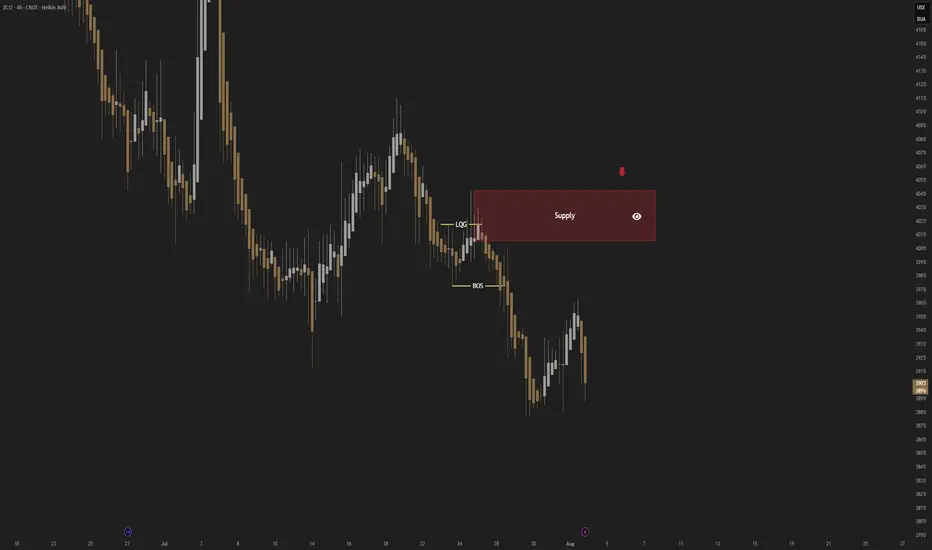
CORN; Heikin Ashi Trade Idea📈 Hey Traders!
Here’s a fresh outlook from my trading desk. If you’ve been following me for a while, you already know my approach:
🧩 I trade Supply & Demand zones using Heikin Ashi chart on the 4H timeframe.
🧠 I keep it mechanical and clean — no messy charts, no guessing games.
❌ No trendlines, no fixed sessions, no patterns, no indicator overload.
❌ No overanalyzing market structure or imbalances.
❌ No scalping, and no need to be glued to the screen.
✅ I trade exclusively with limit orders, so it’s more of a set-and-forget style.
✅ This means more freedom, less screen time, and a focus on quality setups.
✅ Just a simplified, structured plan and a calm mindset.
💬 Let’s Talk:
💡Do you trade supply & demand too ?
💡What’s your go-to timeframe ?
💡Ever tried Heikin Ashi ?
📩 Got questions about my strategy or setup? Drop them below — ask me anything, I’m here to share.
Let’s grow together and keep it simple. 👊
SOYBEAN; Heikin Ashi Trade Idea📈 Hey Traders!
Here’s a fresh outlook from my trading desk. If you’ve been following me for a while, you already know my approach:
🧩 I trade Supply & Demand zones using Heikin Ashi chart on the 4H timeframe.
🧠 I keep it mechanical and clean — no messy charts, no guessing games.
❌ No trendlines, no fixed sessions, no patterns, no indicator overload.
❌ No overanalyzing market structure or imbalances.
❌ No scalping, and no need to be glued to the screen.
✅ I trade exclusively with limit orders, so it’s more of a set-and-forget style.
✅ This means more freedom, less screen time, and a focus on quality setups.
✅ Just a simplified, structured plan and a calm mindset.
💬 Let’s Talk:
💡Do you trade supply & demand too ?
💡What’s your go-to timeframe ?
💡Ever tried Heikin Ashi ?
📩 Got questions about my strategy or setup? Drop them below — ask me anything, I’m here to share.
Let’s grow together and keep it simple. 👊
How to Use Engulfing Candles in TradingViewEngulfing patterns are among the most powerful candlestick formations because they signal strong momentum shifts and can help you spot dramatic trend reversal opportunities.
What You'll Learn:
• How to identify valid engulfing formations where one candle completely covers another's body
• The two types: bullish engulfing (green candle engulfs red) and bearish engulfing (red candle engulfs green)
• Psychology behind engulfing patterns: when one side completely overwhelms the other
• Using volume analysis to confirm engulfing pattern validity
• Finding meaningful engulfing patterns at trend highs and lows for reversal setups
• Timeframe considerations for engulfing analysis on any chart period
• Step-by-step trading strategy for engulfing reversal setups
• Setting proper stop losses above engulfing candle highs
• Determining profit targets below engulfing candle lows
• Managing wide-range drawdowns common with strong momentum shifts
• Advanced entry technique: waiting for retracements to improve risk-reward ratios
This tutorial may help futures traders and technical analysts who want to use powerful candlestick patterns to identify significant momentum changes.
The strategies covered could assist you in creating effective reversal setups when strong buying or selling pressure appears at key price levels.
Learn more about futures trading with Tradingview: optimusfutures.com
Disclaimer:
There is a substantial risk of loss in futures trading. Past performance is not indicative of future results. Please trade only with risk capital. We are not responsible for any third-party links, comments, or content shared on TradingView. Any opinions, links, or messages posted by users on TradingView do not represent our views or recommendations. Please exercise your own judgment and due diligence when engaging with any external content or user commentary.
This video represents the opinion of Optimus Futures and is intended for educational purposes only. Chart interpretations are presented solely to illustrate objective technical concepts and should not be viewed as predictive of future market behavior. In our opinion, charts are analytical tools—not forecasting instruments. Market conditions are constantly evolving, and all trading decisions should be made independently, with careful consideration of individual risk tolerance and financial objectives.

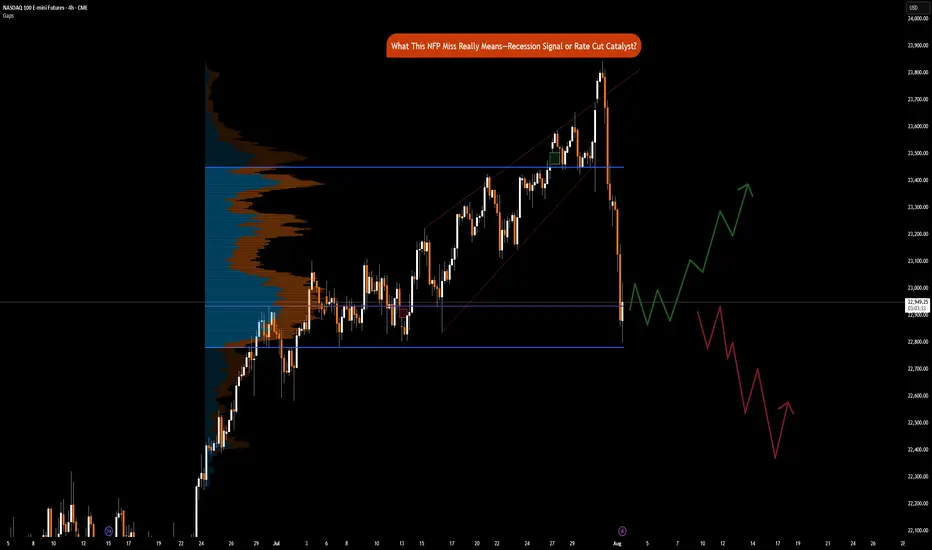
NFP Miss Implications: Recession Signal or Rate Cut CatalystCME_MINI:NQ1! CME_MINI:ES1! CME_MINI:MNQ1!
Happy Friday, folks!
Today is the first Friday of August, and that means the highly anticipated Non-Farm Payroll (NFP) numbers came in at 7.30 am CT.
US Non-Farm Payrolls (Jul) 73.0k vs. Exp. 110.0k (Prev. 147.0k, Rev. 14k); two-month net revisions: -258k (prev. +16k).
Other key labor market indicators were as follows:
• US Unemployment Rate (Jul) 4.2% vs. Exp. 4.2% (Prev. 4.1%)
• US Average Earnings MM (Jul) 0.3% vs. Exp. 0.3% (Prev. 0.2%)
• US Average Earnings YY (Jul) 3.9% vs. Exp. 3.8% (Prev. 3.7%, Rev. 3.8%)
• US Labor Force Particle (Jul) 62.2% (Prev. 62.3%)
Data and Key Events Recap:
What a year this week has been! It's been packed with high-impact economic data and pivotal central bank decisions, especially from the Federal Reserve. On top of that, trade and tariff announcements have dominated the headline.
U.S. economic data this week was broadly strong. Second-quarter GDP came in at 3.0%, beating expectations and signaling solid growth. The ADP employment report also surprised to the upside, printing 104K vs. the 77K forecast. Consumer confidence showed resilience as well, with the Conference Board’s reading rising to 97.2.
Inflation data was mixed but mostly in line. Core PCE for June rose 0.3% MoM, while the YoY reading ticked up to 2.8%, slightly above the expected 2.7%. The broader PCE Price Index also came in at 0.3% MoM, with a YoY print of 2.6%, slightly higher than forecast.
The Federal Open Market Committee (FOMC) voted to keep the federal funds rate target range unchanged at 4.25% – 4.50%. Notably, Governors Waller and Bowman dissented, favoring a 25-basis-point rate cut as expected, however, marking the first dual dissent by governors since 1993.
Changes to the FOMC Statement included a downgraded assessment of economic growth, reflecting slower real consumer spending. The Committee reiterated that uncertainty around the economic outlook remains elevated. It maintained its view of the labor market as "solid" and inflation as "somewhat elevated." Forward guidance remained unchanged, emphasizing the Fed’s readiness to adjust policy as necessary while continuing to monitor risks to both sides of its dual mandate.
Here’s a summary of key points from the FOMC press conference:
• On current policy stance:
“We decided to leave our policy rate where it’s been, which I would characterize as modestly restrictive. Inflation is running a bit above 2%... even excluding tariff effects. The labor market is solid, financial conditions are accommodative, and the economy is not performing as if restrictive policy is holding it back.”
Chair Powell commented on the need to see more data to help inform Fed’s assessment of the balance of risks and appropriate Fed Funds rate.
• On labor market risks:
“By many statistics, the labor market is still in balance... You do see a slowing in job creation, but also a slowing in the supply of workers. That’s why the unemployment rate has remained roughly stable.”
• On inflation and tariffs:
“It’s possible that tariff-related inflationary effects could be short-lived, but they may also prove persistent. We’re seeing substantial tariff revenue—around $30 billion a month—starting to show up in consumer prices. Companies intend to pass it on to consumers, but many may not be able to. We’ll need to watch and learn how this unfolds over time.”
Trade Headlines:
US President Trump announced tariffs on countries ranging from 10%-41%. Average US tariff rate now at 15.2% (prev. 13.3%; 2.3% pre-Trump), according to Bloomberg. US officials said that if the US has a surplus with a country, the tariff rate is 10% and small deficit nations have a 15% tariff, US officials said they are still working out technicalities of rules of origin terms for transshipment and will implement rules of origin details in the coming weeks. No details on Russian oil import penalty. Sectoral Tariffs White House said new reciprocal tariff rates take effect on Friday. Although Canada’s tariffs were increased to 35%, excluding USMCA goods, the effective rate is only 5%.
The economic data is showing strength, on the contrary, tariffs announcements for most countries have now been announced. Investors need to consider that tariffs are not just a tool to reduce trade deficit, it is also a geopolitical tool presently being used to shape alliances. The US wants to soften BRICS, China and Russian influence on the world stage.
Key to note is that these tariffs are substantially lower than what was announced on April 2nd, 2025.
The key question now remains, do participants buy the dip or ‘sell the fact’ is the current playbook?
Market Implications
Given the prior revisions in NFP data of -258K, July’s payroll came in at 73K, missing forecasts of 110K. What does this mean for markets? Markets are now pricing in 75% chance of a September rate cut. Prior revisions along with the current job market slowing down imply that risks to the downside are substantially increasing. Fed’s current policy is not just moderately restrictive but rather it may likely tip the US into a recession if Fed Funds rates remain elevated. The Chair asked to see more data, and here it is but I do wonder why they did not take this data into account for the July meeting. Surely, it would have been available to them.
Another question to ask would be, is it due to defiance of rate cut calls by the US administration? Is the Fed already behind the curve?
Fed’s dual mandate targets inflation and maximum employment. While inflation is sticky, the Fed may need to abandon their 2% mandate in favor of average inflation of 2.5% to 3%. A less restrictive policy will provide needed stimulus along with the fiscal stimulus provided via the BBB bill.
This drastically changes, in our analysis, how investors position themselves heading into the remainder of the year.
Markets (equities) may retrace slightly but the dip in our opinion will still be the play given weaker labor market data and increased rate cut bets. The bad news here means that the Fed has the data it wants to see to start cutting. Market pricing in 2 cuts seems to be the way forward for now.
GOLD falls sharply, fundamental analysis and technical positionOANDA:XAUUSD fell sharply below the $3,300/oz price level as Chairman Jerome Powell did not signal any rate cuts at his next press conference on September 16-17. He only said that “no decision has been made on September” and that “more data will be evaluated in the coming months.” Economic data undermined the case for a rate cut, while geopolitical play remained a potential support.
The Fed and Interest Rates
The Federal Reserve kept interest rates unchanged for a fifth straight meeting on Wednesday, defying persistent pressure from President Donald Trump and White House officials.
However, two members of the central bank's board dissented, a rare move in three decades that underscored growing divisions within the central bank over the impact of Trump's tariff policies.
At the meeting, the Fed kept its benchmark federal funds rate in a range of 4.25% to 4.5%, in line with policy through 2025. Last fall, the Fed cut rates by a total of 100 basis points.
However, Federal Reserve Board Governors Christopher Waller and Michelle Bowman opposed cutting interest rates by another 25 basis points, marking the first time since Alan Greenspan in 1993 that two board members have opposed a majority resolution at a meeting.
At the press conference, Chairman Jerome Powell did not signal a rate cut at the next interest rate meeting on September 16-17, saying only that “no decision has been made about September” and that “more data will be evaluated in the coming months.” Powell also noted that despite Trump’s call for a sharp 3% rate cut to reduce interest costs on US debt and stimulate the housing market, the Fed will continue to monitor the longer-term impact of tariffs on the path of inflation and economic recovery.
Market expectations for a Fed rate cut in September fell to 47% in Powell's speech.
Economic data
ADP jobs data beats expectations and is bearish
US ADP payrolls jumped 104,000 in July, beating market expectations of 75,000 and marking the biggest gain since March. The data showed continued strength in the labor market, reinforcing the Federal Reserve’s stance on keeping interest rates high. Meanwhile, the preliminary estimate of annual GDP growth in the second quarter came in at 3% (2.4% expected), and the core personal consumption expenditures price index rose 2.5% year-on-year (2.3% expected), indicating both economic resilience and inflation stability, further weakening expectations for a rate cut.
Keep an eye on the ISM manufacturing PMI and non-farm payrolls data on August 1. If the jobs numbers continue to be strong, this could reinforce the Fed’s dovish stance.
Geopolitical and Policy Plays
News of a 90-day extension of the US-China tariff deal has eased some safe-haven demand, but Trump’s August 8 deadline for a new Russia-Ukraine deal, coupled with tensions in the Middle East, continue to provide potential support for gold.
Continued purchases by central banks (such as China and India) are a positive signal in the medium to long term, but are unlikely to offset short-term pressure from the Federal Reserve’s policies.
Technical outlook for OANDA:XAUUSD
On the daily chart, gold has been sold below the $3,300 level and now the $3,300 level has become the nearest resistance at present. For now, gold will be limited by the area of the 0.382% Fibonacci retracement with the original price point of $3,300, along with that it has formed a short-term downtrend with the price channel, the next target will be around $3,246 in the short term followed by the Fibonacci retracement level noted with readers in previous publications.
On the momentum front, the Relative Strength Index is operating below 50 and is far from the oversold zone (20-0), indicating that there is still plenty of room for downside ahead.
In addition, the gold trend will also be pressured by the EMA21, as long as gold remains below the EMA21, the current technical conditions continue to favor the downside.
For the day, the technical outlook for gold is bearish with notable positions listed as follows.
Support: 3,246 – 3,228 USD
Resistance: 3,300 USD
SELL XAUUSD PRICE 3345 - 3343⚡️
↠↠ Stop Loss 3349
→Take Profit 1 3337
↨
→Take Profit 2 3331
BUY XAUUSD PRICE 3240 - 3242⚡️
↠↠ Stop Loss 3236
→Take Profit 1 3248
↨
→Take Profit 2 3254
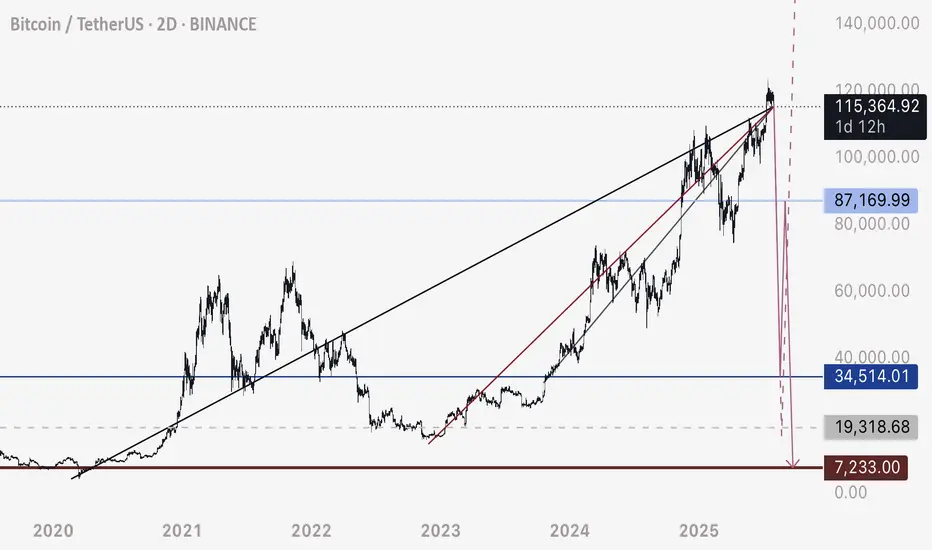
BTC - Not the End of the DropRather the beginning. Bitcoin has fallen below this bearish intersection. Anticipating price to fall rapidly on one of these two pathways to the Uber low liquidity levels.
DXY is retesting a major bearish breakdown - this is the conduit that will justify a flash crash of this magnitude prior to a 3-5 year bull run.
Happy trading.
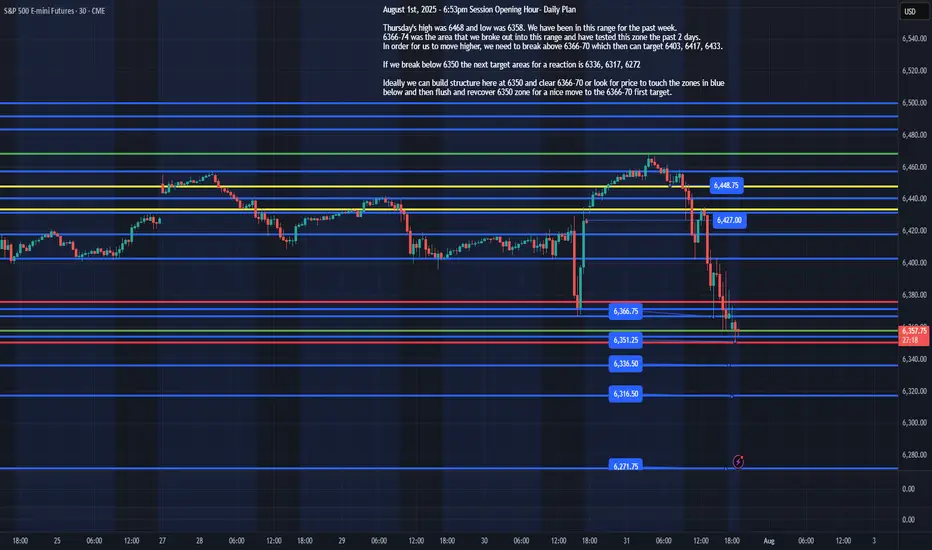
ES - August 1st, 2025 - Session Opening HourAugust 1st, 2025 - 6:53pm Session Opening Hour- Daily Plan
Thursday's high was 6468 and low was 6358. We have been in this range for the past week.
6366-74 was the area that we broke out into this range and have tested this zone the past 2 days.
In order for us to move higher, we need to break above 6366-70 which then can target 6403, 6417, 6433.
If we break below 6350 the next target areas for a reaction is 6336, 6317, 6272
Ideally, we can build structure here at 6350 and clear 6366-70 or look for price to touch the zones in blue below and then flush and recover 6350 zone for a nice move to the 6366-70 first target.
I will update the plan based on overnight price action by 8am EST, Friday August 1st, 2025