How to Trade with Bollinger Bands in TradingViewBollinger Bands are a volatility indicator that helps traders identify market extremes, trend strength, and potential breakout setups by measuring how far price moves away from its average.
What You’ll Learn:
• Understanding Bollinger Bands as a volatility-based trading tool built around a moving average
• How the middle band represents the 20-period simple moving average (SMA)
• How the upper and lower bands are calculated as two standard deviations above and below that SMA
• Why expanding bands signal rising volatility — and tightening bands signal market compression
• Recognizing overbought and oversold conditions when price touches or moves beyond the upper or lower bands
• Why these signals aren’t automatic buy or sell triggers, and how to confirm them with other tools like RSI or MACD
• Identifying the “Bollinger Band squeeze,” a setup that often precedes major breakouts
• Spotting potential mean-reversion trades when price closes back inside the bands after moving outside
• How to add Bollinger Bands on TradingView via the Indicators menu
• Understanding the default settings (20, 2) and how adjusting the period or deviation affects sensitivity
• Practical examples using the E-mini S&P 500 futures chart
• Applying Bollinger Bands across daily, weekly, and intraday timeframes for volatility analysis and signal confirmation
This tutorial is designed for futures traders, swing traders, and technical analysts who want to integrate volatility dynamics into their trading approach.
The methods discussed may help you identify breakout conditions, trend continuation signals, and potential reversal zones across multiple markets and timeframes.
Learn more about futures trading with TradingView:
optimusfutures.com
Disclaimer
There is a substantial risk of loss in futures trading. Past performance is not indicative of future results. Please trade only with risk capital. We are not responsible for any third-party links, comments, or content shared on TradingView. Any opinions, links, or messages posted by users on TradingView do not represent our views or recommendations. Please exercise your own judgment and due diligence when engaging with any external content or user commentary.
This video represents the opinion of Optimus Futures and is intended for educational purposes only.
Chart interpretations are presented solely to illustrate objective technical concepts and should not be viewed as predictive of future market behavior. In our opinion, charts are analytical tools — not forecasting instruments.
Futures

GOLD bounces back amid Fed signals and political turmoilOANDA:XAUUSD opened the Asian trading week with strong upward momentum, reflecting rising confidence that the Federal Reserve will cut interest rates as early as December. Spot gold reached $4,256.31/oz, gaining $37 within just a few hours — the highest level in five weeks.
Shifting rate-cut expectations remain the dominant driver. A series of dovish comments from Fed officials, combined with weakening economic data following the U.S. government shutdown, has led the market to price in an 87% probability of a rate cut, according to FedWatch. As the opportunity cost of holding gold decreases, capital is rapidly flowing into non-yielding safe-haven assets.
Long-term support remains intact: accelerating purchases by central banks and significant inflows into gold ETFs helped push prices to a historical peak of $4,380/oz in October. With an almost uninterrupted rally since the start of the year, gold is on track for its strongest annual performance since 1979.
However, the monetary-policy outlook is clouded by political uncertainty. President Trump announced he had chosen a successor to Chairman Jerome Powell and asked the nominee to commit to a more aggressive rate-cutting cycle.
Kevin Hassett, a senior White House economic advisor, is now estimated by markets to have a 64% probability of being appointed — a sharp rise from last week. A more politically influenced Fed could increase volatility across asset markets.
On the geopolitical front, early signs of reconciliation between the U.S. and Ukraine have temporarily reduced safe-haven demand, but not enough to slow gold’s upward momentum. Washington’s decision to send envoy Steve Witkov to Moscow this week signals a new diplomatic phase, though risk levels remain elevated.
Today’s main focus is the ISM Manufacturing PMI. A stronger-than-expected reading may support the USD in the short term, slowing gold’s advance. Conversely, weaker data would reinforce rate-cut expectations and continue to support the metal’s upward trend.
With rapidly changing policy expectations, firm technical momentum, and persistent geopolitical risk, the gold market enters December with a clearly bullish structure — but also heightened sensitivity as the Fed and the White House reshape policy direction simultaneously.
Technical Analysis & OANDA:XAUUSD Outlook
• Trend structure: Price is maintaining a medium-term ascending channel, continuously forming higher lows and higher highs, indicating that the primary uptrend remains intact.
• Key level has been reclaimed: Price closed above the 4,128–4,216 USD resistance zone (Fib 0.236 and horizontal resistance), while also holding above the short-term MA21. This satisfies both the necessary condition (holding above support/trendline) and the sufficient condition (breaking and confirming a key resistance zone) for an uptrend cycle to be considered underway.
• Momentum indicators: RSI has recovered above the mid-range and is not yet overbought, suggesting there is still room for upside momentum.
• Technical conclusion: With a close and sustained move above 4,216 USD, the bullish structure is confirmed. The next immediate technical target is to retest the all-time high around ~4,380 USD/oz, with the next extension zone near 4,500 USD in a strong capital-inflow scenario.
SELL XAUUSD PRICE 4331 - 4329⚡️
↠↠ Stop Loss 4335
→Take Profit 1 4323
↨
→Take Profit 2 4317
BUY XAUUSD PRICE 4191 - 4193⚡️
↠↠ Stop Loss 4187
→Take Profit 1 4199
↨
→Take Profit 2 4205

a Risky QuickScalp on #EURUSD📌 Market Insight: {#EURUSD }
⚠️ Risk Assessment: {High}
🚀 Approach:
Not a Quality setup and market seems need time be sorted out .
We can have it as a Quickscalp by a nice valid momentum Structure .
#Ash_TheTrader #Forex #GBPJPY #MarketAnalysis #TradingSetup #RiskManagement #GOLD #Scalper #NQ #EURUSD

GOLD MARKET ANALYSIS AND COMMENTARY - [Dec 01 - Dec 05]This week, international OANDA:XAUUSD prices rose from 4,040 USD/oz to 4,226 USD/oz and closed at 4,219 USD/oz.
Gold prices continued to rise this week because the market is “betting” that the FED will cut interest rates this coming December. In addition, gold demand surged in China as inventories at the Shanghai Gold Exchange (SGE) fell to their lowest level in a decade.
In reality, the slowdown in private-sector job growth and limited data from the U.S. government indicate weak economic activity and subdued inflation. This will continue to fuel expectations of a FED rate cut.
Next week, the market will receive several important data releases. On Monday, attention will be on the ISM Manufacturing PMI for November, followed by the ISM Services PMI on Wednesday, along with ADP private-sector employment data for October, which will be monitored more closely than usual due to the absence of NFP data. On Thursday, the U.S. will release weekly jobless claims, core PCE, and the preliminary University of Michigan Consumer Sentiment Survey for December.
📌Technically, on the H4 chart, the gold price has broken through the Downtrend line and is moving towards the next resistance zone around 4245. If it breaks this level, the gold price will approach the 4370-4380 zone. If it fails to break the 4245 barrier, the gold price will likely move sideways within the 4045-4245 range.
SELL XAUUSD PRICE 4276 - 4274⚡️
↠↠ Stop Loss 4280
BUY XAUUSD PRICE 4178 - 4180⚡️
↠↠ Stop Loss 4174

Watch Round levels Only In BTc.1) The Big Picture (Major Trend): The overall trend for Bitcoin is still "quite Bearish" (meaning the price is generally expected to go down. 👍 But right now, the short-term chart is moving "sideways" (meaning the price is chilling and not going strongly up or down).
* 2) The Price Is Super Sensitive: The price is really tuned into "Round Levels"—think of these as big, easy-to-remember numbers like $90,000, $91,000, etc.
* Right now, Bitcoin is trading around $90,784.
* The $91,000 Level: This is a "Round Level" that acts as a weak "Support" (a price floor that holds it up) and also a good "Resistance" (a price ceiling that stops it from going higher). It's a key spot!
* The $90,000 Level: The notes say that trading below this level is a good "Support" for the price.
* 3) The Price Walls:
* $92,000 is seen as a good "resistance" for the price. (Resistance = a price wall that keeps it from climbing higher 🧱).
* $93,000 is the "hard resistance" for the price. (This is the toughest wall to break! 🛑).
🔥 Quick Summary for the Trading Game:
Bitcoin is bullish overall, but it's playing ping-pong between some key numbers ($90,000 to $91,000). The biggest challenges to a massive price jump are the $92,000 and $93,000 walls!
🧠 The Trader's Plan: Bitcoin's Round Level Game
The writer is super confident that Bitcoin is "strictly following round levels." This is the core idea they are building their whole strategy around.
📉 A Quick Look Back (The Last Trade)
* Yesterday's Win: They were in a trade and "captured almost $2,000 in profit." That's a huge win! 🏆
* The Flop: But they didn't keep an eye on their trade (didn't "monitor their position"). When the US markets "sold off" (prices suddenly dropped), they had to close the trade quickly with only $0.69 profit (!!). That's a classic trading mistake—letting a huge profit disappear.
* Risk vs. Reward (R:R): They mention achieving a 1:3 R:R in their "last long trade." This is a key trading term: it means they were risking $1 to try and make $3. That's a great ratio for a profitable plan.
🎯 The Plan for Today (The Next Trade)
* The Strategy: The plan is to watch the price when it hits those "round levels." They will then decide to enter a trade, either "long or short," based on what the price does there. (Long = betting the price goes UP, Short = betting the price goes DOWN).
* The Target: Their profit goal (Target) for the trade is $1,000.
* The Levels Refined: They update their opinion on the key Round Levels:
* $91,000 is NOT a good Support.
* $92,000 is ALSO NOT a good Support.
* $90,000 is FIRM Support. This is the strongest floor, and if the price bounces here, the trader expects to get "higher targets" (bigger profits) from this level!
🔥 Bottom Line: The plan is simple: only trade when the Bitcoin price hits a major "round level" like $90,000 because that's where the biggest buyers/sellers hang out and cause the strongest price moves. CME:BTC1!

GOLD breaks above $4,190, time to exit accumulation4,190 USD/oz is a temporary step forward, with price testing the upper boundary amid thin liquidity (holiday period) and sharply rising expectations of Fed easing. However, confirming an uptrend requires a daily close above the stronger technical resistance zone (around 4,216 USD) and sustaining that level.
Reasons not to rush to confirm a “breakout from the accumulation range”
• The 4,190 USD level appeared during a low-liquidity session, making it prone to “false breaks” caused by thin trading.
• Recent volatility has been driven largely by monetary policy expectations (FedWatch ~80% probability of a December rate cut) rather than any immediate fundamental shift in gold’s supply–demand balance. Expectations can reverse quickly if Fed outlook or economic data changes.
• Geopolitical scenarios (Ukraine, Middle East) and central bank gold demand provide medium–long-term support, but these are “slow” drivers and cannot replace the need for technical confirmation to start a new bull phase.
Elements supporting a breakout (if sustained)
• Dovish comments from Fed officials (Waller, Daly, Williams) continue to reinforce rate-cut bets, while news about the potential Fed Chair candidate (Hassett) increases expectations of easier policy.
• Stable physical demand from Asia (India has recently kept importing strongly at ~14.7B USD) and steady official purchases by central banks.
• Rising global risk sentiment (shift into safe-haven assets) may push gold above 4,200 if accompanied by stronger Fed-easing signals.
Warning factors for a pullback (downside risks)
• Unexpectedly strong U.S. economic data (labor, retail sales) may reduce rate-cut expectations, pushing USD/yields higher and pressuring gold lower.
• Thin holiday liquidity increases the risk of gaps and exaggerated moves.
Outlook:
If policy conditions and geopolitics continue to support (dovish Fed + geopolitical risk), gold has a high probability of breaking out from the accumulation range and starting a true bullish cycle before/early 2026. In the short term (a few sessions to a few weeks), the market remains vulnerable to fake-outs.
Technical Analysis – OANDA:XAUUSD
Gold price has surpassed the 4,190 USD/oz zone—a positive sign but not yet enough to confirm a new uptrend.
Structurally, price remains within the medium-term ascending channel, holding above the trendline and above the short-term MA21 (~4,056 USD).
Notable Fibonacci levels:
• 0.236 ≈ 4,128 USD
• 0.382 ≈ 3,973 USD
The 3,970–4,000 USD zone remains a major support shield.
RSI is recovering from the neutral region (not overbought), showing the uptrend has a foundation but hasn't accelerated.
Necessary condition:
Hold above 3,972–4,000 USD and avoid breaking below the ascending channel trendline.
Sufficient condition (confirmation of a new bullish cycle):
A daily close above 4,216 USD/oz (Fib resistance zone / intraday peak).
Accompanied by:
• RSI breaking above 55–60
• Price holding above MA21 with a successful retest
If these conditions appear together, the probability of moving toward 4,300 — 4,380 USD/oz increases significantly.
Short-term bearish reversal scenario:
Failure to hold 3,972 USD opens the door to a deeper correction toward 3,846 USD (Fib 0.5) and then 3,720 USD (Fib 0.618).
Risk management note:
Volatility is still heavily driven by Fed news and geopolitics. Keep position sizes small, set clear stop-losses, and avoid holding large positions during policy events.
Trade Ideas (as provided)
SELL XAUUSD at 4213 – 4211 ⚡️
• Stop Loss: 4217
• Take Profit 1: 4205
• Take Profit 2: 4199
BUY XAUUSD at 4134 – 4136 ⚡️
• Stop Loss: 4130
• Take Profit 1: 4142
• Take Profit 2: 4148

GOLD retreats slightly, market gains bets on easing cycleOANDA:XAUUSD edged slightly lower after a strong rally yesterday, as the market continued to expand expectations that the Federal Reserve will begin its rate-cutting cycle as early as December. This development occurred despite positive U.S. economic data, indicating that the main support for gold now comes more from monetary policy expectations than from growth signals.
U.S. Treasury yields fell and the U.S. Dollar weakened, with the DXY index down 0.20% to 99.60, helping gold maintain its recovery momentum. Although initial jobless claims fell to 216,000 — the lowest since April — and durable goods orders rose more strongly than expected, these data had little impact on rate-cut expectations.
According to FedWatch, the probability of a Fed rate cut at the December meeting remains near 85%, a sharp increase from below 30% last week.
Geopolitical conditions, however, are shifting in a direction less supportive of gold. Signs suggest Russia and Ukraine are moving closer to a de-escalation agreement, with consultations in Geneva and positive remarks from both sides reducing the geopolitical risk premium that has supported gold for months. A Russian adviser told Al Jazeera that the U.S. plan contains “many positive aspects,” implying that diplomatic progress may be approaching.
Even so, the Fed’s policy outlook remains the dominant driver. JPMorgan Chase has reversed its forecast and now expects the Fed to cut rates in December instead of delaying until January. Michael Feroli’s economics team cited dovish comments from key Fed officials — especially New York Fed President Williams — as the reason for the shift. JPMorgan had previously expected the Fed to stay put after the September jobs report.
A new variable also attracting attention is the selection process for the next Fed Chair. Bloomberg reports that White House economic adviser Kevin Hassett — seen as dovish — has emerged as a leading candidate. The likelihood of a more dovish Fed leadership further strengthens expectations of rate cuts, pressuring the dollar and supporting gold. Treasury Secretary Bessant said the nomination could be announced before Christmas.
Overall, markets perceive that the key question now is how quickly the Fed can implement the rate-cutting cycle. Karl Schamotta of Corpay noted that markets are leaning toward expectations of more aggressive easing. In a similar move, Deutsche Bank raised its 2026 gold price forecast to 4,450 USD/oz, based on steady investment inflows and rising central bank gold-reserve demand.
While geopolitical risks appear to be easing, the outlook for U.S. monetary policy continues to be the primary driver shaping gold’s direction in the short and medium term.
Technical Analysis OANDA:XAUUSD
Gold price is maintaining the main uptrend on the daily timeframe, still moving within the ascending channel established since August. The latest session closed around 4,147 USD/oz, trading above the short-term MA21 and approaching the technical resistance zone at 4,128 (Fib 0.236) and the major resistance at 4,216 USD.
• Structure: Series of higher lows + rising channel intact → underlying trend remains bullish.
• Key support: 3,972–4,000 USD (Fib 0.382 + channel lower boundary/MA21). If this zone holds, the bullish outlook remains valid.
• Short-term resistance: 4,128 USD (Fib 0.236). A breakout above this level opens the path toward 4,216 USD and beyond.
• Momentum: RSI rebounded from the neutral zone → buying pressure has returned but remains moderate; no clear bearish divergence.
• Conclusion: Market structure remains bullish, but confirmation is needed via a breakout above 4,128 USD to validate a new bullish cycle.
Summary:
The main trend is still upward, but the market is awaiting a confirmed breakout of the 4,128–4,216 USD zone to enter a strong bullish phase. If price falls below 3,972–4,000 USD, the plan should be reassessed due to the risk of a pullback toward the 3,846 zone (Fib 0.5).
Trading Plan
SELL XAUUSD — 4195–4193 ⚡️
Stop Loss: 4199
Take Profit 1: 4187
Take Profit 2: 4181
BUY XAUUSD — 4109–4111 ⚡️
Stop Loss: 4105
Take Profit 1: 4117
Take Profit 2: 4123

GOLD ANALYSIS 11/28/20251. Fundamental Analysis:
a) Economy:
• USD:
The USD is slightly weakening after the holiday period; low market liquidity means the decline is not strong. Investors are waiting for new signals from next week’s data. Gold may spike unexpectedly if Japan intervenes in the Yen, causing USD weakness.
• U.S. Stock Market:
U.S. equities were closed for Thanksgiving. The general trend remains slightly positive with mild risk-on flow, but not strong enough to push gold in the opposite direction.
• FED:
The Fed maintains a “cautious” stance with no new signals. The scenario still leans toward keeping interest rates unchanged, which provides mild support for gold. A change in the Fed Chair increases the probability of rate cuts, which is supportive for gold.
• TRUMP:
The Trump administration continues to move toward corporate tax cuts and promoting domestic production. This creates medium-term pressure on the USD → indirectly supporting gold.
• Gold ETF – SPDR:
SPDR made no buys or sells; holdings remain unchanged. This reflects a wait-and-see sentiment, with no major capital inflow into gold yet.
b) Geopolitics:
No significant developments in the last 24 hours. Global conflicts remain simmering but not strong enough to create a major boost for gold during the holiday session.
c) Market Sentiment:
• The market is still in a sideways state with mild risk-on sentiment.
• Capital has not fully flowed back into gold, so any upside moves mainly come from technical factors rather than fundamental news.
2. Technical Analysis:
The 15-minute chart shows:
• Price has broken out of the 4,155–4,170 accumulation zone with strong upward momentum.
• RSI is rising steeply and has entered extreme overbought → short-term uptrend is intact but a slight correction is expected.
• Price structure has just formed an accumulation pattern.
• Technical target based on range box and projection: 4,207.
• EMA 20–50 are sloping upward, confirming bullish momentum.
Note: Morning breakouts are often retested → watch for BUY entries at the breakout zone.
RESISTANCE: 4,193 – 4,207
SUPPORT: 4,136 – 4,096
3. Yesterday’s Market (27/11/25):
• GOLD traded almost sideways within 4,143 – 4,170 throughout the day due to low liquidity from Thanksgiving.
• SPDR stayed out; the market is waiting for U.S. data to return.
• The accumulation structure lasted 24 hours → this morning’s breakout followed the pattern precisely.
4. Strategy for Today (28/11/25):
🪙 SELL XAUUSD | 4235 – 4233
SL: 4239
TP1: 4227
TP2: 4221
🪙 BUY XAUUSD | 4162 – 4164
SL: 4158
TP1: 4170
TP2: 4176

#CHFJPY , Lets give her a chance !!📌 Market Insight: {#CHFJPY }
⚠️ Risk Assessment: {High}
🚀 Approach:
Not a fan of these kinda pair ... but lets see
with a nice momentum structure we can take it as a QuickScalp .
#Ash_TheTrader #Forex #GBPJPY #MarketAnalysis #TradingSetup #RiskManagement #GOLD #Scalper #NQ #EURUSD

GOLD ANALYSIS 11/27/2025🟦 1. Fundamental Analysis:
a) Economy:
• USD:
The USD continues to weaken due to expectations that the FED will cut interest rates in 2026. Falling bond yields reduce the opportunity cost of holding gold → positive for GOLD.
• US Stock Market:
The U.S. market remains in the green thanks to expectations of monetary easing and the new administration’s stimulus package. Risk-on sentiment increases but does not pressure gold because the USD is still weak.
• FED:
The FED maintains a dovish tone, implying that inflation is moving in the right direction and they are ready to ease → supports gold’s bullish trend.
• TRUMP:
Plans for tax cuts and increased public spending → risk of a larger budget deficit → markets increase demand for hedging → gold becomes favored.
• Gold ETF – SPDR:
SPDR resumed strong net buying (4.57 tons yesterday), confirming large inflows returning to gold. This reinforces the current bullish trend.
b) Geopolitics:
Tensions in the Middle East remain unresolved, and Ukraine continues to escalate locally.
→ Safe-haven demand stays elevated, supporting gold.
c) Market Sentiment:
Current sentiment: risk-mixed
• Rising stocks → risk-on
• Falling USD + SPDR net buying → risk-off leaning toward gold
→ Overall: gold still holds a bullish advantage. However, the Thanksgiving holiday is reducing trading activity this week.
🟩 2. Technical Analysis:
Trend:
Gold is in a short-term uptrend after breaking the downtrend line, retesting successfully, and continuing upward.
Price Structure:
• Price consolidates around 4.36–4.173
• MA20–MA50 sloping upward
• RSI remains above 50 → buyers dominant
• Technical targets: 4.193 → 4.244
Key Levels:
• Resistance: 4.173 – 4.193 – 4.244
• Support: 4.136 – 4.096 – 4.062
🟧 3. Yesterday’s Market (26/11/25):
GOLD:
• Tapped support at 4.136 and bounced strongly to 4.173
• No bearish reversal candlestick
• Uptrend remains solid with stable volume
USD:
USD weakness is clear → supports GOLD’s bullish continuation.
SPDR:
SPDR continues net buying, confirming strong demand.
🟥 4. Trading Strategy Today (27/11/25):
🪙 SELL XAUUSD | 4195 – 4193
SL: 4199
TP1: 4187
TP2: 4181
🪙 BUY XAUUSD | 4109 – 4111
SL: 4105
TP1: 4117
TP2: 4123

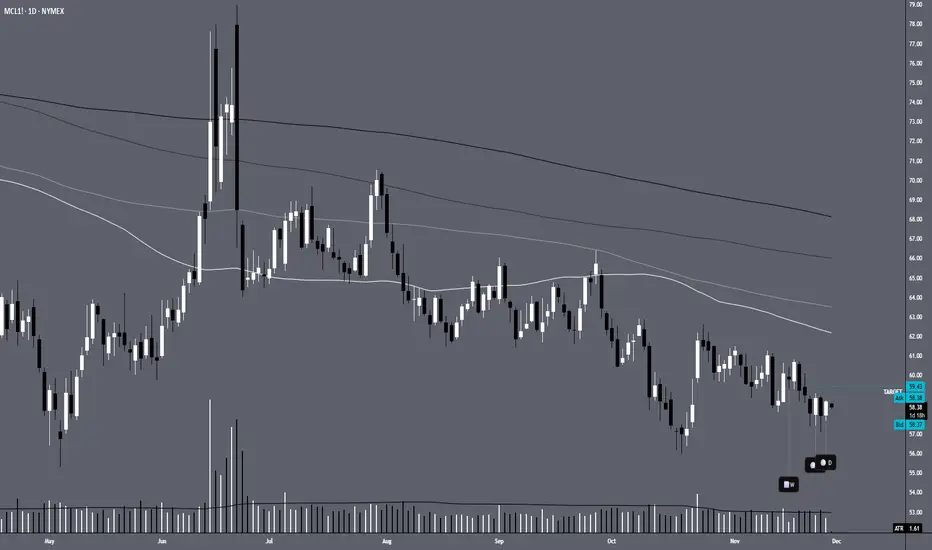
MCL1!Price is currently underneath the quarter's mark. Testing a support zone. Price could retest the November resistance zone.
$YM | Get long the pullback!Today we go through plans in $YM. After a large bull day, it's not the best day to trade as the market often needs a 'day of rest'. However, we were able to dig into our tools and come up with a solid plan to potentially get long.
Hopefully you can learn something from this video about how to make plans admit the chaos of the market.

GOLD ANALYSIS 11/26/20251. Fundamental Analysis:
a) Economy:
USD:
• The USD is leaning toward a slight decline as the market expects the FED to keep interest rates unchanged and possibly make minor cuts in the coming months.
• This supports gold because a weaker USD → bullish for gold in the short term.
U.S. Stock Market:
• U.S. equities have rebounded following stable corporate earnings; risk-on flows are returning.
• This limits gold’s upside, but does not create strong pressure as the bullish momentum is not too strong.
FED:
• The FED continues to emphasize a cautious policy stance, with no additional rate hikes.
• This keeps bond yields low → supportive for gold in the medium term.
TRUMP (Trump Administration):
• Trump’s policies on boosting manufacturing and cutting taxes continue to create expectations of rising inflation.
• Higher inflation → long-term positive for gold, although it may cause short-term volatility.
Gold ETF – SPDR:
• SPDR has not sold off and maintains holdings around 104 tons.
• The “no selling” stance → neutral to slightly bullish signal.
b) Geopolitics:
• Conditions remain relatively stable over the past 24 hours.
• The market continues to monitor trade tensions and financial conflicts between major economic blocs.
• Any geopolitical disturbance increases safe-haven demand for gold.
c) Market Sentiment:
• Overall sentiment is slightly risk-on: U.S. stocks stable, risk appetite improving.
• However, the market maintains a degree of caution ahead of upcoming GDP and PCE reports.
• Therefore, gold may not rise strongly, but it maintains solid price support and short-term upside.
• End-of-month and end-of-year periods typically see lower trading activity.
2. Technical Analysis:
a) Market Structure:
• Gold remains in a short-term uptrend with a clear sequence of higher lows from the 4029 zone.
• The rising trendline is still intact.
b) Price Action Signals:
• The 15m chart shows a clean bullish pattern.
• A retracement to 4096 may occur before heading higher.
• Upside targets remain toward 4193.
c) Technical Indicators:
• RSI is neutral → suitable for a pullback before continuation.
• MA20 – MA50 expanding upward → reinforces the bullish bias.
d) Main Scenario:
• Pullback to 4096, then bounce upward → targets: 4158 → 4193.
• Strategy is to follow price action at key levels. At resistance zones, always wait for confirmation of breakout or rejection before trading. Favor setups aligned with the main trend.
e) Key Levels:
Resistance: 4158 – 4193 – 4244
Support: 4096 – 4062 – 4029
3. Market Summary (25/11/25):
• GOLD tested the 4040–4060 area and bounced upward according to trend structure.
• Price range was relatively narrow but still maintained a bullish base.
• No major news catalysts; market moved mainly on technicals.
4. Strategy for Today (26/11/25):
🪙 SELL XAUUSD | 4213 – 4211
SL: 4217
TP1: 4205
TP2: 4199
🪙 BUY XAUUSD | 4133 – 4135
SL: 4129
TP1: 4141
TP2: 4147

GOLD opened with a significant increaseOANDA:XAUUSD opened the morning of November 26 with a significant gain, following a volatile session yesterday when the market absorbed two conflicting signals: unexpected progress in Russia-Ukraine peace talks and growing expectations that the Federal Reserve will cut interest rates as early as December.
In the European session yesterday, spot gold fell to a daily low of $4,109.47/ounce, as news that Ukraine had “basically” agreed to a US-proposed peace plan boosted global risk appetite. Market sentiment immediately reflected capital flows out of defensive assets.
However, in the New York session, gold reversed sharply, hitting a peak of $4,159.39/ounce, recovering nearly $50 from the previous low. At the end of Tuesday’s session, gold stood at $4,130.76/ounce, down slightly by 0.1%. By this morning, November 26, the price had returned to the $4,164/ounce area, up nearly 1% on the day.
Geopolitics: Peace Signals Weaken Need for Shelter, But Not Enough to Change the Game
Kyiv has agreed in principle to Washington’s peace proposal, according to US and Ukrainian officials. Some sensitive details remain to be worked out, but many contentious points have been tweaked. The Trump administration’s original 28-point plan has been whittled down to 19, with some provisions “at least worth considering,” according to The Washington Post.
Negotiations began in Geneva on November 23, and both Bloomberg and US officials described the process as streamlined to reach a quick deal. President Trump even declared a peace deal “very close.” This news immediately sent gold prices sharply lower yesterday, demonstrating that the market remains sensitive to geopolitical developments, even when peace signals are still preliminary.
Technical analysis and suggestions OANDA:XAUUSD
Gold price maintains the main uptrend on the daily chart, trading around $4,160/oz within the medium-term ascending channel. The price is currently above the short-term MA21 (~4,056) and has bounced from the support zone around Fib 0.382 (≈3.973); RSI is recovering slightly from the neutral zone, indicating weakening selling pressure.
The 4.128 (0.236 Fib) zone is the first short-term resistance; 4.216 is the key resistance that determines the possibility of opening a new bullish cycle (extremely important). If the price holds above 3.972–4.000 and closes sustainably above 4.128, the possibility of continuing to challenge 4.216 → 4.380 increases. Conversely, a break below 3.972 will weaken the bullish structure and open the door to the 3.846 (0.5 Fib) zone or lower.
Macro backdrop: Fed easing expectations and geopolitical risks continue to be the support base; positive news on interest rate cuts will increase the probability of a breakout above the 4.216 resistance.
BUY XAUUSD PRICE 4235 - 4233⚡️
↠↠ Stop Loss 4239
→Take Profit 1 4227
↨
→Take Profit 2 4221
SELL XAUUSD PRICE 4153 - 4155⚡️
↠↠ Stop Loss 4149
→Take Profit 1 4161
↨
→Take Profit 2 4167

NQ on Major Support Target 36,490Nasdaq 100 index is on major support since September. This is the area you want to buy and as it goes up take some profits if you want for a potential check back into support around early 2027 (green path).
There's the alternative scenario (orange path) that we just trend right up to 36,490 resistance and then have a major pullback to the long term trend. This one is less likely, but possible.
Either way if you sell some of your position (like shorter term options) in the middle of the range you're likely to be in a better position than holding the entire time as eventually that lower trend should get hit and that's a lot of time decay to ruin your positions.
Good luck!

#USDJPY , Second Round ?📌 Market Insight: {#USDJPY }
⚠️ Risk Assessment: {High}
🚀 Approach:
Second Round ? ... Lets see .
Need momentum Structure .... just for QuickScalp
#Ash_TheTrader #Forex #GBPJPY #MarketAnalysis #TradingSetup #RiskManagement #GOLD #Scalper #NQ #EURUSD

XAU/USD ANALYSIS 11/25/20251. Fundamental Analysis:
a) Economy:
• USD:
The USD is slightly weakening due to expectations that the FED will keep rates unchanged and may deliver more dovish signals in speeches this week.
• U.S. Stocks:
Wall Street inched higher last night, with the market leaning toward a risk-on sentiment, which usually weighs on gold. However, the gains were not strong → gold is not under heavy pressure.
• FED:
The FED continues to emphasize a “data-dependent” stance, but the market is starting to believe in the possibility of rate cuts in the coming months. This supports gold in the medium term.
• TRUMP Administration:
The new administration prioritizes economic recovery, deregulation, and tax cuts → which may stimulate the stock market, but geopolitical risks still linger → gold benefits whenever volatility rises.
• Gold ETF (SPDR):
SPDR has been buying and selling alternately with no clear trend. However, recent selling volume is not large → no major bearish pressure on gold. On Nov 24, the fund bought 0.29 tons—small, likely probing while waiting for upcoming news and market reactions.
b) Politics:
Tensions in the Middle East remain unresolved; additionally, U.S.–China trade competition still holds the potential for new conflicts → gold maintains its safe-haven appeal.
c) Market Sentiment:
The market is slightly risk-on, but within a narrow range and lacking strong momentum → reversal risks are always present.
The “waiting for FED this week” sentiment makes gold move more technically.
2. Technical Analysis:
The 30-minute timeframe gives extremely clear signals:
• Price has broken above the descending trendline extending from the Nov 17 high.
• A new uptrend (short- to medium-term) is forming.
• Extended targets if momentum holds: 4,244 – 4,276.
• RSI is in the mid-high zone but not overbought → still room for upside.
• MA20 has crossed above MA50 nicely, supporting the bullish trend.
Overall: Gold is likely retesting the breakout and continuing the upward trend.
RESISTANCE: 4,193 – 4,244 – 4,276
SUPPORT: 4,096 – 4,040 – 4,029 – 4,000
3. Previous Market Session:
• Gold surged strongly from the 4,040 zone, breaking the descending trendline and the ascending triangle.
• Price closed above all short-term EMAs → buying pressure dominates.
• Volume increased during the breakout → confirming the trend.
4. Strategy for Today (Nov 25, 2025):
🪙 SELL XAUUSD | 4195 – 4193
SL: 4199
TP1: 4187
TP2: 4181
🪙 BUY XAUUSD | 4084 – 4086
SL: 4080
TP1: 4092
TP2: 4098

GOLD market after “Fed fever”, growth momentum is challengedOANDA:XAUUSD prices remain in the spotlight as the market has been experiencing a series of strong fluctuations following mixed signals from the Federal Reserve and labor data. However, developments show that the risk of price declines is increasing as the precious metal has repeatedly failed in its efforts to hold the $4,100/ounce area, the first resistance level of this year's hot period.
For most of 2025, gold has risen more than 55%, despite high bond yields and a strong dollar. But as the Fed’s final policy meeting approaches and the market lacks consensus on the path of interest rate cuts, the traditional correlation between gold, interest rates, and the dollar is returning. According to CME’s FedWatch, the market still expects a more than 70% chance of the Fed cutting interest rates next month, while economists maintain a more cautious assessment of only about 50/50.
This puts the upcoming economic data in a decisive position for both market expectations and gold’s stability in this trading week.
Fed’s Dovish Return: A Direct Impact on Gold’s Upward Momentum OANDA:XAUUSD
Gold settled in the first half of the week as demand for havens increased, while the ADP report showed that the private sector cut an average of 2,500 jobs per week in the four weeks to November 1.
The 4,000 USD/ounce level continues to be the key threshold determining the short-term trend, as the market is moving within a correction zone but has not yet broken the medium-term bullish structure.
Technical analysis and suggestions OANDA:XAUUSD
1. Price Structure & Overall Trend
• Price is still within the ascending channel that has extended since August, although the range has narrowed compared to October. The October peak around 4,128 USD acts as a major medium-term resistance.
• The current decline is still only a pullback within the uptrend, as long as price holds above 3,972 USD (Fib 0.382) and especially the 4,000 USD psychological & technical support.
2. Key Technical Zones
• Nearest resistance: 4,128 – 4,216 USD
(A strong resistance cluster where price has been repeatedly rejected in November.)
• Nearest support: 4,055 – 4,000 USD
(This zone aligns with Fib 0.382 and the short-term bottom.)
• Deeper supports:
3,846 USD (Fib 0.5) – Important for a deep pullback scenario
3,720 USD (Fib 0.618) – Reaction support in case of strong macro volatility
3. Price Momentum – RSI
• RSI has moved out of oversold territory but remains weak and has not re-established a bullish structure.
• The RSI-MA21 is flat → the market lacks strong momentum; sideways movement or a retest of the 4,000 USD zone is highly likely.
4. Short-Term Outlook (Next Week)
• Market bias: Neutral to slightly bearish, but the medium-term uptrend remains intact.
• Price is likely to retest 4,000 USD, then form one of two scenarios:
o Hold 4,000 → rebound to 4,128 – 4,216 USD
o Break 4,000 → drop to 3,972 – 3,846 USD
👉 Conclusion: 4,000 USD is the decisive level for the short-term trend.
BUY XAUUSD PRICE 4102 - 4100⚡️
↠↠ Stop Loss 4106
→Take Profit 1 4094
↨
→Take Profit 2 4088
SELL XAUUSD PRICE 4016 - 4018⚡️
↠↠ Stop Loss 4012
→Take Profit 1 4024
↨
→Take Profit 2 4030

XAU/USD ANALYSIS 11/24/20251. Fundamental Analysis:
a) Economy:
• USD:
The USD is stabilizing after a recent period of weakness as markets expect the Fed to maintain lower interest rates in 2025, reducing pressure on gold.
• US Stock Market:
U.S. equities are seeing slight corrections, reflecting cautious sentiment ahead of this week’s FOMC minutes. When stocks stall, gold often benefits.
• FED:
Recent weak economic data has increased expectations that the Fed will cut rates earlier in 2025. Any dovish signals from the Fed will support gold prices.
• TRUMP Administration:
The Trump administration is considering a new economic stimulus package and adjustments to import taxes. Protectionist-leaning policies may cause volatility in the USD, but generally increase safe-haven demand — supporting gold.
• Gold ETF (SPDR):
SPDR has recently shown mixed buying and selling, indicating capital flows are not yet surging but also no longer experiencing heavy outflows. This is a neutral signal but slightly supportive of price stability.
b) Politics:
Tensions in the Middle East and concerns about the upcoming EU elections keep defensive capital flows active. These factors help support gold and limit the risk of deep declines.
c) Market Sentiment:
The market is in a mild risk-off state, with capital shifting toward safe assets, though not strongly yet. This aligns with gold maintaining its base and having the potential to break out if key technical levels are breached.
2. Technical Analysis:
• Price is maintaining a long-term uptrend line from early November.
• A compression triangle pattern has been broken to the upside — a clear bullish signal.
• The 4,064 level is a key retest zone currently being tested.
• If this zone holds, upside targets will expand.
• RSI on the M30 timeframe is in a balanced zone, not overbought — favorable for further upside movement.
Conclusion: The trend leans bullish as long as price does not break below the trendline and the 4,029 zone.
RESISTANCE: 4,096 – 4,125 – 4,193
SUPPORT: 4,029 – 4,000 – 3,964
3. Yesterday’s Market (21/11/25):
• Gold fluctuated strongly from the 4,029 support area and bounced back along the trendline.
• Buyers dominated late in the session, setting up a foundation for today’s recovery.
• Volatility has been narrowing, signaling a potential breakout.
4. Strategy for Today (24/11/25):
🪙 SELL XAUUSD | 4147 – 4145
SL: 4153
TP1: 4137
TP2: 4129
🪙 BUY XAUUSD | 3964 – 3966
SL: 3960
TP1: 3972
TP2: 3978

GOLD MARKET ANALYSIS AND COMMENTARY - [Nov 24 - Nov 28]This week, the international OANDA:XAUUSD price continued to hold above the support level of 4,000 USD/oz, but the risk of price decline is increasing due to geopolitical tensions and expectations that the FED will cut interest rates at the December meeting is not enough to create a strong rebound for gold prices.
The gold price next week may continue to fluctuate in a narrow range, waiting for US economic data to clarify the FED's interest rate reduction roadmap.
Retail sales and producer price index (PPI) reports, along with other data due next week, could help us get a better idea of the US economic situation. If the US economic data is below expectations, it could increase expectations for a Fed rate cut in December, pushing gold back above $4,100/oz next week. However, if these data continue to reduce expectations for a Fed rate cut, gold could break the important support level of $4,000/oz next week, opening the door to $3,845-$3,800/oz.
However, in the long term, gold prices are still expected to continue to rise as central banks continue to buy, although the pace of buying may slow down due to the high gold price. Moreover, gold has proven its value, even when compared to other stores of value such as cryptocurrencies, due to the sharp decline of bitcoin and many other cryptocurrencies. Therefore, the appeal of gold is still very large and has no rivals in the financial investment environment.
📌Technically, on the H4 chart, an important support level is established around the 4,000 USD/oz threshold. If this level is broken, the gold price is at risk of falling deeply to 3,900 or even 3,850 USD/oz. In case the gold price forms a double bottom pattern at 4,000 and breaks through the 4,132 resistance level, there is a chance to recover above the 4,200 USD/oz threshold.
SELL XAUUSD PRICE 4176 - 4174⚡️
↠↠ Stop Loss 4180
BUY XAUUSD PRICE 3964 - 3966⚡️
↠↠ Stop Loss 3960

E mini S&P 500 weekly outlook and HTF reference pointsCME_MINI:ES1!
Expansion levels on ES. Will approach on a day to day basis with the daily closures

Emini Nasdaq 100. Important Areas to look for and Weekly outlookCME_MINI:NQ1!
Highlighted the important levels. what to look for how we can approach the next week in terms of higher timeframe reference points

From Shutdown Relief to AI Anxiety — Two Narratives Driving ESMarket Theme
The week began on a strong footing, driven by a bullish Sunday reopen in ES after news broke that the 43-day government shutdown was set to end, following the Senate’s late-night support for a potential agreement on November 9th. This relief catalyst created early upside momentum, pushing the index toward all-time highs (ATHs).
However, the tone shifted mid-week. The rally lost steam as markets refocused on a growing concern: the sustainability of current Tech and AI valuations. Investors are becoming more sensitive to the possibility of overstretched AI-related capital expenditure and an emerging bubble narrative, especially with heavyweight earnings and forward-guidance looming. This led to a rotation out of high-beta tech and into safer or less-extended sectors.
On the macro front, Fed speakers adopted a more cautious—if not outright hawkish—tone, emphasizing that a December rate cut is far from assured. The recent government shutdown created a backlog in key economic data releases, leaving policymakers and traders alike without clear visibility into the true state of the economy. The lack of data has amplified uncertainty and reduced the market’s conviction around the timing of any potential policy easing.
In short:
The market is caught between two opposing forces:
The optimistic narrative (shutdown resolved, path to ATHs, resilience in U.S. growth), and
The risk narrative (valuation excess, policy uncertainty, narrowing breadth).
This push-pull dynamic has resulted in compression rather than continuation, with a heavy focus on clarity from upcoming data and major earnings.
What is the Market Doing?
Last week formed an inside week, with the entire range trading within the prior week’s range and settling close to the previous week’s close. This signals indecision and balance, as neither buyers nor sellers had the conviction to push the market into expansion.
Current price action shows the market compressing between:
6875 — previous week’s VPOC / 27 Oct weekly VAL
6740— 13 Oct weekly VAH / 10 Nov weekly volume ledge
These levels are well-defined and respected. The upward trendline continues to hold, with multiple strong rejections signaling responsive buyers stepping in to bid prices back up.
The battle is now between buyers attempting to defend 6740 area which is also confluent with the daily trendline support, and sellers leaning on the overhead resistance close to 6875.
What to Expect in the Coming Week
The key line in the sand (LIS) this week:
→ 6755.25 — Previous week's settlement
Bullish Scenario
If 6755 holds as support, expect buyers to attempt a push toward:
6874.50 — previous week's VPOC
6905.5— weekly 1-SD volatility high
Anticipate responsive sellers in this area.
However, if price breaks above 6874.50 with pace and volume and accepts above it, the path opens for a retest of the ATHs as momentum players and trapped shorts fuel continuation.
Bearish Scenario
If the market accepts below 6755 and fails to reclaim it on any pullback:
First downside target: 6660 — 13 Oct weekly VAL
If buyers fail to respond there, expect an acceleration lower from long liquidation toward:
6605— weekly 1-SD volatility low
6504 — previous month's low (deeper target)
This scenario strengthens if the trendline breaks and sellers begin stepping down aggressively.
Neutral / Compression Scenario
If the market remains trapped between 6875 and 6740 with no breakout supported by pace and volume:
Expect two-way rotational trade
Continued compression and balance within the well-defined range
A buildup of energy that may resolve later in the week with data, earnings or fundamental catalysts
Conclusion
As we start the new week, ES remains tightly coiled between well-defined levels, with the market waiting for clarity from data, earnings, and policy signals. Whether we break from compression or continue to balance, the key will be how buyers and sellers respond around 6755 and whether there are new fundamental catalysts.
As always, I’d love to hear your view on the markets and ES this week? — Drop it below — and give it a boost so more of the community can join the conversation.
Glossary Index for all technical terms used:
VAH (Value Area High)
VAL (Value Area Low)
VPOC (Volume Point of Control)
SD (Standard Deviation)
