USDJPY Wait For The Beak!The Bank of Japan just hiked interest rates by 25 bps to 0.75%, the highest level in ~30 years. FED lowering while BOJ raising rates is bad juju for the carry trade.
Why carry risk is rising
BOJ hikes = funding cost up. Yen is no longer “free money.”
Fed cuts = yield advantage shrinking. The whole carry equation weakens.
Compression kills carry. You don’t need parity — you just need the gap to narrow.
What actually breaks carry trades
Not the BOJ hike
Not the Fed cut
The moment markets believe the trend is durable
Carry trades die on expectations, not announcements.
Keep an eye out for the breakout.
If carry breaks, bad juju for Crypto & AI trade,
Fxtrading

EURUSD Bullish Breakout IncominEURUSD shows a clear liquidity grab near demand, forming higher lows and compression—expect a bullish expansion toward 1.1760–1.1800 if price holds above 1.1700.risk managment is important


BTCUSD Supply Zone Rejection | Bearish Continuation SetupBTCUSD rejected from supply zone and broke the ascending channel. Bearish momentum suggests a move toward lower demand areas.Risk Management (Very Important)

XAUUSD Bearish Setup | Supply Zone RejectionXAUUSD rejected from supply zone and trading below resistance. Bearish structure remains valid, with price likely to move toward the next demand zone if support breaks. Trade with confirmation and proper risk management.

EURUSD at Key Supply Zone – Shorts AheadEURUSD is reacting from a strong supply zone after taking buy-side liquidity. Price shows rejection and potential lower-high formation, suggesting a bearish continuation toward demand zones. Waiting for confirmation before entry. Trade with proper risk management.

Gold Is Pressing the Old ATH — The Final Break Looks ImminentMARKET BRIEFING – XAU/USD (4H)
Market State:
– Gold is in a strong bullish continuation structure, forming higher lows along an ascending support while compressing directly beneath the old ATH at 4,380.
– This is bullish stair-step price action, not exhaustion buyers are accepting higher prices on every pullback.
Key Levels:
– Old ATH / Decision Zone: 4,360 – 4,380
– Structure Support: ~4,260 – 4,270
– Trend Support (Ascending): intact
– Upside Objective: 4,450 → 4,500 (New ATH)
Price Action:
– Repeated rejections below ATH are getting shallower, signaling supply absorption.
– Each pullback is met with faster buying, confirming strong demand control.
– Compression against resistance = breakout pressure, not distribution.
MACRO CONFIRMATION – WHY THIS BREAK HAS BACKING
1. Fed Policy Caps the Downside
– The Fed remains on hold, with markets pricing future easing rather than further tightening.
– Real yields struggle to move higher → historically bullish for gold.
2. USD Lacks Follow-Through
– The Dollar fails to trend despite elevated rates a late-cycle signal.
– This reduces headwinds for gold near key resistance.
3. Persistent Safe-Haven & Central Bank Demand
– Geopolitical risk and fiscal uncertainty remain unresolved.
– Central banks continue to accumulate gold, reinforcing structural demand beneath price.
4. Liquidity Inflection Favors Hard Assets
– As global liquidity stabilizes, gold tends to lead upside expansions before other assets react.
Next Move:
– Holding above 4,260 keeps the bullish structure intact.
– Acceptance above 4,380 opens clean price discovery toward 4,450–4,500.
– Any dip into ascending support is a continuation setup, not a reversal signal.

Altcoin Market Cap Building Energy Before Next ExpansionThe total crypto market cap excluding the top 10 continues to follow a familiar cycle of accumulation, breakout, expansion, and consolidation. After strong moves, the market typically ranges for a period before the next leg.
Currently, it is consolidating within a wide range, similar to past phases before major expansions. This suggests the market is building energy, not distributing.
A breakout above the range could trigger the next expansion phase for altcoins, while patience is needed until that happens.
NFA
Please hit the like button if you like it, and share your views in the comments section.

Gold Bulls in Control | XAUUSD Trade IdeaXAUUSD remains bullish 📈 Price is consolidating above key support after a strong impulsive move. A healthy pullback into demand could offer buy opportunities, targeting previous highs and the upper supply zone. Bias stays bullish unless support breaks. Trade with proper risk management.

Ready for Big Move | Liquidity Sweep Setup Explained📌 Market Structure Update:
Gold is currently trading inside a tightening triangle pattern, showing clear liquidity grabs on both sides. After yesterday’s strong drop, price tapped a key demand zone and reacted aggressively. Now the market is moving between well-defined supply & demand zones, giving both bullish and bearish setups.
🔶 Key Observations
🟫 Major Supply Zone (Top Zone)
Price previously rejected strongly from this area, showing sellers are active here. If price retests this zone again, expect another possible sell reaction.
🟨 Intraday Supply Zone
A smaller supply just below the major zone. Price may spike into this area before giving downside continuation or bull trap.
🔷 Triangle Structure
Price is squeezing between diagonal support & resistance. A breakout is coming soon.
📉 Bearish Scenario
Failure to break the triangle top or rejection from the yellow zone may push price back into demand, and a break of the blue support could target the 4,180 liquidity zone.

EURCHF 1D EURCHF shows a clean technical structure that rarely deceives a focused trader. After a strong impulse price reacted precisely at the 0.786 Fibonacci level at 0.93884 confirming strong demand near the upper boundary of the range. The current setup suggests a pullback toward the 0.5 Fibonacci level at 0.93123 which forms the optimal continuation zone. As long as price maintains this area the trend remains bullish and limits the risk of a deeper correction. Once the market stabilises above the Fibonacci cluster the first target stands at 0.94419. The second target at 0.96107 reflects the natural extension of the current impulse. Volume supports buyers and creates favourable conditions for a sustained move higher. The logic here is simple the market pauses only to regain strength for the next leg.

Critical USDT.D Test: Altcoin Relief or More Pain?USDT dominance is pushing into its long-term trendline resistance again. If this level rejects, it usually signals fresh money rotating back into altcoins.
But if USDT.D breaks out and holds above the trendline, it could put pressure on alts and slow down their momentum.
This is a key spot for the altcoin market.
DYOR, NFA
Please hit the like button if you like it, and share your views in the comments section.

BTC at Risk: Structure Break + RSI Warning$BTC/USDT is showing some concern on the monthly chart as price has broken below the rising wedge and is now retesting a major demand zone. Losing this zone could trigger a deeper correction.
At the same time, RSI is showing a clear multi-year bearish divergence, highlighting weakening momentum.
Until BTC reclaims the wedge support or closes back above the resistance band, downside risk remains elevated.
DYOR, NFA
Please hit the like button if you like it, and share your views in the comments section.

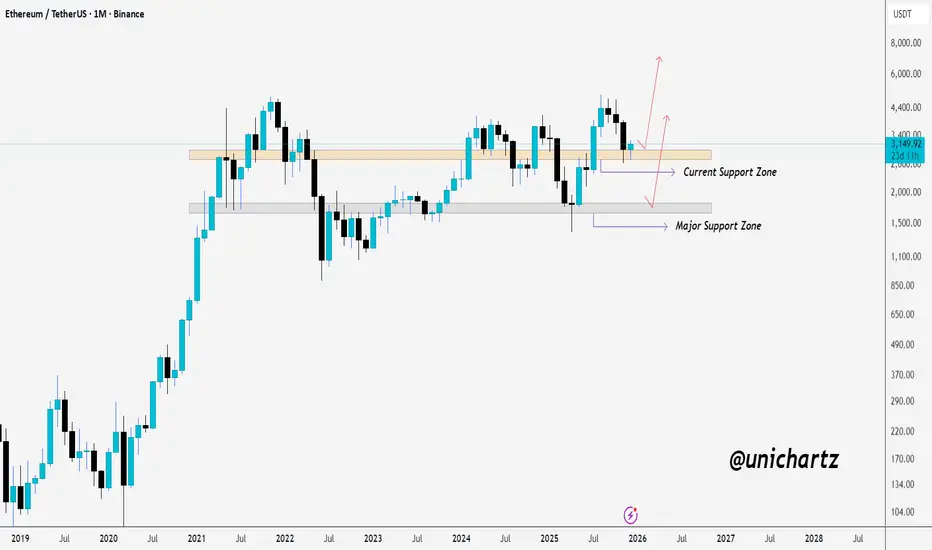
ETH Monthly Structure Intact Above SupportCRYPTOCAP:ETH is holding its monthly support zone once again, showing buyers are still defending this level.
As long as the price stays above this area, the structure favors a bounce toward the upper range.
A breakdown, however, would shift focus to the major support zone below.
DYOR, NFA
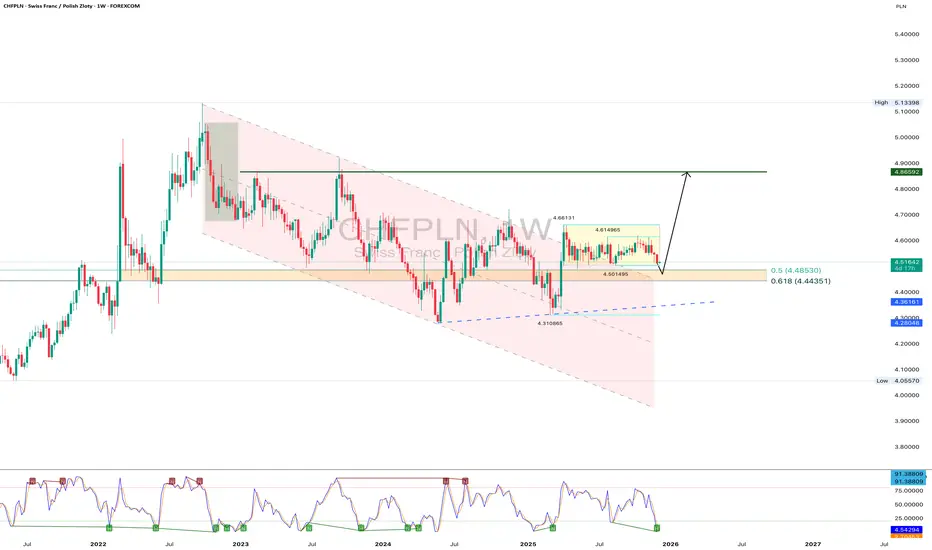
CHFPLN preparing a move or just testing everyone patienceCHFPLN continues to trade inside a developing upward structure after breaking out of a wide descending channel. The current pullback has brought the pair into the demand zone between 4.48 and 4.44 which aligns with the Fibonacci correction range at 0.5 and 0.618. Weekly oscillator divergence signals active buyers defending the lower boundary of the structure. The horizontal level at 4.50 also acts as support increasing the probability of a local reversal. As long as price holds above 4.44 the bullish continuation scenario remains valid. The main target is located near 4.86 which corresponds to the key resistance of the previous pivot. A breakdown of 4.44 may trigger a deeper correction however current price behavior and buyer reaction still favor a recovery.
The market may pretend nothing is happening yet demand zones rarely forget what they are designed to do.
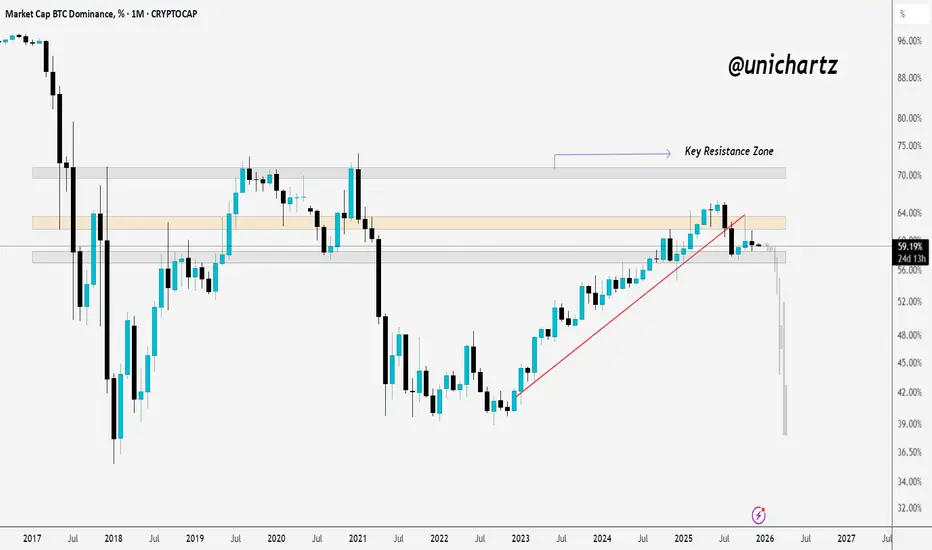
BTC.D Rejected From Key Monthly ResistanceBTC dominance is still sitting below the key monthly resistance zone, showing clear rejection from the top.
As long as dominance stays under this area, it suggests money isn’t aggressively flowing into BTC, leaving room for altcoins to stabilize or gain some strength.
A breakout above the resistance would shift momentum back toward BTC, but for now the structure looks capped below this zone.
DYOR, NFA
USDJPY Breakout Below Key Support – Bearish Momentum BuildingUSDJPY – Key Levels Breakdown & Breakout Outlook
Price has been consolidating within a tight range, and today we finally saw a clean breakout below the red support zone, signaling potential bearish momentum. The market rejected the strong support area above (highlighted in green), confirming sellers are in control for now.
🔍 Key Zones to Watch
Breakout Zone (Red): Recently broken. Price is now trading just below it, showing early signs of continuation.
Strong Support (Green): Previous demand zone where price repeatedly bounced. Now acting as a potential retest level if price pulls back.
Strong Resistance (Yellow): A deeper downside target if bearish momentum continues.
Breakout Target Area (Upper Green): If buyers regain control, this is the zone price may revisit.
📌 Trading Outlook
Bearish bias as long as price stays below the breakout zone.
A retest rejection at the red zone could offer a clean continuation setup.
If buyers push price back above the breakout level, we may see a move toward the strong support or even the breakout target area above.

XAUUSD Long - 04/12/25This is a trade I am currently in.
Entry was on a 1-minute order block. Aiming for previous 1hr tf high at 4240.

Altcoins Get a Boost as ETH/BTC Breaks StructureETH/BTC breaking out of the falling wedge is a positive sign for the altcoin market.
When this pair starts gaining strength, it usually boosts overall altcoin performance.
If ETH holds this breakout, it could ignite a broader altcoin rotation in the coming sessions.
DYOR, NFA
#PEACE
Please hit the like button if you like it, and share your views in the comments section.

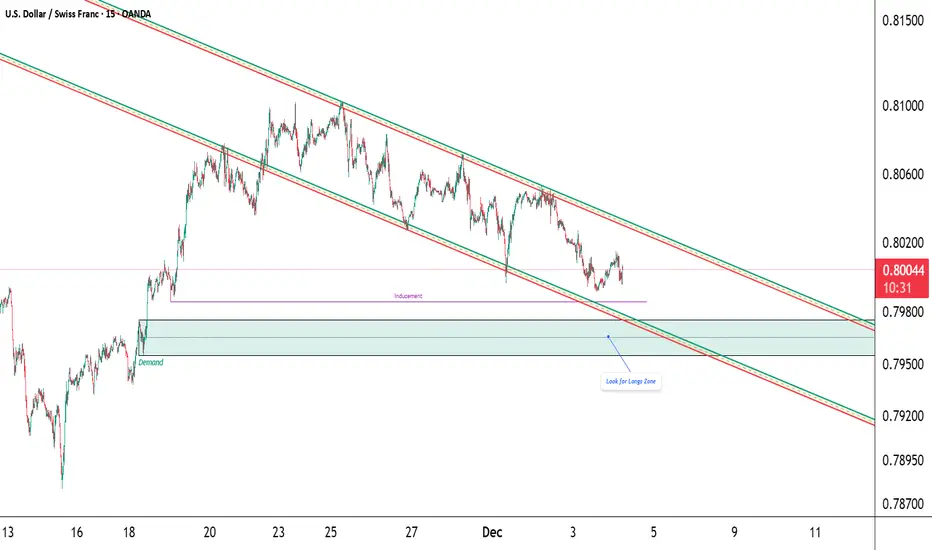
USD/CHF – Watching for liquidity sweep into origin demandPrice is trading inside a clean descending channel.
Below current price sits untouched inducement — a liquidity pool that lines up perfectly with the origin demand zone where the previous impulsive rally started.
If price sweeps that inducement and taps the demand zone, I’ll look for confirmation (MSS + FVG/OB) for a potential move back toward the channel midline or upper boundary.
Bias: Bullish upon sweep + tap
Invalidation: Clean break below demand
Confluence: Channel low + origin demand + resting liquidity
Not financial advice.
SOL Near Inflection PointCRYPTOCAP:SOL is holding well above the mid S/R zone and showing solid strength. If it continues to rebound from this area, price could push back toward the upper resistance.
But if SOL breaks below this zone, it may slide down toward the $80 levels.
DYOR, NFA
Please hit the like button if you like it, and share your views in the comments section.

LINK Showing Strength at Long-Term Support ZoneBIST:LINK is bouncing cleanly from its long-term weekly trendline support, keeping the bullish structure intact.
Price is still moving inside a large wedge, and if this rebound continues, a retest of the upper resistance line is likely.
A breakout above that level could open the door for a stronger move.
DYOR, NFA
Please hit the like button if you like it, and share your views in the comments section.
