Goodbye GME#gme has fallen out of an equilateral wedge, accumulation is at all time lows on daily, no float is actually a bad thing in this situation despite what WSB thinks, and finally it has laddered into an accelerated downtrend (marked in yellow), I have been loading puts for awhile, looks like this validates it, you can still easily enter this if you want, the game is over, next stop is the 160s.
P.S. to self titled apes, I was long gme too, in January, I took my profits towards the peak in Feb, that was the squeeze, I can't tell you what to do with your money, but personally I would exit while I could, if you still believe it is going to squeeze your few shares aren't going to make it happen, so take your risk off and if it rockets just get back on, it has to break back into the trendline heading up at the bottom of this wedge for that to happen. Live to fight another day is the key to this market. I wish you all the best.
Gamestop

GME HISTOGRAM SIGNALthree black bars from the valley below the midline
todays bar is yet to be printed
just another way to look at the price action
other factors should be considered
just an observation
not financial advice

Perfect falling wedge on $IGT Perfect falling wedge on $IGT , it has the potential to move higher , add it to your watch-list.
Entry after it successfully break above the wedge .Target is $26 and higher.

GME Short-Term TAShort-term TA (1-2 weeks).
We should be seeing a gradual movement upwards seeing as the past 2 days we have seen the price bottom out on the descending channel floor and was rejected twice (Double Bottom).
The price should be testing the 50 day EMA and 200 day EMA on both the 15 minute and 2hr timeframes (just my preferred timeframes).
The ceiling right now is around $208-210 with the 200 day EMA 2hr @ $210.91
Price has also respected the Fibonacci Retracement calculated support levels of 61.80% / $186.09 and continued up. The 50th percentile calculated resistance is $242.78 which would sufficiently confirm a break out of the descending channel consolidation; or cup and handle formation.
In the short term '15 min timeframe', we see the MACD is about to crossover bullish, so potentially we could see some movement upwards today.

GME bottom confirmed!!! BUY BUY BUY! great time to buy confirmed bottom. last time i buy 160, drop to 140 is better bottom. This time i think its 200 but 180 is better bottom. But i jumped the gun and bought at 216 bec of fomo! Now is perfect time to buy bro buy buy buy and get your NFT dividend next weeeeeeeek babbbbbbbbbbbbbbbbbbbbbbbbbbbbbyyyyyyyyyyyyyyyyyyyyyyyyyyyyyyyyyyyyyyyyyyyyyyyyyyyyyyyyyyyyyyyyyyyy. LFG!!!! GME GME GME GME GME GME GME GME

GMETouching the support, maybe a bounce from here in direction to resistance, this is a good zone for bought (be careful)

GME reached important support levels. Is the bottom in?GME reached the 200 MA on the 8h + extended hours, it hit the S3 weekly, the diagonal support, a VP HVN and it managed to get into an area that was previously resistance (currently turned into support). So to me this either is the bottom, or GME is in trouble. This is a massive combo and the structure of GME in the long term is still bullish. In my opinion the double top at 340 has a change to break and is what has me quite bullish.
Of course there are several issues in the global economy, meme stocks haven't been doing well and so on... but this doesn't mean that we can't see another big rally. That requires that things don't crash right now and that we stay in a bullish environment for stocks... which over the last few weeks/months has been turning bearish and mostly favoring large caps. Going long here isn't a bad choice imho with stops below 160, otherwise wait for the market to close above 220 to start looking for longs.

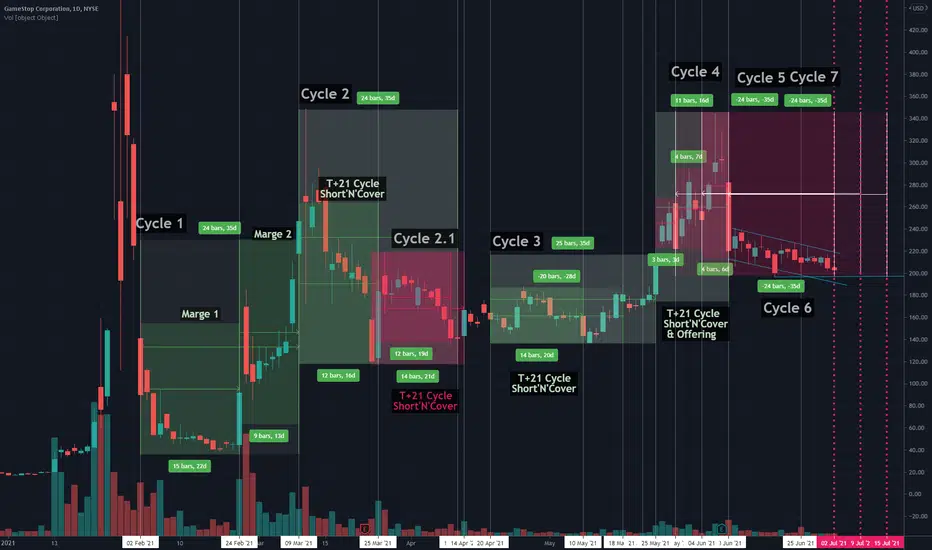
$GME - Alt T+21-35 cyclesHere's what i think the cycles really look like. I don't like it when people just arbitrarily pick a place and start counting equidistant T+21 and T+35 forever and call it "The Cycle".
Instead i've gone ahead and arbitrarily picked my own dates and have drawn my own sort of equidistant T+21 and T+35's.
Believe what you want in the end. I've come to the conclusion that this is what the cycle looks like and not exactly like how everyone else visualizing it. I've used option flow data to find anomalous option data and based some of these cycles on those, on the 2 ATM offerings, DFV's exercise as well as the 2 market buy ins that happened sometime in Feb/March. Tldr: I didn't pull these out of my arse.
I'd love to sit and write my whole thesis here on how i've come up with this, but because i've in fact already written it elsewhere, i'm just going to link to there...
www.reddit.com
www.reddit.com
I'd paste this content here but the format would break a lot so... if you wanna know how i come up with this stuff, just read those 2 links or whatever. Anyway i think that people are counting T+21 and T+35 from the wrong place and are also too adamant about things happening on exactly T+21 and T+35 where that shouldn't be people's expectation. The T+'s are deadlines. People should be expecting things to happen BEFORE a deadline, not exactly on the day of the deadline and that's the mistake everyone is making when trying to visualize T+21 and T+35.
In reality, the cycles are much more dynamic than people are making them up to be. There's things like ATM offerings for more shares happening which just disrupt any existing cycles. For whatever reason, people aren't even taking these real life / fundamental things in consideration when counting T+21 and T+35. It's like doing raw technical analysis on a company you don't know, yes the technical analysis might show a bullish wedge, but you didn't consider the real life news that the company released saying they're going bankrupt... So yeah, if you don't factor these things in, you're just counting T+21 and T+35 from random meaningless points on a chart to other random meaningless points on the chart.
My visualization of the cycles whilst looking complete, it's really not. There's a lot more micro cycles i would've loved to add, but the chart would be come too convoluted for anyone to understand. The idea however is that within the T+35's, there's also multiple T+21's ending. You can identify these by the Short at T+18 and cover at T+21 patterns all over the chart. You'll see a lot of random large downward daily spikes, then an equal spike 1-3 days later which is the net 0 short cover. The only reason they drop the price here is to kick the can with options by hiding FTD's in far OTM puts in the $0.5 - $5 range (and maybe in the $0.5 - $50 range) then proceed to cover their net 0 short a few days later.
The behavior of the shorts is extremely visible on the chart, you just need to be able to identify their patterns correctly and i think i've for the most part done that.
GameStop (GME) • Gravity steps in soonI think GameSpot is done. We are going to see significant pullback from here.
Volumes are looking exhausted and there is no more steam to prop this up. All depends on the short interest and institutional interest to squeeze shorts up.
Overall there are several good reasons why this should go down (hard) while only one for this to move up.

"FORGET GAMESTOP"... I set my share price. I decide when to sell my shares.
Buyers at those crazy levels? yes.
DTCC computers burning hot trying to buy every single share available in the market.
When shorts start to cover the ticker will move up and up and up... and those are the levels that i am looking for:
1250 - GME surpasses Wolkswagen short squeeze.
3141.45 - GME surpasses Amazon all time high.
6969.69 - SEC will finally pay attention to GME as we hit a porn number.
42069.69 - GME hit a meme number and become the meme king stock.
208571.00 - You can sell 1 share of GME to buy the cheapest Lambo in USA.
420420.69 - GME hit another meme number and surpasses BRK, become the most expensive stock class A in the world.
20000000 - Infinite Pool ...
Guess that if we follow MSM advice and forget about Gamestop the infinite pool is a certain thing.
The power of HOLDING.

GME - Very BullishBlueWave is going to give a green dot buy signal any moment
Stochastic RSI is oversold
GME is on the Fib support trend line. (the best time to buy)

GME MOASS SHORT SQUEEZE INCOMINGPlease note i am not a licensed advisor. I study charts with my free time. Im sorry but there is no other way to say it except GME ROCKET INCOMING.
This may be the last couple weeks give or take to get GME at a significantly low price. I myself will be buying.
I hope you all have a blessed weekend!

$GME My short term DD for GameStop!I am no financial advisor. I only like the stock. GME has formed a beautiful cup and handle formation. i would like to think the other side of the handle is coming by next week. that is all.

GME Bullish pennant breakout?It looks like it's getting out of bullish pennant.
Waiting for the confirmation here.
It can break the trend on MACD and Divergence Indicators. RSI + MF are looking quite good. If it breaks over the resistance it's going to fly again.
After the last drop I've predicted in the linked idea I think this is the moment to look for an empty seat on the train.
Good luck guys!

GME TEST OF BREAKOUTsymmetrical triangle breakout now testing support
the casino is closed for today
not financial advice

3angel pattern on AMC stock personaly i am germany dax index trader,i dont have any order on AMC =fair analyse
advice= buy stop on high and wait 20-30 day to 94$ ok? now you can sell low size but 100% put SL on high
green arrow=powerful buylimit place sl=3.00$ ,for buy and hold longterm
note=we belive if AMC break high,can go to 125$(can take 8 month)
good luck,,if you win,see me COIN CHEER from my profile
AFTER 14 year daily 12 hour trade ,i dont recomand stock trade(high risk ,good for long term) , i advice trade gold futures GC1! easiest instrument,very very trendy

Gamestop - GME - Testing $200 support - Will It Hold?Gamestop - GME - Testing $200 moving average support and 61.8 fib support - Will It Hold? We will see?

$GME - T+35 Cycle UpdateMy previous date targets were: 30 June, 1'st of July and 2'nd of July.
My new date targets are: 29 June give or take a day.
Sorry no time to post more and explain. Got a lot of data to sift through and DD to write.

AMC's Bullish Pennant Breakout ScenarioAMC has been consolidating for more than 3 weeks now.. we've found major support at the $50 level and continue to ride the waves. It is only a matter of time before this pennant breaks out. This isn't over just yet, we are priming up for something big very very soon.. and it always happen when we least expect it.

The battle for GamestopI don't believe GME is a coincidence, not with each arc of the story being revealed in such perfect symmetry.
See my last idea of an inner and outer symmetrical triangle breakouts .
Player 1: The Shorts . Hedge Funds, Mainstream Media and Wall Street Banks.
Player 2: The Longs . Michael Burry, Roaring Kitty, Ryan Cohen, Gamified Retail Traders and Apes in Spaceships.
This idea is a large symmetrical triangle pattern with two converging trend lines. The breakout price at $250 in August with an upwards target of $728 and a downwards breakout of 0.
The date lines are a T+21 cycle from DD found on /r/wallstreetbets and /r/superstonk.
Sun Tzu:
If it is to your advantage, make a forward move (Buy GME); if not, stay where you are (Hodl GME).
Move when there is advantage to be gained (Buy the Dip) and where this outweighs the ever-present risk of moving (covering shorts).

GME it's not over.GME is showing a herculean effort to smash the shorts in the face, even after multiple runups it refuses to tire out, get in on this because this one is likely to be massive. I must admit I personally do not like this stock, but I don't fight the market. May take a couple weeks to break out since this is on the daily, I am not a fortune teller. Make sure if you play options you account for IV crush that will inevitably happen.


GME is looking BullishGME is close to its Fib support line. Which is a great buy zone.
Stochastic RSI is Oversold (Great)
