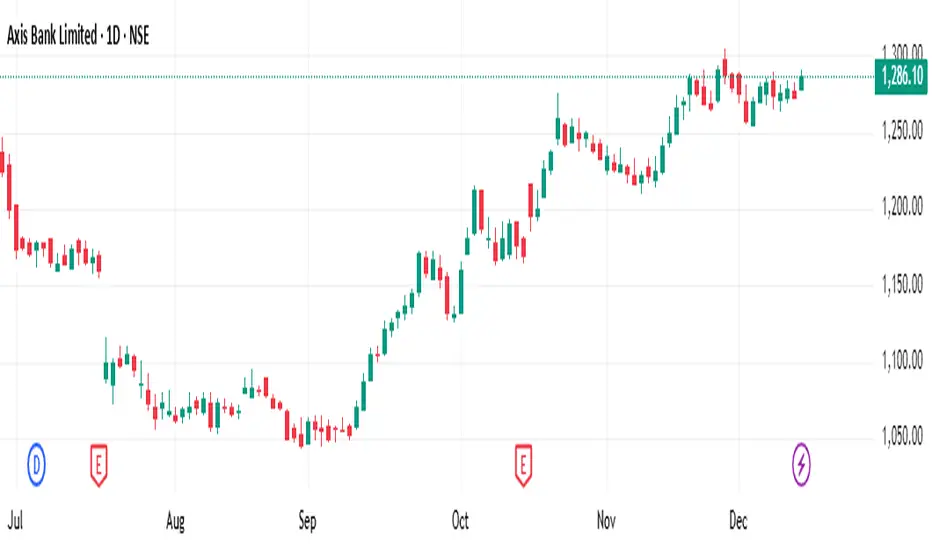
Price Reaction Near 45 Degree Level | Axis Bank | 8 Nov 2024Case Study: Price Reaction at a 45° Level (Axis Bank – 8 Nov 2024)
This post presents a simple case study on how geometric levels, particularly the 45° projection, can influence intraday price behaviour.
On 8 November 2024, Axis Bank approached a projected level based on a 45° calculation derived from the Square-of-9 method.
The key projection came near 1168, and the market showed a clear rejection from that zone during the afternoon session.
What This Case Demonstrates
• Start from the intraday low to determine the 0° base
• Track the instrument’s normal movement capacity along the 45° path
• Observe time sensitivity—reactions often happen near time windows
• A rejection at a geometric level can act as a technical confirmation for intraday setups
This example highlights how combining structure, geometry, and time can help traders add clarity to intraday decision-making.
Note
This post is for educational discussion of chart behaviour. It is not advice or a trade signal.
Gann
Global Market Participants1. Retail Investors
Retail investors are everyday individuals who invest their personal money in the financial markets. They trade through online brokers, mutual funds, pension plans, or mobile trading apps.
Characteristics
Small trade size compared to institutions
Often trend-followers
Decisions influenced by news, social media, and emotions
Usually have medium-to-long-term investment horizons
Role in Markets
Even though individually small, retail investors collectively create large volumes, especially in equity markets. In emerging markets like India, the rise of smartphone trading apps has significantly increased retail participation.
2. Institutional Investors
Institutional investors are large financial organizations that manage money on behalf of others. They dominate global markets due to the scale of their capital.
Types of Institutional Investors
Mutual funds
Hedge funds
Pension funds
Insurance companies
Sovereign wealth funds
Endowment funds
Characteristics
Very large trade volumes
Access to research, analytics, and algorithms
Often set market trends
Long-term investment approach, except hedge funds which may be short-term
Influence
Institutional investors are considered smart money because their decisions influence market direction and liquidity. When they enter or exit positions, markets feel the impact quickly.
3. Foreign Institutional Investors (FIIs & FPIs)
FIIs (Foreign Institutional Investors) or FPIs (Foreign Portfolio Investors) are institutions from one country investing in another country’s markets.
Why They Matter
Their inflow/outflow directly impacts the currency
Create strong sentiments in equity and bond markets
Track global macroeconomic signals like interest rates, inflation, and policy
Behavior
FIIs typically seek countries with:
Steady GDP growth
Stable political environment
Attractive interest rates
Strong corporate earnings
In emerging markets, FII flows often dictate the short-term market trend.
4. Domestic Institutional Investors (DIIs)
DIIs are large institutions based within the home country, such as:
Local mutual funds
Insurance companies (e.g., LIC in India)
Domestic pension funds
Role
DIIs often act as a counterbalance to FII flows.
For example, when FIIs sell heavily, DIIs may step in to stabilize the market.
5. Governments and Central Banks
Governments and central banks participate in the financial markets indirectly and directly.
Central Bank Activities
Set interest rates
Conduct open market operations (buying or selling government bonds)
Control the money supply
Intervene in currency markets when needed
Why They Matter
A single central bank decision—such as the US Federal Reserve changing interest rates—can move global markets instantly. Markets around the world react to:
Federal Reserve (US)
European Central Bank (ECB)
Bank of England
Bank of Japan
Reserve Bank of India (RBI)
Governments also impact markets through:
Fiscal policies
Trade agreements
Corporate regulations
6. Corporations and Businesses
Companies participate in markets not just through their stocks but also through:
Debt issuance (corporate bonds)
Foreign exchange hedging
Commodities hedging (for raw materials)
Examples
Airlines hedge oil prices to secure stable fuel costs
Exporters hedge against currency fluctuations
Large corporations invest surplus funds in short-term money markets
Corporations create massive liquidity and influence currency and commodity prices.
7. Market Makers
Market makers are firms responsible for providing continuous buy and sell quotes for financial instruments. They ensure liquidity and smooth execution for all participants.
Functions
Provide bid-ask quotes
Absorb temporary market imbalances
Reduce volatility
Enable high-frequency trading
Without market makers, spreads would widen, and trading would become inefficient.
8. High-Frequency Traders (HFTs)
High-frequency traders use advanced algorithms and high-speed networks to execute thousands of trades per second.
Characteristics
Extremely short holding periods
Profit from tiny price discrepancies
Provide high liquidity
Controversial due to their speed advantage
Though misunderstood, HFTs contribute significantly to daily trading volumes.
9. Commodity Traders
These are specialized participants who trade physical or futures markets for commodities like:
Crude oil
Gold
Silver
Natural gas
Agricultural products
Commodity participants include:
Producers (e.g., farmers, miners)
Consumers (e.g., factories, refineries)
Speculators
Commodity trading firms (e.g., Glencore, Vitol)
Their actions influence global inflation, supply chains, and price stability.
10. Banks and Forex Dealers
Banks are major participants in:
Forex markets (largest in the world)
Derivatives
Bonds
Money markets
Why Banks Matter
Facilitate global trade
Provide liquidity
Manage clients’ currency/interest rate risks
Influence capital flows
Major banks operate 24/5 to connect global markets.
11. Hedge Funds
Hedge funds take aggressive and often leveraged positions in:
Stocks
Bonds
Derivatives
Commodities
Global macro trades
Roles
Speculate on price movements
Arbitrage mispriced assets
Hedge risks for clients
They often move fast and create large market swings.
12. Exchange-Traded Funds (ETFs)
ETFs are investment funds traded on stock exchanges. They have become global market giants due to easy access, low costs, and high liquidity.
Impact
When major ETFs buy or sell index constituents, they influence the entire index and its sectors.
13. Brokers and Exchanges
These are facilitators rather than direct investors.
Exchanges
Provide platforms for trading
Ensure transparency and regulation
Examples include NSE, BSE, NYSE, NASDAQ, LSE.
Brokers
Connect traders to markets
Execute orders
Offer research tools
They are essential enablers of market participation.
14. Speculators, Arbitrageurs, and Traders
Apart from long-term investors, many participants seek short-term profits.
Speculators
Bet on price movements to earn profits.
Arbitrageurs
Exploit price differences between markets or instruments to earn risk-free profits.
Active Traders
Swing traders
Intraday traders
Option traders
Futures traders
These participants add liquidity and volatility, shaping short-term trends.
Why Understanding Global Market Participants Matters
Knowing who moves the markets helps traders and investors make smarter decisions.
Benefits
Predict market sentiment more accurately
Understand liquidity and volatility changes
Track institutional flows
Use market structure analysis effectively
Improve trading strategies with volume profile
Avoid emotional trading
Markets are a battlefield of different participant types, each operating with unique strategies. Recognizing their role helps traders navigate uncertainty.

BTC: The Optimal Trading OpportunityAs I have stated in my articles every day, BTC hitting the 90K level is the ideal buying opportunity, and my signals have been consistently indicating a buy. The market has once again validated my view, and we are now in profit. Keep holding your positions and close them when the price rallies.
All signals have been 100% accurate for two consecutive weeks. I’ll keep delivering precise signals — act fast to get yours now.

NIFTY LONGER VIEW AND TRYING TO PREDICT FUTURE MOVE AND A BIG FAnifty chart longer view and trying to predict the future move and a big fall its my analysis not recommendation its for my learnig purpose

XAUUSD | Gold Signal |Dec 12,2025The strategy is to continue the upward trend, using the 4265-4263 range as a base for buying on dips and expecting further gains.
#XAUUSD #GOLD
Buy positions entered at 4268-4263, and the price has now reached the 4280 area as expected. The next key level is to push towards the 4295-4300 range.

BTC TODAYA shorter update today, as I outlined our broader BTC view and longer-term targets over the past couple of days and the situation remains unchanged. The key reminders are:
* We need a weekly close below 91,440
* We must not break 95,950
Please refer back to previous messages for the full context and rationale.
Today’s daily levels are as follows:
* Support: 86,180
* Resistance: 94,300
I’m aware this is a relatively wide range, so as usual we will rely on the 4H chart for interim guidance. BTC is currently drifting back into our neutral zone, and we expect a directional decision tomorrow as price approaches an important mathematical trendline (blue dashed).
This decision point should occur around 08:00 UTC tomorrow.
4H interim levels:
* Support: 92,200 now – 92,825 tonight
* Resistance: 93,800 now – 94,410 tonight
I will update if we see a clear break of any of these levels.

XAUUSD: How to Trade Next?Gold has finally broken upward after a series of consolidations, which was an inevitable move. The uptrend has never come to an end. The market is expected to break upward again today to the 4300-4320 range, followed by a pullback right after the breakout.
Gold Trading Strategy for Today:
xauusd buy@4250-4260
TP:4290-4310
All signals have been 100% accurate for two consecutive weeks. I’ll keep delivering precise signals — act fast to get yours now.

XAUUSD: Will the uptrend continue?First of all, congratulations to those who have been following my trading strategy. We have always chosen the right direction, the market has lived up to our wait, and we have made substantial profits today.
The market is currently testing the resistance around 4280 again with a new high emerging. The uptrend will persist, but a pullback is expected to reach the range of 4240-4220. If your account is still in a loss, you can seize this opportunity to exit the market.
All signals have been 100% accurate for two consecutive weeks. I’ll keep delivering precise signals — act fast to get yours now.

Price Action.No matter what indicator you used there is no point except for 20 EMA. As you see the price is going down below the 20 EMA. Just short it.

Are You a Trader Seeking Clarity and Market Mastery?Are you a trader who wants clarity, accuracy, and real mastery over the markets?
Do you want to understand the deeper principles behind price movement — not just follow indicators?
If yes — Welcome. You’re exactly where you need to be.
I’m Niraj M Suratwala, a dedicated practitioner and mentor of W.D. Gann Theory.
For years, I’ve focused on studying, decoding, and practically applying:
✔ The Law of Vibration
✔ Time–Price Cycles
✔ Market Geometry
✔ Predictive price structures used by W.D. Gann
My mission is simple:
To help traders understand the market scientifically, logically, and precisely — exactly as Gann intended.
📚 What You’ll Get in My Upcoming TradingView Ideas
In this series, I will be sharing:
🔸 Simple and clear breakdowns of Gann concepts
🔸 Real chart examples
🔸 Practical implementation techniques
🔸 Time, price, angles & vibrations analysis
🔸 Actionable insights you can immediately start applying
This is not about shortcuts or magic indicators —
This is about understanding the natural laws that govern market movement.
🚀 Let’s Begin This Journey
This introduction is just the beginning.
If you truly want to strengthen your trading with Gann’s timeless principles —
don’t miss the upcoming ideas.
Markets follow natural laws.
Let’s decode them together.

ALPH ready To Fly#ALPH
It depicts a long-term downtrend from mid-2025 highs around $0.36, followed by consolidation and lower lows through late 2025.
Two key horizontal pink support/resistance lines are drawn: an upper one near $0.26 (former resistance) and a lower one around $0.12–$0.14 (recent support).
The price bottomed near $0.10 in November, formed a potential double/triple bottom pattern, and has since broken out upward.
A black ascending triangle or wedge pattern is annotated, with a recent sharp upward breakout arrow pointing higher.
The current price is marked at approximately $0.1257 (down slightly), suggesting a bullish technical setup with potential for further gains if support holds.

Inflation Impact on the Market1. Impact on Stock Market
Inflation influences stock markets in complex ways, creating both opportunities and risks for traders and investors.
a. Corporate Earnings and Profit Margins
When inflation rises, companies face higher costs for raw materials, labor, transportation, and utilities. If businesses cannot pass these costs to customers through higher prices, their profit margins shrink. Lower profits often lead to a decline in stock prices because investors expect reduced future earnings.
b. Investor Sentiment
High inflation creates uncertainty. Investors begin to worry about:
Reduced consumer spending
Declining profitability
Increased interest rates
Slower economic growth
This negative sentiment causes selling pressure in equity markets, especially in growth stocks.
c. Sector-Wise Impact
Inflation does not affect all sectors equally:
Beneficiaries: Energy, commodities, metal, mining, and FMCG often benefit because they can pass on higher costs to customers.
Losers: Technology, banking, real estate, and discretionary sectors often struggle because their valuations depend heavily on future growth. When inflation rises, the present value of future earnings decreases.
d. Value Stocks vs. Growth Stocks
Value stocks generally perform better during high inflation because they have stable cash flows today.
Growth stocks tend to underperform because higher inflation reduces the future value of their expected earnings.
2. Impact on Bond Market
Bonds are significantly affected by inflation because their returns are fixed.
a. Rising Inflation Reduces Bond Value
When inflation rises, the real return on bonds falls. For example, if a bond gives 6% interest and inflation rises to 7%, the bond has a negative real return of –1%. As a result, investors sell bonds, causing bond prices to fall and yields to rise.
b. Central Bank Response
To control inflation, central banks like the RBI typically raise interest rates. Higher interest rates push bond yields upward and reduce the attractiveness of older bonds with lower rates.
c. Impact on Long-Term Bonds
Long-term bonds suffer more during inflation because they lock in low interest rates for many years. Investors shift to short-term bonds or inflation-protected bonds.
3. Impact on Currency Market
Inflation directly influences exchange rates and currency strength.
a. Weakening Domestic Currency
When inflation rises in a country faster than its trading partners:
The domestic currency loses value
Imports become costlier
Foreign investors withdraw money
A weak currency increases inflation even more because imported goods like crude oil, electronics, and chemicals become more expensive.
b. Foreign Investment Outflows
High inflation reduces real returns for foreign investors. They move money to stable and low-inflation countries like the U.S., causing depreciation of the domestic currency.
4. Impact on Commodity Market
Commodity markets are highly sensitive to inflation because commodities are physical goods used in production.
a. Commodities Act as an Inflation Hedge
During inflation, investors prefer:
Gold
Silver
Oil
Natural Gas
Metals
These commodities usually rise in value, making them a hedge against inflation.
b. Cost-Push Inflation
When commodity prices rise, the cost of production increases for companies. This leads to:
Higher retail prices
Reduced consumer spending
Lower corporate profits
This is known as cost-push inflation, which slows economic growth.
5. Impact on Real Estate Market
Inflation influences real estate in multiple ways.
a. Rising Property Prices
Inflation increases the cost of construction materials like cement, steel, and labor. This results in:
Higher property prices
Increased rental yields
Real estate is often seen as a hedge against inflation.
b. Higher Interest Rates Affect Demand
When central banks raise interest rates:
Home loans become expensive
Demand for housing slows
Real estate transactions reduce
Thus, inflation can both push real estate prices up (due to costs) and reduce demand (due to financing costs).
6. Impact on Consumers
Inflation directly hits consumers’ pockets.
a. Reduced Purchasing Power
Consumers can buy fewer goods and services with the same amount of money. This reduces:
Savings
Consumption
Discretionary spending (luxury items)
b. Shift in Spending Patterns
Consumers prioritize essentials:
Food
Utilities
Healthcare
Transport
and reduce spending on:
Travel
Clothing
Electronics
Dining out
This shift affects sectors differently in the stock market.
7. Impact on Businesses
Companies face several challenges during inflation.
a. Higher Operating Costs
Input costs such as raw materials, transportation, and wages increase. Companies must decide whether to:
Pass higher costs to customers
Absorb the impact and reduce margins
b. Uncertain Forecasting
Inflation makes it difficult for businesses to plan:
Budgets
Future investments
Expansion strategies
High unpredictability leads to slower business growth.
c. Wage Inflation
Employees demand higher salaries to maintain living standards. Companies face increased payroll costs, which affects earnings.
8. Impact on Economic Growth
Inflation influences the broader economy through multiple channels.
a. High Inflation Slows Growth
If inflation rises too fast:
Consumption decreases
Investment slows
Borrowing becomes expensive
Business expansion reduces
This leads to slower GDP growth.
b. Risk of Stagflation
Stagflation refers to a situation where:
Inflation is high
Growth is low
Unemployment is rising
This is considered the worst-case economic scenario.
c. Central Bank Intervention
To control inflation, RBI raises interest rates and tightens monetary policy. Although this helps reduce inflation, it can slow economic momentum.
9. Impact on Investment Strategies
Traders and investors change strategies based on inflation trends.
a. Portfolio Rebalancing
Investors move money from:
Growth stocks → value stocks
Bonds → commodities
Domestic investments → foreign markets
b. Defensive Stocks Become Attractive
During inflation, sectors like:
FMCG
Utilities
Pharma
perform better because demand for their products remains stable.
Conclusion
Inflation plays a central role in shaping financial markets, economic conditions, business decisions, and investment strategies. While mild inflation indicates a healthy and growing economy, high or unpredictable inflation can create wide-ranging negative effects—market volatility, currency depreciation, reduced corporate earnings, and slower economic growth. Understanding how inflation impacts different sectors and asset classes helps investors make informed decisions and adapt their strategies based on current economic conditions.

BTC: Start BuyingAfter a rally, BTC has entered another consolidation phase, presenting fresh buying opportunities. You can start buying now, with the target range at 94K–96K.
BTC Trading Strategy for Today:
BTCUSDT buy@89000-90000
TP:94000-96000
All signals have been 100% accurate for two consecutive weeks. I’ll keep delivering precise signals — act fast to get yours now.

XAUUSD: Market Analysis and Strategy for December 11thGold Technical Analysis:
Daily Resistance: 4265, Support: 4145
4-Hour Resistance: 4250, Support: 4170
1-Hour Resistance: 4224, Support: 4204
In the short term, the Fed's dovish signals have significantly cooled market expectations for a rate cut in January. The dollar's decline may slow temporarily, and expectations for continued gains in gold and silver may weaken. The risk of a pullback at high levels should be noted. We need to pay attention to the market's further interpretation of the Fed's decision and focus on next week's NFP employment data.
In the medium to long term, if the labor market continues to cool or inflation unexpectedly falls, the conservative forecast of only one rate cut in 2026 is likely to be revised, thus opening up more room for precious metals. Silver, in particular, with the combined effects of industrial demand and safe-haven appeal, its current historical high may only be the beginning of a new upward cycle.
Despite fundamental support, gold still faces selling pressure at higher levels in the short term. The daily candlestick chart shows a decline starting after the European session, with the price under pressure at the upper edge of the short-term trading range. Watch for support around the trendline at 4170; the price action may continue with consolidation.
Looking at the 1-hour chart, a triple top pattern has formed. We need to watch for resistance at 4250/4260. The price is trading around the Bollinger Middle Band, and the moving averages are crossing downwards. Support at the lower edge of the short-term sideways trading range is around 4180/4175.
Trading Strategy: Watch for a reaction around 4190/4180/4170. Buy on dips after a bottom is established.
SELL: 4250~4260 near
More Analysis →

BitcoinBTCUSD
- Bearish Channel as an corrective pattern in Long Time Frame
- Fair Value Gap
- Completed " 123 " Impulsive Waves
- Fibonacci Level - 38.20% / 50.00%
- Bullish Channel in Short Time Frame

11.12.25Pairs on watch
FX:USDCAD Long
FX:NZDCAD Short
FX:EURNZD Neutral
FX:GBPUSD Short
FX:NZDJPY Long
FX:CADJPY Long
FX:USDJPY Neutral
FX:AUDCAD Short
A short overview of the instruments i am looking at for Today, Multi-time frame analysis down to what i will be looking out for Entry.

XAGUSD BUY SETP📌 Trade Plan (Short & Professional)
🟢 Entry
Buy after bullish confirmation inside:
61.40–61.20 mitigation zone, or
60.70–60.50 main demand zone (preferred after liquidity sweep)
🛑 Stop Loss
Below the demand zone: 59.95–60.00
🎯 Take Profit
Target the next liquidity zone / recent highs:
62.80–63.40
📈 Reason for Entry
Market shows a bullish BOS
Price is retracing to fill imbalance + mitigate demand
Expecting a liquidity sweep, then bullish continuation

XAGUSD-SELL strategy weekly chart REG CHANNELIt's interesting getting some comments from the community, that are considered for me to be slightly insulting. For me, anyone is allowed to provide comments on analysis, after all they are learning to understand the difficulties of the markets. The key misunderstanding that exists is, to understand the difference between short-term, medium-term and long-term. That is why is is good education to address this point a bit.
Currently, GOLD AND SILVER both are trading far beyond their fair values. The technical picture suggests medium- to log-term larger corrective action to take place. I am not saying we cannot go higher or lower short-term, and this is where the point is being missed.
The Reg. Channel break-away price action clearly suggest we should move back towards mid-point, and adding the RSI to be extreme (overbought) or weekly and monthly chart. For those that are focused on medium- and long-term, add to shorts and add current levels 61.50-63.50. profit levels are suggested below $ 43/oz now.

$BTC - $DXY -$SPX - $NDX - $GOLD 11/12/2025 forecastWhile the past days saw a fairly moderate negative energy across an index at a time, things will now complicate. As we're looking for both CRYPTOCAP:BTC , TVC:GOLD and NASDAQ:NDX (the latter still waiting to properly discount the incoming negative days) to witness huge peaks of negative energy, at 3:49 am UTC and particularly at 7:50 am UTC being the hardest one, volatility will further increase as we get towards 12/12/2025.

$BTC - $DXY -$SPX - $NDX - $GOLD 10/12/2025 forecastAs explained,only NASDAQ:NDX should see a corrective day which got skipped on the previous day. Rest is neutral biased. Likely that CRYPTOCAP:BTC mimicks the NASDAQ:NDX price action.

$BTC - $DXY -$SPX - $NDX - $GOLD 10/12/2025 forecastAs explained,only NASDAQ:NDX should see a corrective day which got skipped on the previous day. Rest is neutral biased. Likely that CRYPTOCAP:BTC mimicks the NASDAQ:NDX price action.

BTC – Retracement Likely Before Bullish Expansion | Watching 89kBitcoin remains in a strong macro uptrend, but short-term price action is showing signs of exhaustion near the 93k zone. Price rejected this level twice, forming a short-term double top and showing a loss of momentum on the lower timeframes.
On the 45m chart, BTC is slowly breaking below local support, while the 2h shows price sitting high inside a larger ascending channel. A healthy retracement looks increasingly likely before the next impulsive move.
I’m watching the 89,00 –90,000 zone closely, which lines up with:
Mid-range equilibrium
Previous consolidation
Untapped liquidity below
Local FVG imbalance
Trendline support
A sweep into this zone would create a perfect setup for buyers to step back in and continue the higher-timeframe trend.
Macro Context
December typically brings volatility in crypto. With anticipation around December rate decisions, liquidity thinning, and strong bullish positioning in BTC derivatives, a short-term correction would actually benefit the long-term trend.
As long as Bitcoin stays above 85k, the structure remains bullish and any dips are likely to be corrective.
📈 Technical Levels I'm Watching
Major Resistance:
93,200 – 93,800 (strong rejection zone)
96,000 (next major magnet if broken)
Key Support:
90,000
88,500
87,200–87,000 (main demand zone)
85,800 (larger timeframe invalidation)
Bullish Scenario:
A flush into 89k → liquidity grab → reaction → bullish continuation toward 95–96k.
Bearish Scenario (less likely unless macro shocks):
Break and close below 85,800 → deeper correction toward 83k region.
📌 My Trade Planning Outlook
Bias: Bullish on pullback
Looking for continuation long entries around 89,000–90,000, if confirmed with reaction.
Short-term targets:
• 91,500
• 93,000–93,800
Medium-term targets:
• 95,600
• 97,000
As long as BTC maintains the higher timeframe channel structure, I’ll treat dips as opportunities rather than reversals.
Trade Safe,
– JackOfAllTrades

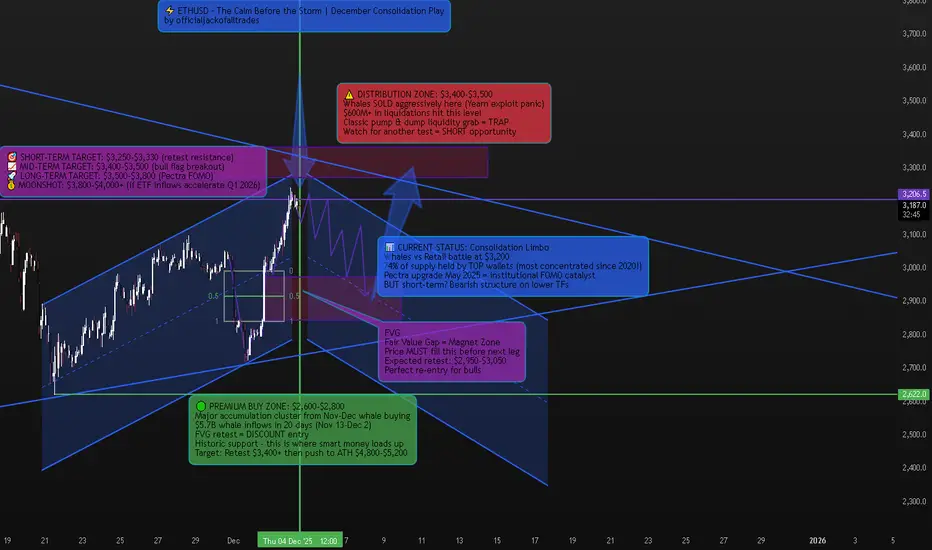
ETHUSD – The Calm Before the Storm | December's Most Misundersto📈 Market Context – Why Everyone's Wrong About ETH Right Now
Ethereum is sitting at one of the most deceptive price levels in crypto right now. Most traders see the recent dump from $3,762 on December 2 and think "it's over." Others see the consolidation around $3,208 and think "dead cat bounce."
They're both missing the bigger picture.
Here's what ACTUALLY happened: A 2015 Ethereum ICO wallet that had been inactive for a long time moved 40,000 ETH suddenly, worth around $120 million. Crypto Twitter panicked. But then Lookonchain verified that it was for internal transfer, and not a liquidation. Classic FUD.
What REALLY tanked ETH? A Yearn Finance exploit that happened at the worst possible time, when the market was stretched by leverage and rising speculative positioning. More than $600 million in crypto liquidations hit the market. This wasn't an organic selloff—this was a leveraged washout.
But here's the kicker: While retail was panic-selling, whales were accumulating like it's 2020 all over again.
🔎 Technical Framework – The Deceptive Calm
Current State:
Ascending broadening wedge inside rising channel—classic volatility compression before explosive move
Key Liquidity Zones:
🔴 Distribution Liquidity Zone (SHORT Opportunity):
$3,550 - $3,650 (recent spike high + whale distribution cluster)
This is where whales moved 40,000 ETH at $120 million valuation before the "transfer" narrative
Since December 2024, aggressive selling by whales has been evident in the rise of average market order sizes
🟢 Accumulation Liquidity Zone (BUY ORIGIN):
$2,900 - $3,000 (FVG retest + November-December whale buy zone)
From November 13 to December 2, whales acquired a total of 1,702,835.5 ETH at an average price of $5.7 billion
In early 2025, large holders acquired over 330,000 ETH, valued at approximately $1.08 billion
⚖️ Chop Zone (NO TRADE ZONE):
$3,100 - $3,400 (current consolidation limbo)
This struggle between institutional investors and retail traders could define Ethereum's price action in the coming weeks
🐋 WHALE ACTIVITY – The REAL Story Nobody's Talking About
While everyone's focused on the dump, let me show you what the ACTUAL data says:
The Accumulation Phase (That Everyone Missed):
Ethereum whale wallets have recorded positive netflows in each of the last 20 trading days, dating back to November 13
The highest single-day inflows of 2570 ETH came on November 14 when Gensler's exit was confirmed
Ethereum ETFs attracted $2.63 billion in inflows in December 2024, led by the Fidelity Ethereum Trust
The Concentration Effect (This is MASSIVE):
Over the past four months, Ethereum's Gini coefficient increased from 0.7563 in September to 0.7630 in December 2024—a clear sign of growing ownership concentration. Translation? Whales are consolidating control.
Even crazier: Addresses holding 10,000+ ETH now control 74.47% of Ethereum's circulating supply. Compare that to Bitcoin where large holders control only about 15%—ETH is FIVE TIMES more whale-controlled than BTC.
This is why ETH moves are so violent and why large transfers or sales by a tiny fraction of holders can rapidly sway Ethereum's price and sentiment.
The Distribution Signal:
But here's where it gets interesting: Since December 2024, there has been an increase in aggressive sell orders, particularly from whales, with rising average market order sizes suggesting they are offloading holdings.
So what gives? Are whales accumulating or distributing?
BOTH. They're accumulating at discount levels ($2,900-$3,050) and distributing at premium levels ($3,550-$3,650). This is classic smart money behavior—they're range-trading the volatility while retail gets chopped.
🚨 Recent Developments – The Catalyst Stack
Pectra Upgrade – May 7, 2025 (GAME CHANGER)
The Pectra upgrade went live in May 2025, introducing batch transactions, gas payment in any token, and doubling blob capacity for Layer 2s.
Key improvements:
Account Abstraction enables gas payments using multiple tokens like USDC and DAI, with third-party fee sponsorship
EIP-7691 doubles Ethereum's blob throughput from three blobs with a maximum of six to six with a maximum of nine
With the Pectra upgrade, Ethereum's data capacity significantly increases to about 420 TPS from 210 TPS
Translation: ETH just became TWICE as fast for Layer 2s. This is MASSIVE for scalability and will drive institutional adoption.
ETF Inflows – The Silent Accumulation
Ethereum ETFs attracted substantial institutional interest, with inflows reaching $2.63 billion in December 2024. This is institutional money positioning for the next leg up—they don't buy at tops, they buy at bottoms.
Gary Gensler Exit – Regulatory Tailwind
The impending exit of SEC chairman Gary Gensler enhanced investor confidence in the altcoin sector, putting Ethereum in prime position to deliver superior performance relative to BTC.
Staking Explosion
Staking activity reached near-all-time highs, with 36.19 million ETH locked in validators—a 4.5% increase since October 2024. That's $115+ BILLION locked away, reducing circulating supply.
DeFi TVL At $90 Billion
Total Value Locked in Ethereum protocols surged to $90 billion, driven by renewed interest in yield-bearing DeFi products. Institutional money is FLOODING into ETH DeFi.
🎯 Trade Plans – High-Probability Setups
🟢 BUY ETHUSD: $2,900 - $3,000 | SL $2,820
Thesis: FVG retest at proven whale accumulation zone + November-December $5.7B whale buying cluster = institutional re-entry point
Entry Rules (MUST WAIT FOR CONFIRMATION):
Price dips into $2,900-$3,000 FVG zone
Bullish CHoCH (Change of Character) + BOS (Break of Structure) on H1-H4
Strong bullish rejection wick with volume spike (100K+ ETH volume on 4H)
Ideally on Order Block retest after initial bounce
BONUS CONFIRMATION: Check whale netflow data on IntoTheBlock—if showing positive inflows, ADD to conviction
Targets:
$3,350 - $3,400 (mid-channel retest, quick 12-15% gain)
$3,600 - $3,750 (previous high retest + distribution zone, 23-28% gain)
$4,200 - $4,500 (bull flag breakout + Pectra FOMO begins, 42-50% gain)
$5,200 - $5,800 (ATH retest + full bull market confirmation, 75-95% gain)
Moonshot: $6,500+ (if ETF inflows accelerate post-Pectra like BTC did)
Risk Management:
Position size: 3-5% of portfolio (this is a HIGH-CONVICTION setup)
Scale in 40% at $3,000, 30% at $2,950, 30% at $2,900
Trail stop to breakeven after hitting Target 1
Take 30% profit at Target 2, let rest ride with trailing stop
🔴 SELL ETHUSD: $3,550 - $3,650 | SL $3,750
Thesis: Premium liquidity retest at proven whale distribution zone—classic "return to scene of crime" before deeper correction
Entry Rules (WAIT FOR CONFIRMATION):
Price pumps into $3,550-$3,650 zone (previous spike high)
Bearish CHoCH + MSS (Market Structure Shift) + BOS down on H1-H4
CRITICAL: Check CryptoQuant whale-to-exchange flow—if showing HIGH exchange inflows (whales moving ETH to exchanges to sell), this is your GO signal
Heavy volume spike on bearish candle (150K+ ETH on 4H)
Entry after FVG fill or Order Block retest post-initial rejection
Targets:
$3,200 - $3,250 (first support retest, quick 8-12% gain)
$3,050 - $3,100 (mid-channel support)
$2,900 - $3,000 (FVG zone—BUY setup reactivates here!)
Risk Management:
This is a COUNTER-TREND trade—use tighter stops
Position size: 2-3% max (smaller than long setup due to higher risk)
Take 50% profit at Target 1, move SL to breakeven
Exit FULLY at Target 3 and flip to LONG setup
⚠️ Risk Management & Critical Notes
The #1 Mistake: Trading inside the $3,100-$3,400 chop zone without confirmation. The struggle between institutional investors and retail traders in this range creates whipsaw conditions this is where retail accounts get DESTROYED.
Whale Flow Monitoring is NON-NEGOTIABLE: High leverage remains with funding rates indicating very high risk-taking activities and markets still inclined towards speculative long positions. Use Glassnode or IntoTheBlock to monitor whale exchange inflows BEFORE entering trades.
Volatility Warning: This concentrated ownership structure means large transfers or sales by a tiny fraction of holders can rapidly sway Ethereum's price. Set alerts for 10,000+ ETH whale movements on Whale Alert.
Macro Headwind: Japan has indicated tightening, and U.S. real interest rates remain high. Under low liquidity conditions, even minor shocks can trigger significant price changes. If SPX dumps 5%+, ETH follows—be ready to cut positions.
Position Sizing: Given the extreme whale concentration, never go all-in. Scale positions at key levels. This isn't a casino—it's warfare against billion-dollar players.
📊 The Bottom Line – Why This Time Is Different (Or Isn't)
Let me give it to you straight: ETH is at a crossroads.
The Bull Case (What I'm Leaning Toward):
✅ $5.7 billion in whale accumulation over 20 days since November 13
✅ $2.63 billion in ETF inflows in December 2024
✅ $90 billion TVL in DeFi protocols institutions are building
✅ Pectra upgrade doubled transaction throughput to 420 TPS
✅ 36.19 million ETH staked = reduced supply
✅ Gary Gensler gone = regulatory tailwind
✅ Technical structure: Rising channel still intact, FVG below = perfect retest setup
The Bear Case (What Keeps Me Up at Night):
⚠️ Aggressive whale selling since December with rising average market order sizes
⚠️ Even as Bitcoin and Solana hit all-time highs after Trump's election, Ether topped out at $4,000 in December, well short of its 2021 high of $4,800
⚠️ High leverage with funding rates indicating very high-risk speculative long positions
⚠️ Global liquidity tightening from Japan and high U.S. real interest rates
⚠️ 74.47% of supply controlled by whales = extreme manipulation risk
⚠️ Price underperforming BTC and SOL = capital rotation away from ETH
My Take:
The $5.7 billion whale accumulation since November 13 tells me smart money is positioning for a move. But the aggressive whale selling at premium levels tells me they're range-trading, not accumulating for a straight pump to $10K.
Here's the play:
Short-term (Dec-Jan): Expect consolidation with violent swings. Trade the range: buy $2,900-$3,000, sell $3,550-$3,650.
Medium-term (Feb-April): After Pectra hype builds + ETF inflows accelerate, we get the push to $4,200-$4,800.
Long-term (Mid-2025+): If ETH breaks $4,800 ATH with volume, we're going to $5,800-$7,000+.
BUT: If ETH breaks below $2,850 with volume, the bull case is dead and we're heading to $2,600-$2,400 to fill lower FVGs.
🔥 Strategy Summary – How I'm Trading This
Phase 1 (NOW - January):
Wait for dip to $2,900-$3,000 FVG zone
Scale in long position (3-5% of portfolio)
Target: $3,600-$3,750 for 25-30% gain
Take 30% profit, trail stop on rest
Phase 2 (If we hit $3,600+):
Watch whale exchange inflows
If HIGH inflows (distribution signal) → SHORT at $3,550-$3,650
If LOW inflows (holding) → add to longs, target $4,200-$4,500
Phase 3 (Post-Pectra Hype, March-May):
If ETH holds above $3,600 and Pectra adoption is strong → go HEAVY long
Target: ATH breakout to $5,200-$5,800
This is the "generational wealth" move IF it plays out
Invalidation:
Close ALL longs if ETH closes below $2,850 on daily
Flip bearish, target $2,600-$2,400
💡 Final Word – The Truth About ETH Right Now
ETH isn't "dead." But it's not "mooning tomorrow" either.
Critics have blasted developers' decision to focus on Layer 2 blockchains, arguing those chains siphon value from ETH. That's a real concern. ETH isn't pumping like BTC or SOL because value is flowing to L2s.
But here's the counterargument: With the Pectra upgrade, this will double L2 performance out of the gate, leading to lower costs and faster transaction times. If L2s explode in adoption, ETH benefits as the base layer. It's like owning the toll road, not the cars.
The Question: Will the $2.63 billion in ETF inflows and $5.7 billion in whale accumulation be enough to push ETH to new ATHs? Or will whale distribution at premium levels and high leverage markets cause another violent shakeout first?
My bet: One more shakeout to $2,900-$3,000 (FVG retest), THEN the real pump begins. But I'm not holding through a breakdown below $2,850. That's where I cut and flip bearish.
Trade the structure. Follow the whales. Protect your capital.
Drop a 🔥 if you're watching that $2,900-$3,000 FVG like a hawk. This is where fortunes are made or lost.