GBP (British Pound)

Bullish breakout?The Cable (GBP/USD) has broken out of the resistance level, which was a pullback resistance. A potential pullback to the pivot and a bounce could lead the price to rise toward the 1st resistance level.
Pivot: 1,3259
1st Support: 1.3223
1st Resistance: 1.3319
Risk Warning:
Trading Forex and CFDs carries a high level of risk to your capital and you should only trade with money you can afford to lose. Trading Forex and CFDs may not be suitable for all investors, so please ensure that you fully understand the risks involved and seek independent advice if necessary.
Disclaimer:
The above opinions given constitute general market commentary, and do not constitute the opinion or advice of IC Markets or any form of personal or investment advice.
Any opinions, news, research, analyses, prices, other information, or links to third-party sites contained on this website are provided on an "as-is" basis, are intended only to be informative, is not an advice nor a recommendation, nor research, or a record of our trading prices, or an offer of, or solicitation for a transaction in any financial instrument and thus should not be treated as such. The information provided does not involve any specific investment objectives, financial situation and needs of any specific person who may receive it. Please be aware, that past performance is not a reliable indicator of future performance and/or results. Past Performance or Forward-looking scenarios based upon the reasonable beliefs of the third-party provider are not a guarantee of future performance. Actual results may differ materially from those anticipated in forward-looking or past performance statements. IC Markets makes no representation or warranty and assumes no liability as to the accuracy or completeness of the information provided, nor any loss arising from any investment based on a recommendation, forecast or any information supplied by any third-party.

GBPAUD forming a bottom?GBPAUD - 24h expiry
The primary trend remains bullish.
The selloff has posted an exhaustion count on the daily chart.
Price action looks to be forming a bottom.
Preferred trade is to buy on dips.
Bespoke support is located at 2.0540.
We look to Buy at 2.0540 (stop at 2.0480)
Our profit targets will be 2.0765 and 2.0790
Resistance: 2.0700 / 2.0760 / 2.0850
Support: 2.0550 / 2.0485 / 2.0430
Risk Disclaimer
The trade ideas beyond this page are for informational purposes only and do not constitute investment advice or a solicitation to trade. This information is provided by Signal Centre, a third-party unaffiliated with OANDA, and is intended for general circulation only. OANDA does not guarantee the accuracy of this information and assumes no responsibilities for the information provided by the third party. The information does not take into account the specific investment objectives, financial situation, or particular needs of any particular person. You should take into account your specific investment objectives, financial situation, and particular needs before making a commitment to trade, including seeking advice from an independent financial adviser regarding the suitability of the investment, under a separate engagement, as you deem fit.
You accept that you assume all risks in independently viewing the contents and selecting a chosen strategy.
Where the research is distributed in Singapore to a person who is not an Accredited Investor, Expert Investor or an Institutional Investor, Oanda Asia Pacific Pte Ltd (“OAP“) accepts legal responsibility for the contents of the report to such persons only to the extent required by law. Singapore customers should contact OAP at 6579 8289 for matters arising from, or in connection with, the information/research distributed.

GBPUSD Forecast: Watching 1.3000–1.3060 Zone for Bullish ReactioCurrently, GBPUSD is showing signs of weakness and may dip slightly towards the 1.3000 to 1.3060 area. A daily Fair Value Gap (FVG) exists in this zone on the lower timeframes, which could act as a strong support area. From that point, we may see a significant bullish move.
In summary:
Current Bias: Short-term bearish
Expected Retrace: To the 1.3000 – 1.3060 zone (daily FVG)
Expected Move: Strong bullish rally from that support
Please note that this is a technical outlook, not financial advice. Always do your own analysis and manage risk carefully in live market conditions.

GBPNZD | 1H | SELL ZONEHey There,
After reaching my GBPNZD sell level, my target is now 2.23855.
Your likes keep me motivated to share my analyses, and I truly appreciate the support.
Big thanks to everyone showing love

Bearish reversal?The Cable (GBP/USD) is rising towards the pivot, which is a pullback resistance and could reverse to the 1st support, which acts as a pullback support that lines up with the 50% Fibonacci retracement.
Pivot: 1.3250
1st Support: 1.3050
1st Resistance: 1.3331
Risk Warning:
Trading Forex and CFDs carries a high level of risk to your capital and you should only trade with money you can afford to lose. Trading Forex and CFDs may not be suitable for all investors, so please ensure that you fully understand the risks involved and seek independent advice if necessary.
Disclaimer:
The above opinions given constitute general market commentary, and do not constitute the opinion or advice of IC Markets or any form of personal or investment advice.
Any opinions, news, research, analyses, prices, other information, or links to third-party sites contained on this website are provided on an "as-is" basis, are intended only to be informative, is not an advice nor a recommendation, nor research, or a record of our trading prices, or an offer of, or solicitation for a transaction in any financial instrument and thus should not be treated as such. The information provided does not involve any specific investment objectives, financial situation and needs of any specific person who may receive it. Please be aware, that past performance is not a reliable indicator of future performance and/or results. Past Performance or Forward-looking scenarios based upon the reasonable beliefs of the third-party provider are not a guarantee of future performance. Actual results may differ materially from those anticipated in forward-looking or past performance statements. IC Markets makes no representation or warranty and assumes no liability as to the accuracy or completeness of the information provided, nor any loss arising from any investment based on a recommendation, forecast or any information supplied by any third-party.

EURGBP: Shifting to long term bearish.EURGBP is heavily bearish on its 1D technical outlook (RSI = 36.165, MACD = 0.000, ADX = 36.508), and most likely will close the day under its 1D MA50. At the moment it is crossing below the 2025 Channel Up and if it closes under it, we will have a validated trend shift to bearish long term. It will be similar to the August 2024 decline that made a new Low after a 1D MA50 rejection. We first aim for the S1 level (TP1 = 0.83500) and as long as it remains under the 1D MA50, resell on the bounce to the S1 level (TP2 = 0.82500).
## If you like our free content follow our profile to get more daily ideas. ##
## Comments and likes are greatly appreciated. ##

GBP/USD Set for a Big Move! Will It Break the Channel or Reboun📈 GBP/USD DAILY PLAN – 12/05/2025
🔍 Technical Overview:
The GBP/USD pair is currently consolidating in a descending channel, with clear resistance and support levels. After forming a short-term high at 1.32507, the price is showing signs of retracing and looks set to continue the downward move.
Key Resistance Levels:
1.32507: The latest high, still unbroken. This is a key resistance level in the short term.
1.31690: The next resistance level, which could provide bearish momentum as the price touches it.
1.31417: A strong resistance level if the price continues to rise.
Key Support Levels:
1.32474: A strong support zone, likely to be tested if the price dips.
1.32169: A short-term support level for potential reversal.
1.31216: A key support level in case of a sharp decline, potentially a strong BUY zone.
🎯 Trade Scenarios:
1. Bearish Breakout Scenario:
SELL Zone: 1.32507 – 1.31690
Stop Loss (SL): 1.3300
Take Profit (TP): 1.31417 → 1.31000 → 1.30500
2. PullbackScenario – Reversal at Support:
BUY Zone: 1.31216 – 1.31417
Stop Loss (SL): 1.31000
Take Profit (TP): 1.31800 → 1.32100 → 1.32400
⚠️ Notes:
Market Sentiment: The market is highly sensitive to ongoing political and economic developments, especially comments from ECB and Fed officials. Watch the key support and resistance levels carefully before making any trades today.
Risk Management: Be sure to manage your SL/TP levels carefully and avoid chasing signals during volatile market moves.
📣 Important:
Today is a key day with important macroeconomic data that could shift market sentiment, particularly from Fed officials and trade talks. Be cautious and wait for confirmation signals before entering any trades.

GBPCHF | 09.05.2025SELL 1.10150 | STOP 1.11300 | TAKE 1.09000 | Against the background of the key interest rate cut to 4.25% and the emerging trade deal between the US and the UK, no surprises are expected. Continued pressure on the GBP from the formed medium-term strong resistance range of 1.10850 - 1.11200 against the CHF is likely. Technically, the trading picture is drawn towards selling during May.

GBP_CHF SWING SHORT|
✅GBP_CHF will soon retest a key resistance level around 1.1111
So I think that the pair will make a pullback
And go down to retest the demand level below around 1.1024
SHORT🔥
✅Like and subscribe to never miss a new idea!✅
Disclosure: I am part of Trade Nation's Influencer program and receive a monthly fee for using their TradingView charts in my analysis.

GBP-CHF Resistance Ahead! Sell!
Hello,Traders!
GBP-CHF keeps growing
With an aim of retesting a
Horizontal resistance of 1.1108
From where we will be expecting
A local pullback and a move down
Sell!
Comment and subscribe to help us grow!
Check out other forecasts below too!
Disclosure: I am part of Trade Nation's Influencer program and receive a monthly fee for using their TradingView charts in my analysis.

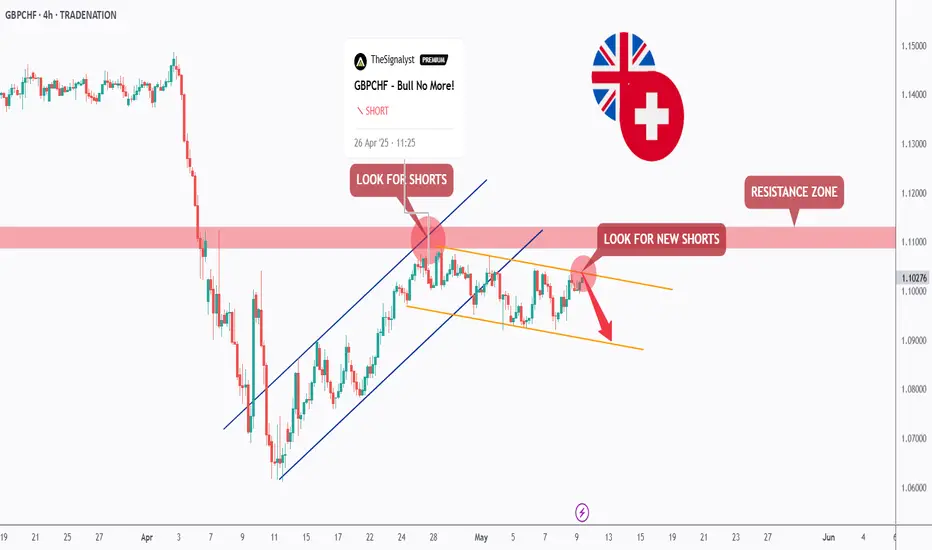
GBPCHF - Short Again!Hello TradingView Family / Fellow Traders. This is Richard, also known as theSignalyst.
📉As per our last GBPCHF analysis (attached on the chart), it rejected the red resistance zone and has been trading lower.
Short-term, GBPCHF has been trading within the falling channel marked in orange and today, it has been rejecting the upper bound of the orange channel.
🏹 Thus, the highlighted red circle is a strong area to look for sell setups as it is the intersection of the upper orange trendline aligned with the previous long-term analysis/trend.
📚 As per my trading style:
As #GBPCHF is hovering around the red circle zone, I will be looking for bearish reversal setups (like a double top pattern, trendline break , and so on...)
📚 Always follow your trading plan regarding entry, risk management, and trade management.
Good luck!
All Strategies Are Good; If Managed Properly!
~Rich
Disclosure: I am part of Trade Nation's Influencer program and receive a monthly fee for using their TradingView charts in my analysis.
Bearish breakout?The Cable (GBP?USD) is reacting off the pivot and could potentially drop to the 1st support.
Pivot: 1.3261
1st Support: 1.3159
1st Resistance: 1.3333
Risk Warning:
Trading Forex and CFDs carries a high level of risk to your capital and you should only trade with money you can afford to lose. Trading Forex and CFDs may not be suitable for all investors, so please ensure that you fully understand the risks involved and seek independent advice if necessary.
Disclaimer:
The above opinions given constitute general market commentary, and do not constitute the opinion or advice of IC Markets or any form of personal or investment advice.
Any opinions, news, research, analyses, prices, other information, or links to third-party sites contained on this website are provided on an "as-is" basis, are intended only to be informative, is not an advice nor a recommendation, nor research, or a record of our trading prices, or an offer of, or solicitation for a transaction in any financial instrument and thus should not be treated as such. The information provided does not involve any specific investment objectives, financial situation and needs of any specific person who may receive it. Please be aware, that past performance is not a reliable indicator of future performance and/or results. Past Performance or Forward-looking scenarios based upon the reasonable beliefs of the third-party provider are not a guarantee of future performance. Actual results may differ materially from those anticipated in forward-looking or past performance statements. IC Markets makes no representation or warranty and assumes no liability as to the accuracy or completeness of the information provided, nor any loss arising from any investment based on a recommendation, forecast or any information supplied by any third-party.

GBPJPY: Entering the most optimal medium-term Sell Zone.The GBPJPY pair is bullish on its 1D technical outlook (RSI = 59.237, MACD = 0.300, ADX = 16.909) as it is expanding the bullish wave of the 6 month Channel Down. The two prior peaked on the 0.786 and 0.9 Fibonacci retracement level respectively. This bullish wave has already reached the 0.786 Fib, so it has entered the most optimal Sell Zone for the medium term. Even if it peaks on the 0.9 Fib, a -5.90% bearish wave (similar with the 3 prior) would test 183.500.
See how our prior idea has worked out:
## If you like our free content follow our profile to get more daily ideas. ##
## Comments and likes are greatly appreciated. ##

Bearish breakout off pullback support?GBP/USD is reacting off the support level which is a pullback support that lines up with the 78.6% Fibonacci projection and could drop from this level to our takeprofit.
Entry: 1.3252
Why we like it:
There is a pullback support level that lines up with the 78.6% Fibonacci projection.
Stop loss: 1.3332
Why we like it:
There is an overlap resistance level.
Take profit: 1.3163
Why we like it:
There is a pullback support level that lines up with the 161.8% Fibonacci extension.
Enjoying your TradingView experience? Review us!
Please be advised that the information presented on TradingView is provided to Vantage (‘Vantage Global Limited’, ‘we’) by a third-party provider (‘Everest Fortune Group’). Please be reminded that you are solely responsible for the trading decisions on your account. There is a very high degree of risk involved in trading. Any information and/or content is intended entirely for research, educational and informational purposes only and does not constitute investment or consultation advice or investment strategy. The information is not tailored to the investment needs of any specific person and therefore does not involve a consideration of any of the investment objectives, financial situation or needs of any viewer that may receive it. Kindly also note that past performance is not a reliable indicator of future results. Actual results may differ materially from those anticipated in forward-looking or past performance statements. We assume no liability as to the accuracy or completeness of any of the information and/or content provided herein and the Company cannot be held responsible for any omission, mistake nor for any loss or damage including without limitation to any loss of profit which may arise from reliance on any information supplied by Everest Fortune Group.

GBPCHF What Next? SELL!
My dear friends,
GBPCHF looks like it will make a good move, and here are the details:
The market is trading on 1.1010 pivot level.
Bias - Bearish
Technical Indicators: Supper Trend generates a clear short signal while Pivot Point HL is currently determining the overall Bearish trend of the market.
Goal - 1.0983
About Used Indicators:
Pivot points are a great way to identify areas of support and resistance, but they work best when combined with other kinds of technical analysis
Disclosure: I am part of Trade Nation's Influencer program and receive a monthly fee for using their TradingView charts in my analysis.
———————————
WISH YOU ALL LUCK

GBPCHF INTRADAY sideways consolidation capped at 1.1066The GBP/CHF currency pair remains under bearish pressure, in line with the broader downtrend. Recent price movement reflects an oversold rally that stalled near a key resistance level at 1.1120, which previously acted as an intraday consolidation zone.
This level now serves as a crucial pivot. If price fails to break above 1.1120 and faces rejection, it could trigger a continuation of the bearish trend with downside targets at:
1.0690 – Initial support
1.0600 – Medium-term target
1.0460 – Long-term support level
On the flip side, a confirmed breakout and daily close above 1.1120 would invalidate the bearish bias. This would open the door for a recovery toward:
1.1200 – First resistance above the breakout
1.1250 – Key upside target
Conclusion
The bearish bias remains intact below 1.1120, with oversold rallies likely to attract selling interest. A daily close above 1.1120 would be a bullish signal, potentially shifting momentum toward higher resistance levels.
This communication is for informational purposes only and should not be viewed as any form of recommendation as to a particular course of action or as investment advice. It is not intended as an offer or solicitation for the purchase or sale of any financial instrument or as an official confirmation of any transaction. Opinions, estimates and assumptions expressed herein are made as of the date of this communication and are subject to change without notice. This communication has been prepared based upon information, including market prices, data and other information, believed to be reliable; however, Trade Nation does not warrant its completeness or accuracy. All market prices and market data contained in or attached to this communication are indicative and subject to change without notice.

GBPUSD | 1H | BULLGood Morning Traders;
My target level for GBP/USD is 1.33966—just wait for this level and stay patient.
I put in a lot of effort to prepare these analyses for you, so don’t hold back on showing your support with a like! A huge thank you to everyone who supports me—every single like is a source of motivation for me to keep sharing my insights.

Bullish bounce off pullback support?The Cable (GBP/USD) is falling towards the pivot which is a pullback support and could bounce to the 1st resistance which is an overlap resistance.
Pivot: 1.3264
1st Support: 1.3233
1st Resistance: 1.3338
Risk Warning:
Trading Forex and CFDs carries a high level of risk to your capital and you should only trade with money you can afford to lose. Trading Forex and CFDs may not be suitable for all investors, so please ensure that you fully understand the risks involved and seek independent advice if necessary.
Disclaimer:
The above opinions given constitute general market commentary, and do not constitute the opinion or advice of IC Markets or any form of personal or investment advice.
Any opinions, news, research, analyses, prices, other information, or links to third-party sites contained on this website are provided on an "as-is" basis, are intended only to be informative, is not an advice nor a recommendation, nor research, or a record of our trading prices, or an offer of, or solicitation for a transaction in any financial instrument and thus should not be treated as such. The information provided does not involve any specific investment objectives, financial situation and needs of any specific person who may receive it. Please be aware, that past performance is not a reliable indicator of future performance and/or results. Past Performance or Forward-looking scenarios based upon the reasonable beliefs of the third-party provider are not a guarantee of future performance. Actual results may differ materially from those anticipated in forward-looking or past performance statements. IC Markets makes no representation or warranty and assumes no liability as to the accuracy or completeness of the information provided, nor any loss arising from any investment based on a recommendation, forecast or any information supplied by any third-party.

Bullish bounce?GBP/USD is reacting of the support level which is a pullback support that aligns with the 50% Fibonacci retracement and could rise from this level to our take profit.
Entry: 1.3336
Why we like it:
There is a pullback support level that line sup with the 50% Fibonacci retracement.
Stop loss: 1.3299
Why we like it:
There is a pullback support level that is slightly above the 78.6% Fibonacci retracement.
Take profit: 1.3402
Why we like it:
There is a pullback resistance level.
Enjoying your TradingView experience? Review us!
Please be advised that the information presented on TradingView is provided to Vantage (‘Vantage Global Limited’, ‘we’) by a third-party provider (‘Everest Fortune Group’). Please be reminded that you are solely responsible for the trading decisions on your account. There is a very high degree of risk involved in trading. Any information and/or content is intended entirely for research, educational and informational purposes only and does not constitute investment or consultation advice or investment strategy. The information is not tailored to the investment needs of any specific person and therefore does not involve a consideration of any of the investment objectives, financial situation or needs of any viewer that may receive it. Kindly also note that past performance is not a reliable indicator of future results. Actual results may differ materially from those anticipated in forward-looking or past performance statements. We assume no liability as to the accuracy or completeness of any of the information and/or content provided herein and the Company cannot be held responsible for any omission, mistake nor for any loss or damage including without limitation to any loss of profit which may arise from reliance on any information supplied by Everest Fortune Group.

GBP/CHF BULLS ARE GAINING STRENGTH|LONG
GBP/CHF SIGNAL
Trade Direction: long
Entry Level: 1.098
Target Level: 1.103
Stop Loss: 1.095
RISK PROFILE
Risk level: medium
Suggested risk: 1%
Timeframe: 1h
Disclosure: I am part of Trade Nation's Influencer program and receive a monthly fee for using their TradingView charts in my analysis.
✅LIKE AND COMMENT MY IDEAS✅

Investment Opportunity LONG GBP/AUD
The current market setup offers an interesting LONG opportunity on the GBP/AUD pair, with an entry point at 2.0586. The optimized strategy includes a Take Profit (TP) of 3% and a Stop Loss (SL) of 1%, ensuring an adequate risk/reward ratio for the management of the trade.
Technical Analysis
The GBP/AUD pair presents several bullish signals: ✅ Well-established key support in the 2.0586 area. ✅ 50-period moving average supporting the positive trend. ✅ RSI in the bullish zone, suggesting favorable momentum for a continuation of the uptrend.
Fundamental Rationale
The strategy is supported by macroeconomic and fundamental factors: 📊 The Bank of England maintains a favorable approach to the British pound. 📉 The Australian dollar shows signs of weakness related to global economic uncertainty. 🌍 UK macro data stronger than Australian, confirming the relative strength of the pound.
Trading Strategy
🔹 LONG Entry: 2.0586 🔹 Take Profit (TP): +3% from entry level, exploiting the growth potential. 🔹 Stop Loss (SL): -1%, protecting the position from excessive volatility. 🔹 Dynamic Management: Continuous monitoring for possible adjustments based on market conditions.
Conclusion
The updated strategy optimizes risk and potential reward, offering a solid setup to capitalize on the growth of GBP/AUD. As always, it is advisable to accompany the trade with effective risk management and careful monitoring of market conditions.

GJ Ideasmall idea for this trade, I hate typing when i'm not looking at the charts so this might be easier lol
