GBP/CAD: Full Prediction With 3 Entries Available Watch Now Disclaimer : The content on this analysis is subject to change at any time without notice, and is provided for the sole purpose of assisting traders to make independent investment decisions.
Gbpcadforecast

GBPCAD H4 LONG PRICE ACTION FORECAST -UPDATE-After the double top spotted from D1, the price action has been under a healthy correction. After the capturing of the bearish movement where the T/P is about to get hit allows the setup of a long entry to ride the upward momentum back to the previous swing high.
A buy setup is placed with the following features.
The order:
Type: buy-limit
S/L: 87 pips - R:R | 1:4 -
T/P: previous high
--
*** If you like the idea, don't be shy, click on like and comment. If you do not agree, just comment ;-) | Thanks for your support!!! ***

GBPCAD, daily timeframe, 5th wave of Elliott WaveHello my friends,
Today i noticed some good setup from GBPCAD. Previously this pair make an inverted shoulders head pattern and then push straight to the upside for 700 pips in 2 weeks.
I tried to fit some fibonacci tools into it and count the waves according to Elliot Waves principle. Surprisingly, it looks like this pair just finished with the 4th Wave.
Wave-4 is the shortest wave and usually it stopped at 38.2 fibonacci retracement.
We could possibly see wave-5 from this point onwards and usually it ends at 127% fibonacci retracement of Wave-4
Wave-4 could never touch the area of Wave-1 so we could use stop loss a little below Wave-1. In this case, my stop loss is at 1.7200
Buy GBPCAD 1.7395
Stop loss 1.7200
Take profit 1 @1.7675
Take profit 2 @1.7870

GBPCAD ON THE VERGE OF A REVERSAL?!**ENG**
- Price breaking our consolidation box and is now heading for a retest, we are expecting more downside after this same retest, wait for an entry confirmation before entering, look at the lower timeframes (such as 15min).
**PT**
- Preço a quebrar a nossa box de consolidação e está de momento a caminho de efetuar um retest, estamos à espera de um drop maior este mesmo retest, o ideal será aguardar por uma confirmação de entrada em timeframes inferiores (assim como 15min).

GBPCAD H4 SHORT PRICE ACTION FORECAST The pair has been trading within a channel from a broader look (W1). Price has tested the resistance level from the structure. Now, it should move downward to complete the next leg towards the channel's support line.
At H4, the price could not form a new fresh high, signaling the bearish pressure. After the current strong bearish candle, a pullback towards the recently broken support zone from the previous consolidation should be tested to trigger a short entry.
The order:
Type: sell-limit
S/L: 77 pips - R:R | 1:2.3 -
T/P: Fib level 0.5 as reversal point.
--
*** If you like the idea, don't be shy, click on like and comment. If you do not agree, just comment ;-) | Thanks for your support!!! ***


GBPCAD Short Trade IdeaHello traders, here is the analysis for GBPCAD. NOTE please do your own analysis before taking the trade. Let me know if you guys have any questions in the comment section. If you guys like my analysis please hit like. Thanks.


GBPCAD long wayI expect it to start moving up from the support zone, I have 2 targets
Please support by leaving LIKE


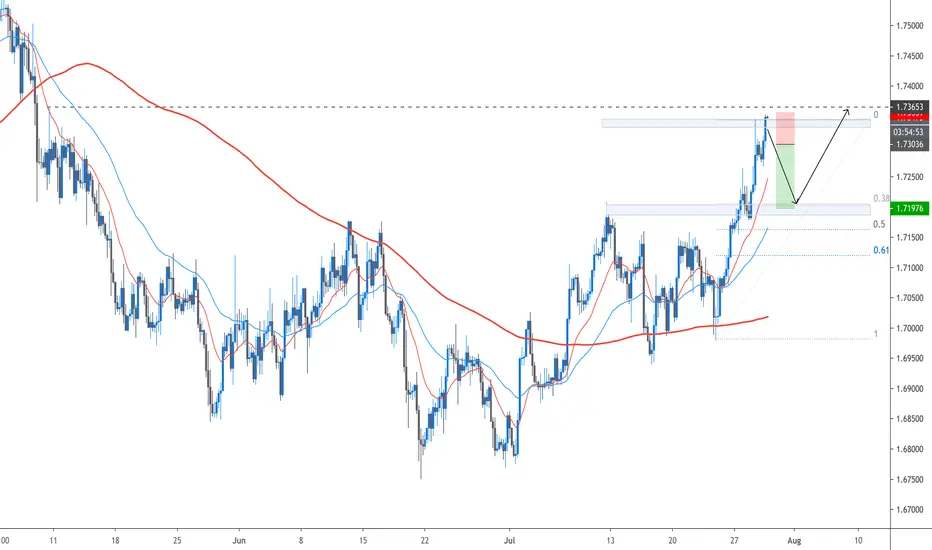
GBPCAD H4 SHORT PRICE ACTION FORECAST Price is currently trying to break the previous high. If it fails to breakthrough forming a new high, it will create a subtle double top pattern for a correction. A short entry can be taken to capture the downward movement towards the FIB level before the next impulse for the trend continuation.
The counter-trend entry should be monitored cautiously, as the price could revert before reaching the T/P level. If everything, as forecasted, happens, it will also allow the setup of a long entry after confirmation of bullish continuation.
The order:
Type: sell-stop
S/L: 53 pips - R:R | 1:2 -
T/P: FIB level
--
*** If you like the idea, don't be shy, click on like and comment. If you do not agree, just comment ;-) | Thanks for your support!!! ***
GBPCAD bounced from support, potential for a further rise!
GBPCAD bounced off 1.70845 where it could potentially rise further to 1.73784.
Trading CFDs on margin carries high risk.
Losses can exceed the initial investment so please ensure you fully

GBPCAD to climb from upside confirmation, potential bounce!
GBPCAD to climb from its upside confirmation at 1.71889 where it could potentially bounce further to 1.75765.
Trading CFDs on margin carries high risk.
Losses can exceed the initial investment so please ensure you fully
understand the risks.

GBPCAD REACHED @ STRONG RESISTANCE AREA !!!We are selling this pair from a strong resistance level
we already achieved our target on this pair have look on our past post on this pair
as we see strength in CAD because of higher oil price after open lockdown
so we trade this pair with low risk and higher rewards
guys if u like our idea kindly support us
we appreciate ur likes and comments
follow us for more updates


GBPCAD reversed from resistance, potential drop!
GBPCAD reversed off its resistance at 1.71304 where it could potentially drop further to 1.69500.
Trading CFDs on margin carries high risk.
Losses can exceed the initial investment so please ensure you fully
understand the risks.

GBPCAD approaching support, potential for a further rise!
GBPCAD approaching support at 1.70751 where it could potentially rise further to 1.71571.
Trading CFDs on margin carries high risk.
Losses can exceed the initial investment so please ensure you fully
understand the risks.


GBPCAD TRADE IDEAGBPCAD - Downward channel here. Looking like we may see some form of rejection around the upper channel trend line. Lines up well with the resistance level and double top. As mentioned on the note, we will need to wait for rejection at our targeted zone.

GBPCAD | WEEKLY PERSPECTIVEWith over 170pips in our direction since my last publication (see link below for reference purpose), the British Pound appears to begin a new wave of Bullish run as it completes a 50% retracement at Demand zone (neckline) since Breakout occurred at the beginning of the month (July 2020).
Tendency: Uptrend ( Bullish )
Structure: Double Bottom | Correction
Observation: i. A correction into the neckline (Demand zone @ 1.69500) of my Double Bottom incites a possible uptrend continuation in the following week as price makes new Support..
Trading plan: BUY confirmation with a minimum potential profit of 300 pips.
Risk/Reward: 1:2.5
Potential Duration: 4 to 10 days
NB: This speculation can be considered to make decisions on lower timeframes.
Watch this space for updates as price action is been monitored.
NirvanaForex
Risk Disclaimer:
Margin trading in the foreign exchange market (including foreign exchange trading, CFDs, etc.) has a high risk and is not suitable for all investors. The content of this speculation (including all data) is organized and published by me for the sole purpose of education and assistance in making independent investment decisions. All information herein is for your reference only and I take no responsibility.
You are hereby advised to carefully consider your investment experience, financial situation, investment objective, risk tolerance level and consult your independent financial adviser as to the suitability of your situation prior to making any investment.
I do not guarantee its accuracy and is not liable for any loss or damage which may result directly or indirectly from such content or the receipt of any instruction or notification therewith.
Past performance is not necessarily indicative of future results.


GBPCAD Short trade planHello traders, here is the trade plan for GBPCAD. For trade entry details please refer to the chart. Let me know if you guys have any questions in the comment section. If you guys like my analysis please hit like. Thanks.
