XAU/USD | Gold at a Turning Point – Breakout or Breakdown Ahead?By analyzing the gold chart on the 4-hour timeframe, we can see that after our last analysis, gold continued its correction and dropped to $3358. It’s currently trading around $3367, and for the bullish scenario to remain valid, we need to see price hold above $3358 and soon close above $3370. If this happens, another bullish move could follow.
Otherwise, if gold breaks and stabilizes below $3358, this scenario will be invalidated, and the alternative outlook suggests further downside toward $3349 and $3339. This analysis will be updated — and don’t forget to show your support, friends!
Please support me with your likes and comments to motivate me to share more analysis with you and share your opinion about the possible trend of this chart with me !
Best Regards , Arman Shaban
GBPUSD

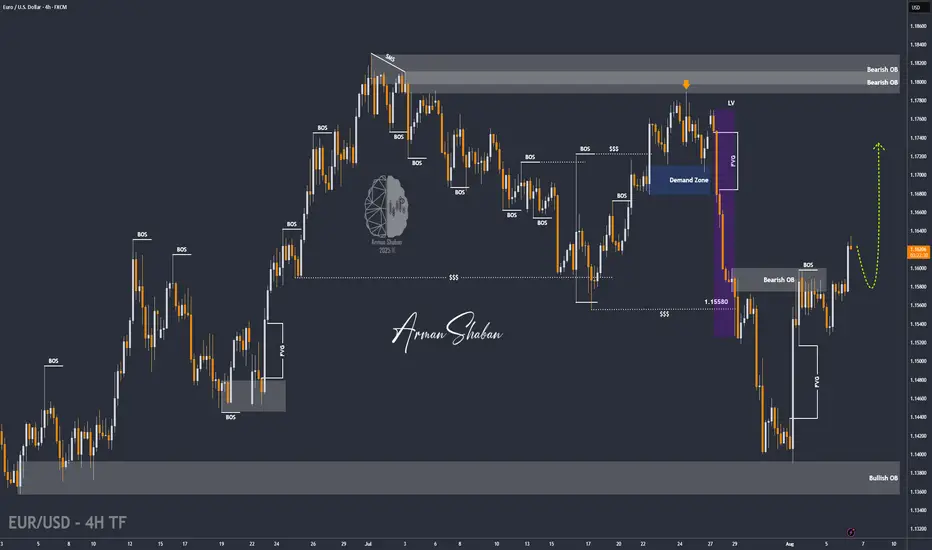
EUR/USD | Holding Above 1.16 Could Unlock More Upside! (READ IT)By analyzing the EURUSD chart on the 4-hour timeframe, we can see that the price reacted beautifully to all the marked zones on the chart. Especially after reaching the 1.14 demand area, it experienced a strong bullish move, rallying over 200 pips to hit 1.16. Currently, EURUSD is trading around 1.16220, and if it holds above the 1.16 level, we can expect further upside. The next bullish targets are 1.16435, 1.16780, 1.17100, and 1.17500.
Please support me with your likes and comments to motivate me to share more analysis with you and share your opinion about the possible trend of this chart with me !
Best Regards , Arman Shaban
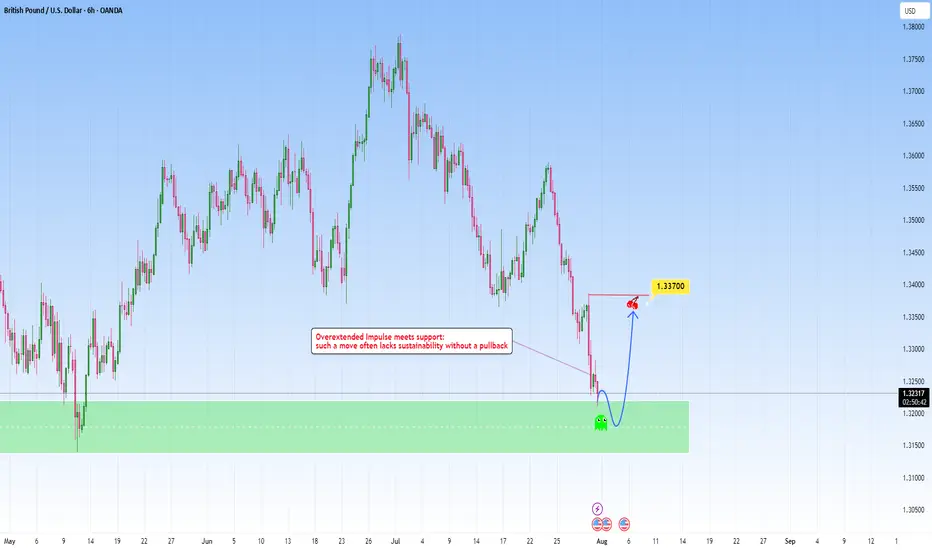
GBPUSD: Overextended move meets with supportAfter a steep and aggressive sell-off, price has tapped into a clear zone. This recent move wasn't gradual: it was impulsive and sharp, which tells us one key thing: exhaustion is likely.
The overextension into it without any meaningful pullback typically highlights imbalance, where price moves ahead of structure and becomes vulnerable to correction. But price doesn’t move in straight lines forever. Markets that fall too quickly tend to burn out just as fast. When such aggressive pushes meet with a clean, resistance like this one, they often trigger the exact opposite, a snapback correction.
I am now watching for signs of absorption and accumulation. This could play out in the form of sideways candles, wick rejections, or a sudden reversal spike. These are early signs that smart money might be stepping in.
My projected target would be toward the 1.33700 area, from the last impulsive drop. It’s a classic mean reversion setup, not just technical but psychological. Traders who chased the move late may find themselves trapped, fueling the correction as they’re forced to exit.
XAU/USD | Bounce in Play – Watching $3350 Support for Next Move!By analyzing the gold chart on the 4-hour timeframe, we can see that after hitting the first target at $3361, gold continued its rally and reached our second supply level at $3385. Upon reaching this key level, the price faced strong selling pressure, dropping over 350 pips down to $3349. Gold is now trading around $3363, and if it can hold above the $3350 support level, we could expect another bullish push. The next upside targets are $3367, $3375, and $3385. This analysis will be updated in the coming hours with your continued support!
Please support me with your likes and comments to motivate me to share more analysis with you and share your opinion about the possible trend of this chart with me !
Best Regards , Arman Shaban

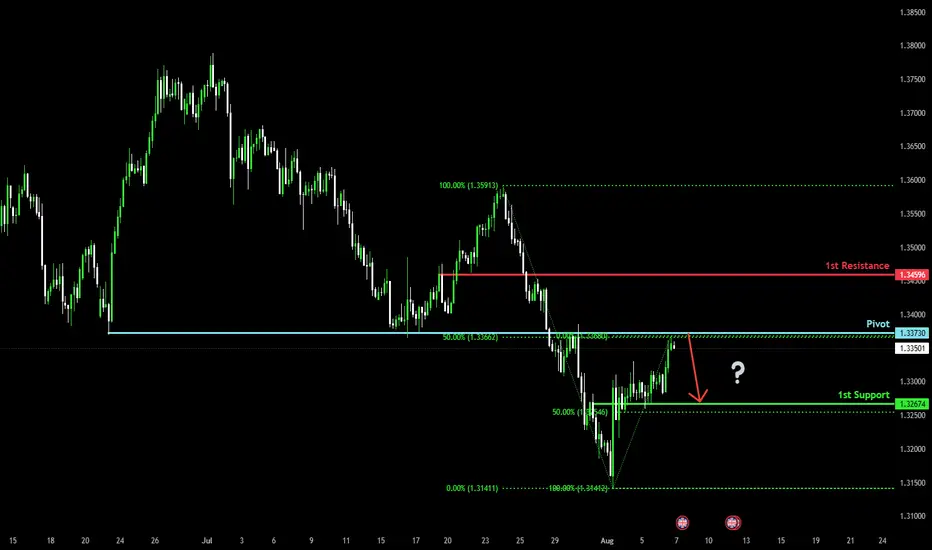
Bearish reversal?The Cable (GBP/USD) is rising towards the pivot which acts as an overlap resistance that lines up with the 50% Fibonacci retracement and could drop to the 1st support.
Pivot: 1.3373
1st Support: 1.3267
1st Resistance: 1.3459
Risk Warning:
Trading Forex and CFDs carries a high level of risk to your capital and you should only trade with money you can afford to lose. Trading Forex and CFDs may not be suitable for all investors, so please ensure that you fully understand the risks involved and seek independent advice if necessary.
Disclaimer:
The above opinions given constitute general market commentary, and do not constitute the opinion or advice of IC Markets or any form of personal or investment advice.
Any opinions, news, research, analyses, prices, other information, or links to third-party sites contained on this website are provided on an "as-is" basis, are intended only to be informative, is not an advice nor a recommendation, nor research, or a record of our trading prices, or an offer of, or solicitation for a transaction in any financial instrument and thus should not be treated as such. The information provided does not involve any specific investment objectives, financial situation and needs of any specific person who may receive it. Please be aware, that past performance is not a reliable indicator of future performance and/or results. Past Performance or Forward-looking scenarios based upon the reasonable beliefs of the third-party provider are not a guarantee of future performance. Actual results may differ materially from those anticipated in forward-looking or past performance statements. IC Markets makes no representation or warranty and assumes no liability as to the accuracy or completeness of the information provided, nor any loss arising from any investment based on a recommendation, forecast or any information supplied by any third-party.
GBPUSD - Looking To Sell Pullbacks In The Short TermH4 - Strong bearish move.
No opposite signs.
Currently it looks like a pullback is happening.
Expecting bearish continuation until the two Fibonacci resistance zones hold.
If you enjoy this idea, don’t forget to LIKE 👍, FOLLOW ✅, SHARE 🙌, and COMMENT ✍! Drop your thoughts and charts below to keep the discussion going. Your support helps keep this content free and reach more people! 🚀

GBP/USD: Sell setup shaping upHey everyone, what’s your take on GBP/USD right now?
After breaking below the trendline, GBP/USD tried to retest the area but failed to hold. Price is now hovering around 1.329, and the selling pressure is still clearly present.
This current setup is aiming toward the Fibonacci 1.618 extension zone around 1.287. In the short term, a pullback could play out based on Dow Theory, and the highlighted zone might offer a prime shorting opportunity.
My bias: SELL on the retest — with tight risk management, clear TP and SL in place.
Now it’s your turn — what’s your outlook? Drop your thoughts in the comments below.
Good luck and trade smart! 💼📉

GBPUSD at make or break level ahead of a split BOEThe BOE faces a pivotal moment as it prepares to announce its latest interest rate decision.
With MPC members split between hawkish concerns about stubborn inflation and dovish worries over a weakening job market, expectations are swirling about the path forward.
Will the BOE signal a pause after this cut, or will inflation surprises force a more cautious, hawkish stance going into the end of the year?
Traders are watching for clues in the updated forecasts, as even a minor shift could spark major volatility in GBP/USD.
If the BOE sounds hawkish—maybe they raise their inflation forecasts, or the vote split shows strong resistance to further cuts, or they signal a pause in easing—then GBPUSD might have found a bottom for now.
On the flip side, if the BOE puts more emphasis on economic risks, reduces its GDP outlook, or if the vote split shows a strong push for even bigger cuts, then the pound could come under pressure.
On the charts, Cable is clinging to 1.3375, with a potential developing head and shoulders pattern threatening a deeper move lower if the neckline breaks.
Will the upcoming BOE decision be the make-or-break catalyst for the pound?
This content is not directed to residents of the EU or UK. Any opinions, news, research, analyses, prices or other information contained on this website is provided as general market commentary and does not constitute investment advice. ThinkMarkets will not accept liability for any loss or damage including, without limitation, to any loss of profit which may arise directly or indirectly from use of or reliance on such information.

GBPUSD – Trendline Broken, More Downside Ahead?Hello traders! What’s your take on GBPUSD?
The GBP/USD pair has broken below its long-term ascending trendline and is now trading beneath a key resistance zone. After a failed breakout at the newly formed trendline, price quickly reversed and dropped sharply.
This resistance zone previously acted as a strong support level but has now been flipped to resistance. If price fails to reclaim this area during the next pullback, the bearish outlook will be further confirmed.
💬 Do you think GBPUSD will bounce from the 1.32 region, or will it continue falling toward the lower targets? Share your thoughts below!

GBPUSD – DAILY FORECAST Q3 | W32 | D7 | Y25📊 GBPUSD – DAILY FORECAST
Q3 | W32 | D7 | Y25
Daily Forecast 🔍📅
Here’s a short diagnosis of the current chart setup 🧠📈
Higher time frame order blocks have been identified — these are our patient points of interest 🎯🧭.
It’s crucial to wait for a confirmed break of structure 🧱✅ before forming a directional bias.
This keeps us disciplined and aligned with what price action is truly telling us.
📈 Risk Management Protocols
🔑 Core principles:
Max 1% risk per trade
Only execute at pre-identified levels
Use alerts, not emotion
Stick to your RR plan — minimum 1:2
🧠 You’re not paid for how many trades you take, you’re paid for how well you manage risk.
🧠 Weekly FRGNT Insight
"Trade what the market gives, not what your ego wants."
Stay mechanical. Stay focused. Let the probabilities work.
FX:GBPUSD

GBPUSD LONGCheck comment for the proper multi-timeframe layout due to TradingViews publishing restriction
MT5 screenshot also attached.
Still moving in line with the bullish bias I shared in Monday’s post.
Things may shift eventually, but for now — we ride it.
4H supply in control, aligned with weekly demand. 5M demand held strong.
Waited for price to return to the mapped zone, dropped to 15s for execution.
Tapped out after 3RR achieved — not more, not less.
Same system. Same pair. Different day.

GBPUSD Approaching Key Psychological Zones!Hey friends 👋
Here’s a fresh GBPUSD analysis I’ve prepared for you. I’m planning to open a **buy** position between **1.32506 – 1.32246**, aiming for a target level of **1.33298**.
Every single like you send my way is a huge source of motivation for me to keep sharing these insights. Big thanks to everyone supporting with a like 🙏

Market Analysis: GBP/USD Rebounds CautiouslyMarket Analysis: GBP/USD Rebounds Cautiously
GBP/USD is attempting a recovery wave above the 1.3215 resistance.
Important Takeaways for GBP/USD Analysis Today
- The British Pound is attempting a fresh increase above 1.3265.
- There is a contracting triangle forming with resistance at 1.3375 on the hourly chart of GBP/USD.
GBP/USD Technical Analysis
On the hourly chart of GBP/USD, the pair declined after it failed to clear the 1.3600 resistance. As mentioned in the previous analysis, the British Pound even traded below the 1.3350 support against the US Dollar.
Finally, the pair tested the 1.3140 zone and is currently attempting a fresh increase. The bulls were able to push the pair above the 50-hour simple moving average and 1.3215. The pair even climbed above the 1.3265 level.
The bulls were able to push the pair above the 50% Fib retracement level of the downward move from the 1.3385 swing high to the 1.3141 low.
On the upside, the GBP/USD chart indicates that the pair is facing resistance near 1.3375. There is also a contracting triangle forming with resistance at 1.3375 and the 76.4% Fib retracement level of the downward move from the 1.3385 swing high to the 1.3141 low.
The next major resistance is near 1.3385. A close above the 1.3385 resistance zone could open the doors for a move toward 1.3450. Any more gains might send GBP/USD toward 1.3550.
On the downside, there is decent support forming at 1.3265. If there is a downside break below 1.3265, the pair could accelerate lower. The first major support is near the 1.3215 level. The next key support is seen near 1.3140, below which the pair could test 1.3050. Any more losses could lead the pair toward 1.3000.
This article represents the opinion of the Companies operating under the FXOpen brand only. It is not to be construed as an offer, solicitation, or recommendation with respect to products and services provided by the Companies operating under the FXOpen brand, nor is it to be considered financial advice.

GBPUSD Ahead of BoE rate decisionThe GBPUSD remains in a bullish trend, with recent price action showing signs of a oversold really within the broader uptrend.
Support Zone: 1.3255 – a key level from previous consolidation. Price is currently testing or approaching this level.
A bullish rebound from 1.3255 would confirm ongoing upside momentum, with potential targets at:
1.3440 – initial resistance
1.3510 – psychological and structural level
1.3600 – extended resistance on the longer-term chart
Bearish Scenario:
A confirmed break and daily close below 1.3255 would weaken the bullish outlook and suggest deeper downside risk toward:
1.3210 – minor support
1.3170 – stronger support and potential demand zone
Outlook:
Bullish bias remains intact while the GBPUSD holds above 1.3255. A sustained break below this level could shift momentum to the downside in the short term.
This communication is for informational purposes only and should not be viewed as any form of recommendation as to a particular course of action or as investment advice. It is not intended as an offer or solicitation for the purchase or sale of any financial instrument or as an official confirmation of any transaction. Opinions, estimates and assumptions expressed herein are made as of the date of this communication and are subject to change without notice. This communication has been prepared based upon information, including market prices, data and other information, believed to be reliable; however, Trade Nation does not warrant its completeness or accuracy. All market prices and market data contained in or attached to this communication are indicative and subject to change without notice.

How could GBPUSD react to the BoE's rate decision?We are waiting for the BoE today to deliver its rate decision. Although we know the potential outcome, still, the reaction in MARKETSCOM:GBPUSD will be heavily monitored.
Let's dig in.
FX_IDC:GBPUSD
Let us know what you think in the comments below.
Thank you.
75.2% of retail investor accounts lose money when trading CFDs with this provider. You should consider whether you understand how CFDs work and whether you can afford to take the high risk of losing your money. Past performance is not necessarily indicative of future results. The value of investments may fall as well as rise and the investor may not get back the amount initially invested. This content is not intended for nor applicable to residents of the UK. Cryptocurrency CFDs and spread bets are restricted in the UK for all retail clients.

GBPUSD 4H: retest done - bearish continuation beginsOn the 4H chart, GBPUSD has completed a textbook head and shoulders pattern. The neckline has already been broken, and the price is now finalizing a retest around 1.3365–1.3380, where the 0.5 Fibo level also lies. This confirms a trend reversal, with the market preparing for the next leg down.
MA and EMA are above the current price, adding pressure to the downside. RSI remains neutral, and volume is shifting in favor of bears. The key resistance zone at 1.3365 has been tested from below, and the price is beginning to roll over - a classic bearish continuation signal.
Targets: 1.3240 first, then 1.3150 and potentially 1.2 870 if momentum builds. The invalidation point is a close above 1.3365, which is not likely at this stage.
Fundamentals support the move: the dollar remains strong as the Fed holds its hawkish stance, while the UK economy continues to show weakness across services and manufacturing.
Neckline broken ✅
Retest done ✅
Momentum building ✅
The setup is complete — time to follow the structure.

GBPUSD SHORTKeep tight, this aria can send us just all the way down, around 200 pips.
If reward worth the risk, I will take it all day long 💪

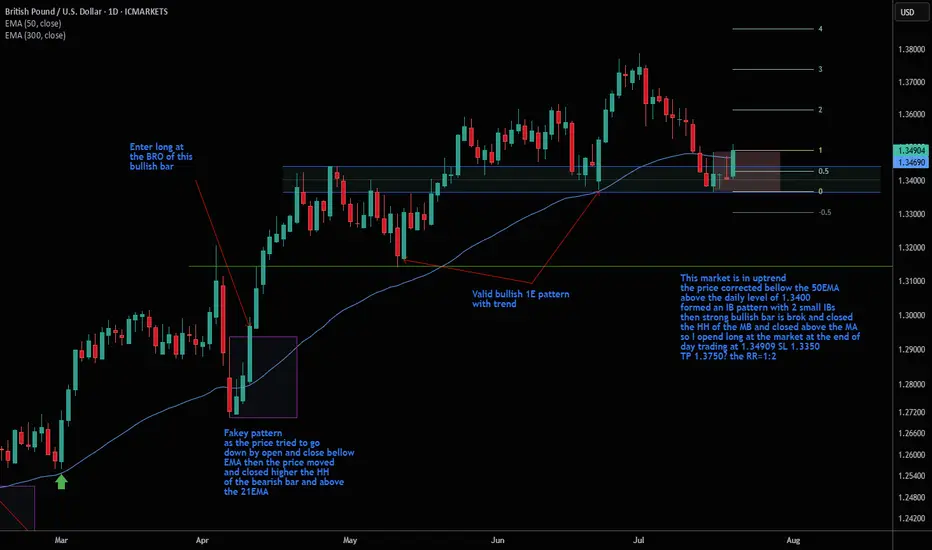
IB pattern after correction bellow the 50EMAThis market is in uptrend
it has been in a correction phase
it reached bellow the 50EMA and near the strong
daily support zone of 1.34000
then it formed a nice IB pattern
which is triggered after the breakout and close the
HH of the MB and above the 50EMA
so I opend at the end of day a buy order at the market
at 1.34909
SL 1.33500
TP 1.37500
so the RR=1:2
GBPUSD Massive Short! SELL!
My dear friends,
My technical analysis for GBPUSD is below:
The market is trading on 1.3309 pivot level.
Bias - Bearish
Technical Indicators: Both Super Trend & Pivot HL indicate a highly probable Bearish continuation.
Target - 1.3295
Recommended Stop Loss - 1.3316
About Used Indicators:
A pivot point is a technical analysis indicator, or calculations, used to determine the overall trend of the market over different time frames.
Disclosure: I am part of Trade Nation's Influencer program and receive a monthly fee for using their TradingView charts in my analysis.
———————————
WISH YOU ALL LUCK

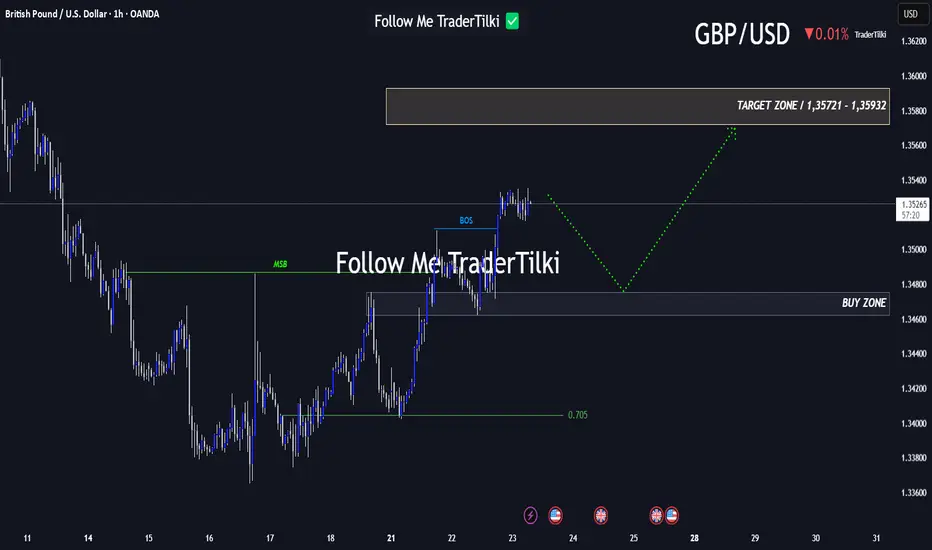
Every Like Is a Boost: This GBPUSD Analysis Is Just for You!Good morning, friends 🌞
Due to the recent shift in GBPUSD’s market structure, I plan to enter a buy position when price reaches the 1.34753 – 1.34623 range.
Target levels: 1.35721 and 1.35932 📈
Every like you send fuels my motivation to share fresh analyses. Thank you to everyone who’s supporting this journey ❤️
GBPUSD – DAILY FORECAST Q3 | W32 | D6 | Y25📊 GBPUSD – DAILY FORECAST
Q3 | W32 | D6 | Y25
Daily Forecast 🔍📅
Here’s a short diagnosis of the current chart setup 🧠📈
Higher time frame order blocks have been identified — these are our patient points of interest 🎯🧭.
It’s crucial to wait for a confirmed break of structure 🧱✅ before forming a directional bias.
This keeps us disciplined and aligned with what price action is truly telling us.
📈 Risk Management Protocols
🔑 Core principles:
Max 1% risk per trade
Only execute at pre-identified levels
Use alerts, not emotion
Stick to your RR plan — minimum 1:2
🧠 You’re not paid for how many trades you take, you’re paid for how well you manage risk.
🧠 Weekly FRGNT Insight
"Trade what the market gives, not what your ego wants."
Stay mechanical. Stay focused. Let the probabilities work.
FX:GBPUSD

USD may weaken in the futureExperts say the USD is still under pressure after the US economy announced a "shocking" non-farm payrolls report for July and revised the May and June figures down sharply compared to forecasts and previous figures.
Experts say the rapidly weakening job market is fueling speculation that the US Federal Reserve (Fed) will soon cut interest rates in September.
However, in the last session, the USD basically stopped falling sharply, when data on the US service and aggregate purchasing managers' indexes increased quite well in July. This has helped the USD not to fall too much.
The USD is expected to remain volatile when the US announces weekly employment on Thursday. Next week is the July consumer price index (CPI). This is an important indicator for the Fed to make a decision on interest rate policy at its meeting in September. This index will strongly affect the trend of the USD.

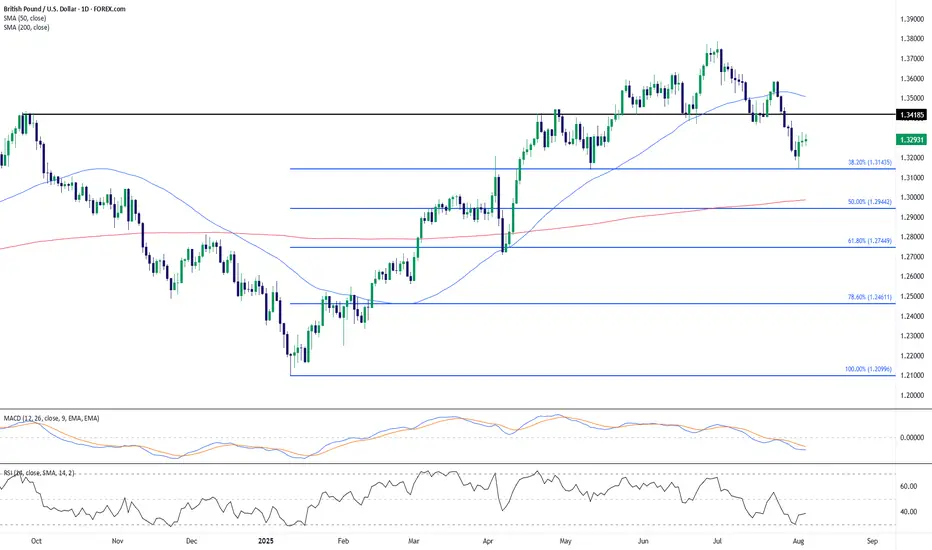
GBP/USD: Bullish Bounce from Fibonacci SupportCable has recently rebounded off the 38.2% Fibonacci retracement level around 1.3145, suggesting initial downside momentum is losing steam after the July high near 1.38. This bounce comes as RSI begins turning up from oversold territory (38.70), potentially hinting at early bullish divergence. Meanwhile, the MACD remains bearish, though its histogram shows signs of contraction.
Price action has slipped below the 50-day SMA (1.3508), but is still well above the 200-day SMA (1.2986), keeping the broader bullish structure intact. The area between 1.3145 and the 1.2940 (50% retracement) remains key support, while 1.3418 – a prior support now turned resistance – may act as a ceiling for any rebound attempts.
Key Takeaways:
Price has reacted positively to the 38.2% Fib level.
MACD remains weak but shows early signs of slowing downside.
RSI is attempting to reverse from near-oversold conditions.
1.3418 is the level to beat for bulls; below 1.3145 could open room to 1.2940.
Until we see a daily close above the prior support at 1.3418, upside may be limited to a corrective phase within a broader pullback. Short-term bullish attempts are likely to remain fragile unless supported by improving momentum and a reclaim of the 50-day SMA.
-MW