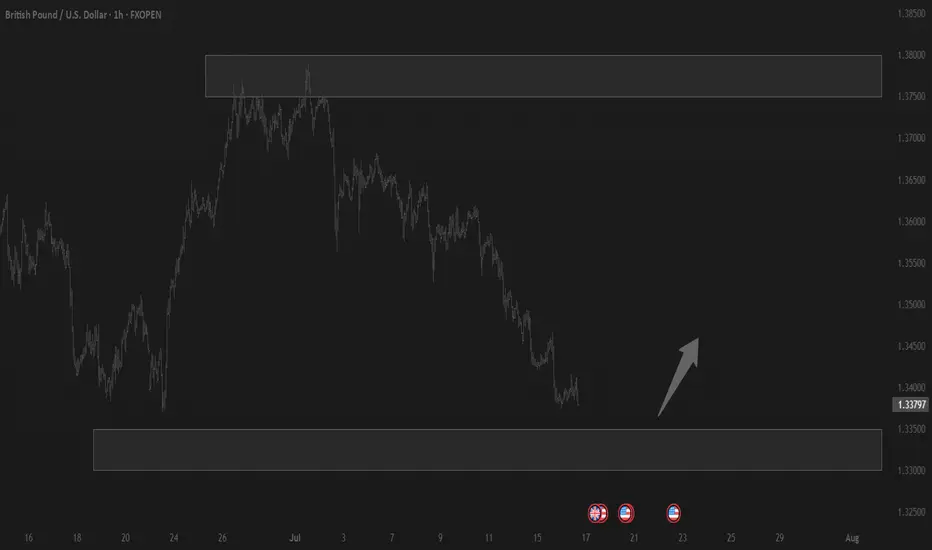
Trading balanceTrading balance The price of the asset has rebounded from the balance zone. With the prospect of growth into the resistance zone.
GBPUSD
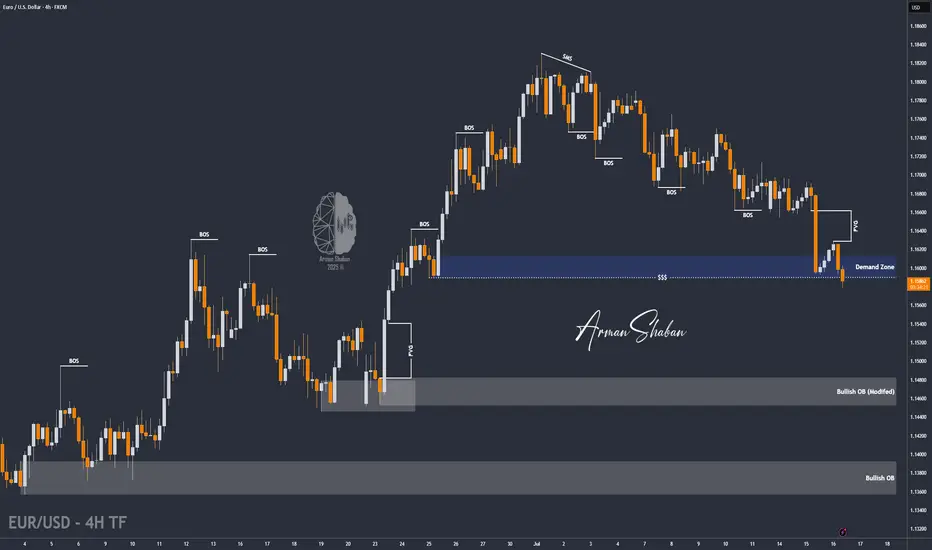
EUR/USD : Another Fall Ahead ? (READ THE CAPTION)By analyzing the EURUSD chart on the 4-hour timeframe, we can see that the price is currently breaking through the 1.16–1.158 zone. If it manages to hold below 1.159, we can expect further downside movement. The next targets for EURUSD are 1.15580, 1.154, and 1.148.
Please support me with your likes and comments to motivate me to share more analysis with you and share your opinion about the possible trend of this chart with me !
Best Regards , Arman Shaban
16.07.2025 #GBPUSDBUY 1.34000 | STOP 1.33600 | TAKE 1.34500 | ⏳ Close the trade in profit or move Stop Loss to breakeven after the price passes +25 pips.

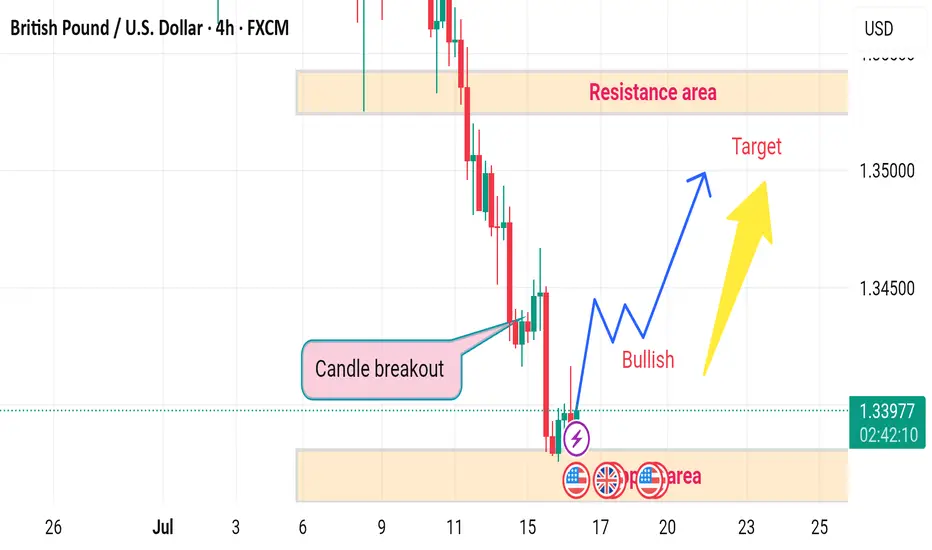
GBPUSD H4 RISESDisruption Analysis – GBP/USD (4H)
🕯️ Candle Breakout Misleading
The marked “Candle Breakout” area is followed by weak bullish momentum, but lacks strong volume confirmation or higher timeframe reversal structure.
The quick rejection after the breakout may indicate a false breakout, not a sustainable trend reversal.
⚠️ Demand Zone Weakness
The “Support Area” (demand zone) has already been tested multiple times.
Multiple touches weaken the demand zone—buyers may be exhausted, increasing the chances of a breakdown instead of a bounce.
📉 Macro Trend Still Bearish
The recent sharp downtrend shows a strong bearish structure (lower highs, lower lows).
A few bullish candles are not enough to confirm a reversal—this could just be a retracement.
💣 Upcoming Fundamental Risks
The presence of multiple economic event icons (UK & US flags) indicates high-impact news—could result in unexpected volatility or trend reversals.
Fundamental factors may disrupt the projected bullish move entirely.
🎯 Bullish Target Overoptimistic
Target near 1.35000 lies within the Resistance Area, which has previously caused sharp rejections.
Without a strong breakout above 1.3400, this target is unrealistic in current market conditions.
GBPUSD h4 big downhe resistance at 1.36554 may be weak due to:
Multiple taps already
Reduced seller interest
A breakout above this zone could trigger short covering → sharp rally
✅ 2. Higher Low Structure
Recent low at 1.35475 held strong
Current consolidation appears like a bullish flag or accumulation range
Could indicate continuation, not rejection
GBPUSD SELL IDEA Fakeout Reversal Setup
If price dips into the support at 1.35475 again, it might:
Trap breakout traders
Reverse and form a new impulse leg upward
Target = 1.3700–1.3750 zone
Disruption Path: Bullish Breakout
Minor dip or tight range around current price
Break and hold above 1.3655
Acceleration toward 1.3700–1.3750
Disruption Invalidation
A strong close below 1.3540 with volume

GBPUSD LONG FORECAST Q3 D16 W29 Y25GBPUSD LONG FORECAST Q3 D16 W29 Y25
Welcome back to the watchlist GBPUSD ! Let's go long ! Alignment across all time frames.
Professional Risk Managers👋
Welcome back to another FRGNT chart update📈
Diving into some Forex setups using predominantly higher time frame order blocks alongside confirmation breaks of structure.
Let’s see what price action is telling us today!
💡Here are some trade confluences📝
✅Daily order block
✅1H Order block
✅Intraday breaks of structure
✅4H Order block
📈 Risk Management Principles
🔑 Core Execution Rules
Max 1% risk per trade
Set alerts — let price come to your levels
Minimum 1:2 RR
Focus on process, not outcomes
🧠 Remember, the strategy works — you just need to let it play out.
🧠 FRGNT Insight of the Day
"The market rewards structure and patience — not emotion or urgency."
Execute like a robot. Manage risk like a pro. Let the chart do the talking.
🏁 Final Words from FRGNT
📌 GBPUSD is offering textbook alignment — structure, order flow, and confirmation all check out.
Let’s approach the trade with clarity, conviction, and risk-managed execution.
🔑 Remember, to participate in trading comes always with a degree of risk, therefore as professional risk managers it remains vital that we stick to our risk management plan as well as our trading strategies.
📈The rest, we leave to the balance of probabilities.
💡Fail to plan. Plan to fail.
🏆It has always been that simple.
❤️Good luck with your trading journey, I shall see you at the very top.
🎯Trade consistent, FRGNT X

GBPUSD and EURUSD Analysis todayHello traders, this is a complete multiple timeframe analysis of this pair. We see could find significant trading opportunities as per analysis upon price action confirmation we may take this trade. Smash the like button if you find value in this analysis and drop a comment if you have any questions or let me know which pair to cover in my next analysis.

GBPUSD H1 I Bullish Bounce Off Based on the H1 chart analysis, we can see that the price is testing our buy entry at 1.3390, which is an overlap support.
Our take profit will be at 1.3439 which is a pullback resistance level.
The stop loss will be placed at 1.3333, which is a multi-swing low support level.
High Risk Investment Warning
Trading Forex/CFDs on margin carries a high level of risk and may not be suitable for all investors. Leverage can work against you.
Stratos Markets Limited (tradu.com ):
CFDs are complex instruments and come with a high risk of losing money rapidly due to leverage. 63% of retail investor accounts lose money when trading CFDs with this provider. You should consider whether you understand how CFDs work and whether you can afford to take the high risk of losing your money.
Stratos Europe Ltd (tradu.com ):
CFDs are complex instruments and come with a high risk of losing money rapidly due to leverage. 63% of retail investor accounts lose money when trading CFDs with this provider. You should consider whether you understand how CFDs work and whether you can afford to take the high risk of losing your money.
Stratos Global LLC (tradu.com ):
Losses can exceed deposits.
Please be advised that the information presented on TradingView is provided to Tradu (‘Company’, ‘we’) by a third-party provider (‘TFA Global Pte Ltd’). Please be reminded that you are solely responsible for the trading decisions on your account. There is a very high degree of risk involved in trading. Any information and/or content is intended entirely for research, educational and informational purposes only and does not constitute investment or consultation advice or investment strategy. The information is not tailored to the investment needs of any specific person and therefore does not involve a consideration of any of the investment objectives, financial situation or needs of any viewer that may receive it. Kindly also note that past performance is not a reliable indicator of future results. Actual results may differ materially from those anticipated in forward-looking or past performance statements. We assume no liability as to the accuracy or completeness of any of the information and/or content provided herein and the Company cannot be held responsible for any omission, mistake nor for any loss or damage including without limitation to any loss of profit which may arise from reliance on any information supplied by TFA Global Pte Ltd.
The speaker(s) is neither an employee, agent nor representative of Tradu and is therefore acting independently. The opinions given are their own, constitute general market commentary, and do not constitute the opinion or advice of Tradu or any form of personal or investment advice. Tradu neither endorses nor guarantees offerings of third-party speakers, nor is Tradu responsible for the content, veracity or opinions of third-party speakers, presenters or participants.

GBPUSD(20250716)Today's AnalysisMarket news:
① The annual rate of the overall CPI in the United States in June rose to 2.7%, the highest since February, in line with market expectations, and the monthly rate was 0.3%, the highest since January, in line with market expectations; the annual rate of the core CPI rose to 2.9%, the highest since February, lower than the expected 3%, but slightly higher than 2.8% last month, and the monthly rate was 0.2%, lower than the market expectation of 0.3%.
② Interest rate futures still show that the Fed is unlikely to cut interest rates this month, but there is a high possibility of a 25 basis point cut in September.
③ Fed mouthpiece: The CPI report will not change the Fed's policy direction.
④ Trump: Consumer prices are low and the federal funds rate should be lowered immediately. The Fed should cut interest rates by 3 percentage points.
⑤ Fed Collins: The core inflation rate is expected to remain at about 3% by the end of the year, and the Fed should maintain active patience.
Technical analysis:
Today's buying and selling boundaries:
1.3409
Support and resistance levels:
1.3497
1.3464
1.3443
1.3375
1.3354
1.3321
Trading strategy:
If the price breaks through 1.3409, consider buying, the first target price is 1.3443
If the price breaks through 1.3375, consider selling, the first target price is 1.3354

GBP/USD Drop: Something Big BrewingGBP/USD is cratering, hitting 1.3550 as weak UK economic data and a soaring dollar dominate. Markets look grim with supports shattered. A liquidity drop could trigger wild swings and wider spreads. Global news adds heat: Trump’s 35% tariff threats on Canada and BRICS nations stir trade war fears, crushing GBP. Stay alert, tighten risk.

GBPUSD is Nearing the Daily Trend!!!Hey Traders, in tomorrow's trading session we are monitoring GBPUSD for a buying opportunity around 1.34100 zone, GBPUSD is trading in an uptrend and currently is in a correction phase in which it is approaching the trend at 1.34100 support and resistance area.
Trade safe, Joe.
Cable looking for a new high with Ending DiagonalCable found some support in the last 24 hours and it looks like we may still see a retest of the high, so apparently this 5th wave is still in progress but unfolding with an ending diagonal with subwave five on the way up to 1.37–1.38, which could be the key resistance for this reversal pattern. So despite some recovery that is happening right now, we still think that the impulse from January is in late stages, which is also confirmed by divergence on the RSI and overlapping price action that clearly suggests that bulls are losing strength up here.
GH

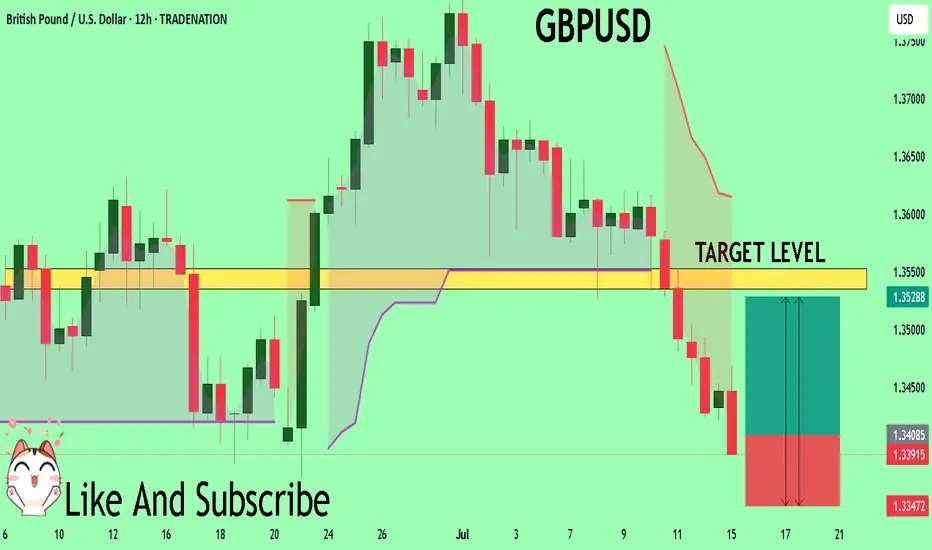
GBPUSD Will Explode! BUY!
My dear friends,
My technical analysis for GBPUSD is below:
The market is trading on 1.3409 pivot level.
Bias - Bullish
Technical Indicators: Both Super Trend & Pivot HL indicate a highly probable Bullish continuation.
Target - 1.3535
Recommended Stop Loss - 1.3347
About Used Indicators:
A pivot point is a technical analysis indicator, or calculations, used to determine the overall trend of the market over different time frames.
Disclosure: I am part of Trade Nation's Influencer program and receive a monthly fee for using their TradingView charts in my analysis.
———————————
WISH YOU ALL LUCK
GBP/USD still under pressure despite slightly weaker US core CPIThe US dollar, which had gained ground last week, was under a bit of pressure earlier today. And following a mixed inflation report, the greenback spiked before returning to pre-CPI levels. The inflation report hasn’t changed market’s perception about the likely path of interest rates.
US CPI comes in mixed
June’s CPI rose 0.3% MoM and 2.7% YoY—hotter than the prior 2.4% and above the 2.6% consensus. However, core CPI was a touch weaker, rising 0.2% m/m instead of 0.3%, while the y/y rate was 2.9% as expected.
The mixed CPI report means concerns that inflation may persist longer haven’t changed. The Fed may still delay or reduce the scope of any rate cuts, even if a September move is still on the table.
Adding to the dollar’s appeal, President Trump floated steep tariffs—35% on some Canadian goods and up to 30% on imports from Mexico and the EU—if deals aren’t reached by August 1. These protectionist signals and Trump’s expansive fiscal stance could further stoke inflation, supporting the greenback if confidence in US monetary policy holds.
Pound under pressure
Sterling has had a rough start to the week, extending last week’s 1% drop in GBP/USD before rebounding slightly earlier today. The pound's slide follows a run of soft UK economic data, boosting expectations for a Bank of England rate cut—likely in August. On Friday, data confirmed a second consecutive monthly contraction in the UK economy, driven by a worsening manufacturing slump. This has added to speculation that weakening growth and a stronger pound could help ease imported inflation, especially ahead of Wednesday’s UK CPI release.
Technical picture and key data ahead for GBP/USD
GBP/USD has broken below important support zones (1.3630 and 1.3530–1.3550), now turned resistance. It is currently testing the 1.3434 level, aligned with a key trendline. A breakdown here could open the door to deeper losses toward 1.3370 and potentially the low 1.30s.
Two major data points will guide the pair this week:
• UK CPI (July 16): A soft print would likely reinforce rate cut bets.
• US Retail Sales (July 17): After a May decline, a rebound could highlight US resilience and strengthen the dollar further.
By Fawad Razaqzada, market analyst with FOREX.com
LONG ON GBP/USDGU is currently in its pullback phase of its uptrend.
We have a nice sell side Liquidity sweep being completed at this moment.
Price should now tap into previous demand that broke a high to repeat history and rise again.
Very Nice Setup over 300 pips on the table to the previous high/supply zone.

Pound under pressure ahead of US, UK inflation reportsThe British pound has edged up higher on Tuesday. In the European session, GBP/USD is trading at 1.3453, up 0.21% on the day. Earlier, GBP/USD touched a low of 1.3416, its lowest level since June 23.
All eyes will be on the UK inflation report for June, which will be released on Wednesday. Headline CPI is expected to remain unchanged at 3.4% y/y, as is core CPI at 3.5%. Monthly, both the headline rates are expected to stay steady at 0.2%.
Has the BoE's battle to lower inflation stalled? The BoE was looking good in March, when inflation eased to 2.6%, but CPI has rebounded to 3.4%, well above the BoE's inflation target of 2%. Services data has been especially sticky, although it dropped to 4.7% in May, down from 5.4% a month earlier.
At 3.4%, inflation is stuck at its highest level since February 2024 and that will complicate plans at the BoE to renew interest rate cuts in order to kick-start the weak UK economy. The central bank has lowered rates twice this year and would like to continue trimming the current cash rate of 4.25%. The Bank meets next on Aug. 7 and Wednesday's inflation data could be a significant factor in the rate decision.
In the US, if June inflation data rises as is expected, fingers will quickly point to President Trump's tariffs as finally having an impact. Recent inflation reports have not shown a significant spike higher due to the tariffs, which were first imposed in April. However, the tariffs may have needed time to filter throughout the economy and could be felt for the first time in the June inflation reading.
The Fed meets next on July 30, with the markets pricing in a 95% chance of a hold, according to CME's FedWatch. For September, the odds of a rate cut stand at 59%. Today's inflation report could cause a shift in these numbers.
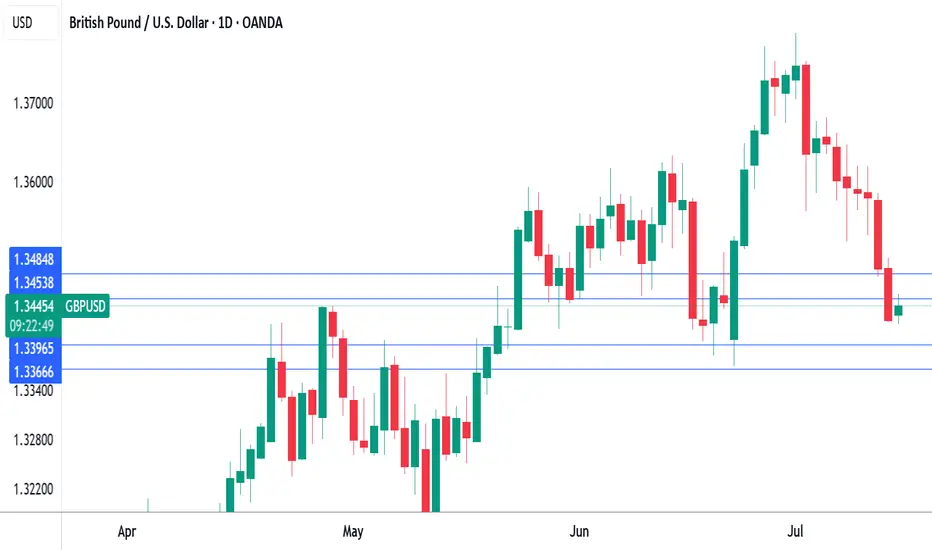
GBP/USD tested resistance at 1.3454 earlier. Above, there is resistance at 1.3484
1.3396 and 1.3366 are the next support levels
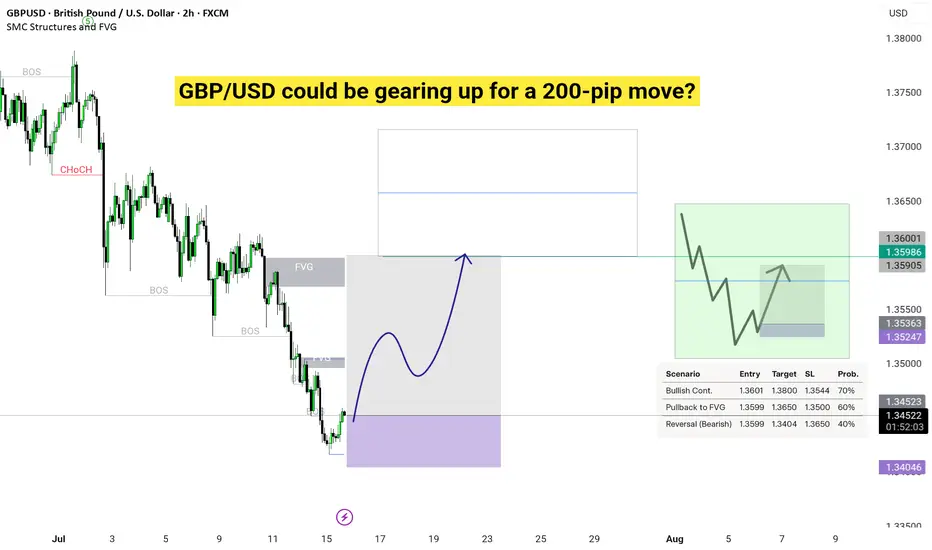
GBP/USD could be gearing up for a 200-pip move?Start: We jump in at 1.3601 if it’s going up or filling the gap, or 1.3599 if it might drop.
Goal: We aim for 1.3800 if it goes up, or 1.3404 if it goes down.
Safety Stop: Like a safety net, we stop if it drops to 1.3544 (up plan) or rises to 1.3650 (down plan).
Chance: These are best guesses based on the chart’s clues!
DeGRAM | GBPUSD broke down the channel📊 Technical Analysis
● Cable’s bounce stalled at the channel base (≈1.3500); price is now carving a bear flag beneath that rail and the prior wedge-break line, signalling failure to regain trend support.
● A 4 h close under 1.3415 confirms channel loss, opening the mid-May pivot 1.3271; flag top at 1.3470 caps risk while lower-high sequence stays intact.
💡 Fundamental Analysis
● Friday’s firm US consumer-sentiment and Fed Gov. Waller’s “no urgency to cut” comments nudged 2-yr yields back toward 4.80 %, reviving dollar demand.
● UK June payrolls contracted for a third month and wage growth cooled, boosting August BoE-cut odds and weighing on sterling.
✨ Summary
Sell 1.3460-1.3490; sustained trade below 1.3415 targets 1.3271. Short view void on a 4 h close above 1.3470.
-------------------
Share your opinion in the comments and support the idea with a like. Thanks for your support!

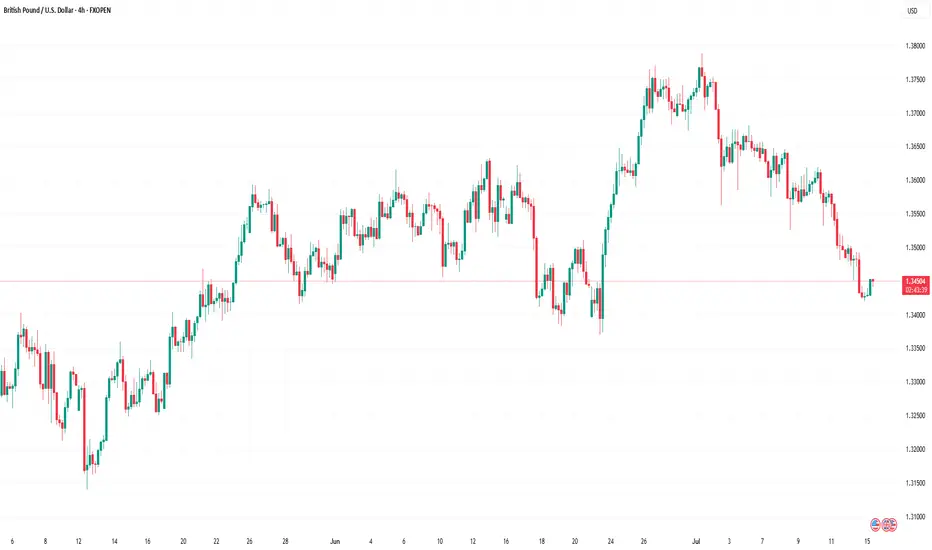
GBP/USD Rate Falls to Key Support LevelGBP/USD Rate Falls to Key Support Level
As of today, the GBP/USD chart indicates that the British pound has declined by more than 2% against the US dollar since the beginning of July. Notably, the pace of the decline accelerated on Friday and continued into Monday.
According to Reuters, the pound is under pressure due to market concerns over a potential economic slowdown amid an escalating trade war. Last week’s data confirmed a contraction in UK GDP, which could have far-reaching implications. In this context, criticism of the UK government’s failure to reduce public spending is becoming more pronounced.
What’s next for GBP/USD?
Technical Analysis of the GBP/USD Chart
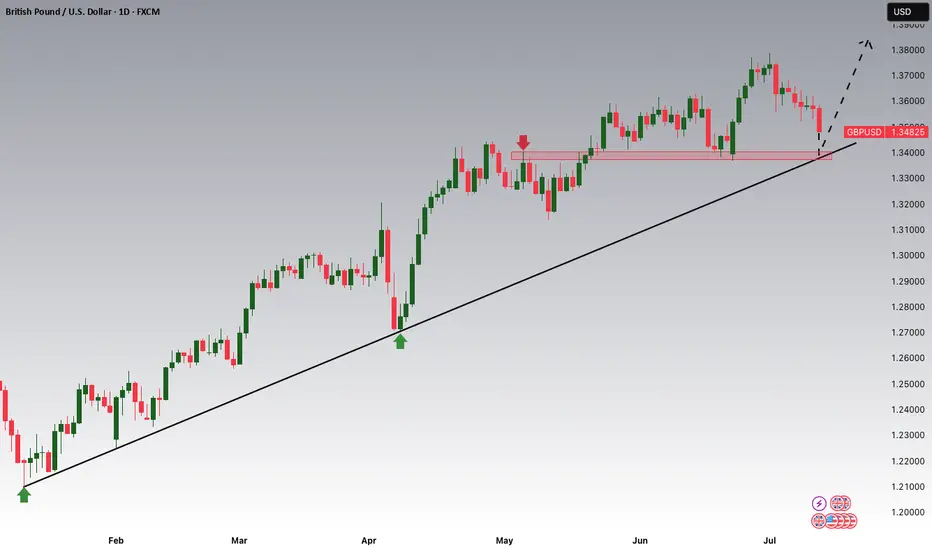
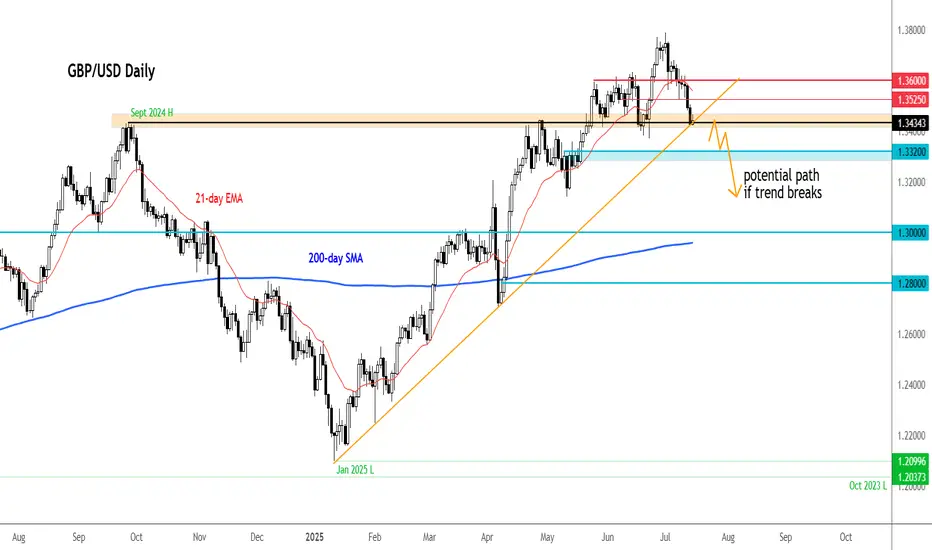
From a bullish perspective, it is worth noting that the pair has fallen to a significant support level around 1.3425. This level previously acted as resistance in the spring, but after a breakout, it has now turned into support (as indicated by arrows on the chart). Additionally, the RSI indicator shows strong oversold conditions, which suggests a potential short-term rebound.
From a bearish standpoint, it is concerning that the sharp rally from point A to point B has been entirely erased by the July decline. This indicates that despite significant gains by the bulls, they failed to hold them—casting doubt on GBP/USD's ability to sustain growth in the medium term.
Ongoing pressure may lead to an attempt by bears to push GBP/USD below the June low at point A. However, it is also possible that bearish momentum will weaken thereafter, potentially leading to a recovery within the developing downward channel (marked in red).
This article represents the opinion of the Companies operating under the FXOpen brand only. It is not to be construed as an offer, solicitation, or recommendation with respect to products and services provided by the Companies operating under the FXOpen brand, nor is it to be considered financial advice.
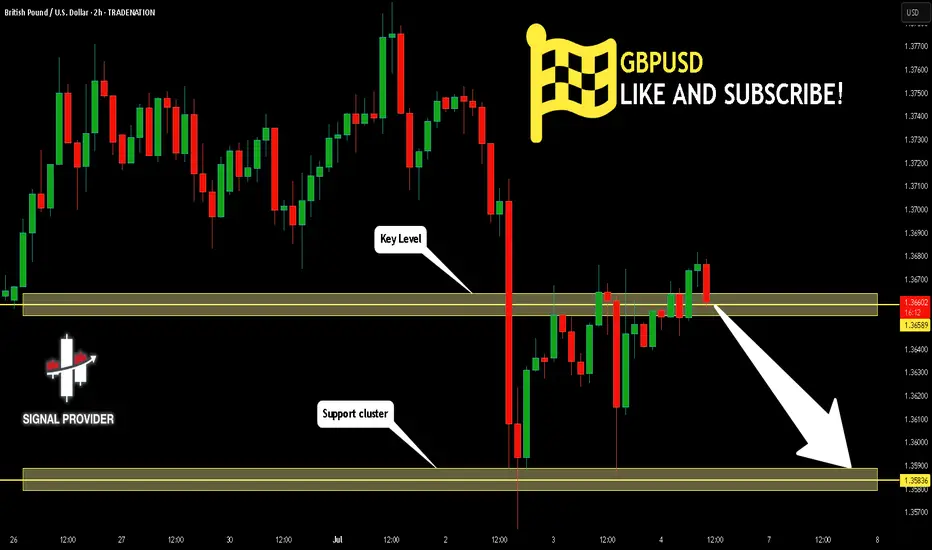
GBPUSD Will Go Lower! Sell!
Take a look at our analysis for GBPUSD.
Time Frame: 2h
Current Trend: Bearish
Sentiment: Overbought (based on 7-period RSI)
Forecast: Bearish
The market is testing a major horizontal structure 1.365.
Taking into consideration the structure & trend analysis, I believe that the market will reach 1.358 level soon.
P.S
Overbought describes a period of time where there has been a significant and consistent upward move in price over a period of time without much pullback.
Disclosure: I am part of Trade Nation's Influencer program and receive a monthly fee for using their TradingView charts in my analysis.
Like and subscribe and comment my ideas if you enjoy them!
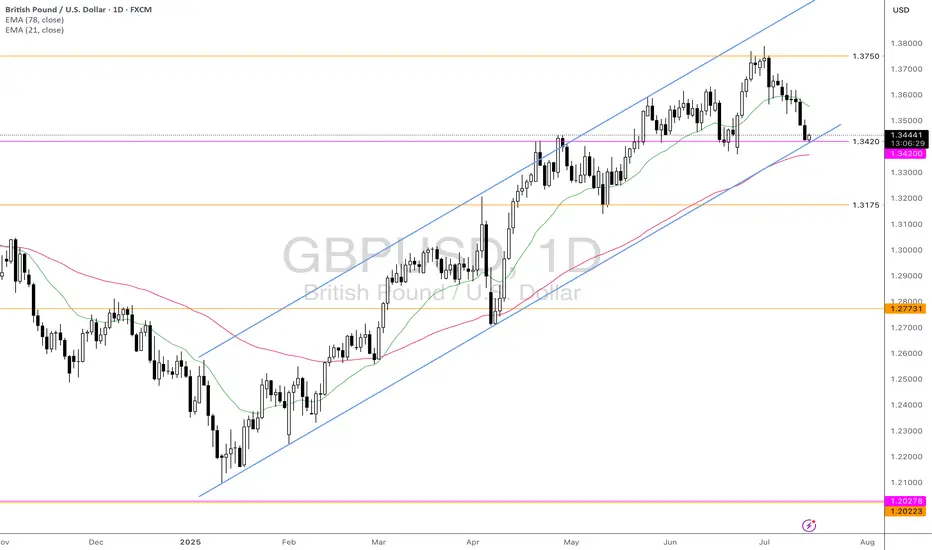
Will The Prospect of a BoE Rate Cut Continue to Dampen GBPUSD?Macro approach:
- GBPUSD has weakened since last week, pressured by disappointing UK economic data and rising expectations of a BoE rate cut. Meanwhile, the US dollar found support amid cautious risk sentiment and anticipation of key US inflation data.
- UK GDP contracted for a second consecutive month in May, and recent labor market surveys signaled further cooling, reinforcing the case for the BoE's monetary easing. Governor Bailey reiterated that the path for rates is "downward," with markets now pricing in a high probability of a cut at the Aug meeting.
- Meanwhile, the US dollar was buoyed by safe-haven flows and firm inflation expectations ahead of the US CPI release, highlighting policy divergence between the Fed and BoE.
- GBPUSD may remain under pressure as traders await UK inflation and employment data, which could influence the BoE's next move. The pair could see further volatility with US CPI and Fed commentary also on the radar as potential catalysts.
Technical approach:
- GBPUSD is retesting the ascending channel's lower bound, confluence with the key support at 1.3420. The price is between both EMAs, indicating a sideways movement. GBPUSD awaits an apparent breakout to determine the short-term trend.
- If GBPUSD breaches below the support at 1.3420, the price may plunge toward the following support at 1.3175.
- On the contrary, holding above 1.3420 may prompt a short correction to retest EMA21.
Analysis by: Dat Tong, Senior Financial Markets Strategist at Exness
GBPUSD LONG FORECAST Q3 D15 W29 Y25GBPUSD LONG FORECAST Q3 D15 W29 Y25
Welcome back to the watchlist GBPUSD ! Let's go long ! Alignment across all time frames.
Professional Risk Managers👋
Welcome back to another FRGNT chart update📈
Diving into some Forex setups using predominantly higher time frame order blocks alongside confirmation breaks of structure.
Let’s see what price action is telling us today!
💡Here are some trade confluences📝
✅Daily order block
✅1H Order block
✅Intraday breaks of structure
✅4H Order block
📈 Risk Management Principles
🔑 Core Execution Rules
Max 1% risk per trade
Set alerts — let price come to your levels
Minimum 1:2 RR
Focus on process, not outcomes
🧠 Remember, the strategy works — you just need to let it play out.
🧠 FRGNT Insight of the Day
"The market rewards structure and patience — not emotion or urgency."
Execute like a robot. Manage risk like a pro. Let the chart do the talking.
🏁 Final Words from FRGNT
📌 GBPUSD is offering textbook alignment — structure, order flow, and confirmation all check out.
Let’s approach the trade with clarity, conviction, and risk-managed execution.
🔑 Remember, to participate in trading comes always with a degree of risk, therefore as professional risk managers it remains vital that we stick to our risk management plan as well as our trading strategies.
📈The rest, we leave to the balance of probabilities.
💡Fail to plan. Plan to fail.
🏆It has always been that simple.
❤️Good luck with your trading journey, I shall see you at the very top.
🎯Trade consistent, FRGNT X

Triangle Formation (Rising wedge STF) I believe we can see some downside here. Price has bounced of the 61.8 fib level and looks to have created a triangle pattern. I’m not currently in any positions, I will wait for a breakout of the rising wedge for a short position.
