High-Reward GBPUSD Setup: Entry 1.3598, TP 1.3867, SL 1.3478The GBP/USD pair has recently shown a clean bullish breakout from a short-term consolidation zone. Price has decisively moved above the 1.3478–1.3480 support-turned-resistance level, which previously acted as a ceiling within a rising channel. This breakout is meaningful—it comes after a retracement toward the lower boundary of the ascending structure, suggesting that buyers are once again gaining control.
The recent bullish candle has closed strong and full-bodied, indicating momentum. Historically, as you mentioned, GBPUSD tends to follow through for a few sessions once a bullish breakout begins. This is visible in prior moves throughout March and April, where an initial spike was often followed by two or three additional bullish candles. That behavior adds confluence to this setup.
Moreover, there is a clear path for price to move toward the long-term resistance near 1.3867, which aligns well with prior supply zones and the upper boundary of historical price reactions.
📈 Trade Idea
• Entry: 1.3598 (current price after breakout confirmation)
• Stop Loss: 1.3478 (just below the support flip and last swing low)
• Take Profit: 1.3867 (next major resistance level)
• Risk–Reward Ratio: ~2.24:1
This setup offers a clean bullish continuation pattern with room to run. If the pair maintains its current momentum, reaching the target in the next few trading days is entirely plausible. Any daily close above 1.3600 with volume would further validate the trend.
Gbpusdforecast

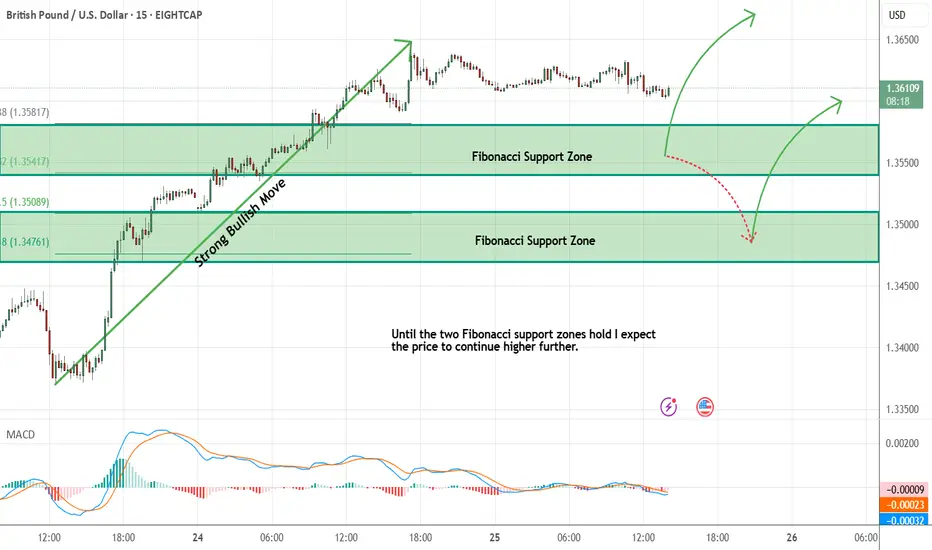
GBPUSD - Expecting Bullish Continuation In The Short TermM15 - Strong bullish momentum followed by a pullback.
No opposite signs.
Until the two Fibonacci support zones hold I expect the price to move higher further.
If you enjoy this idea, don’t forget to LIKE 👍, FOLLOW ✅, SHARE 🙌, and COMMENT ✍! Drop your thoughts and charts below to keep the discussion going. Your support helps keep this content free and reach more people! 🚀
--------------------------------------------------------------------------------------------------------------------
GBPUSD Analysis todayHello traders, this is a complete multiple timeframe analysis of this pair. We see could find significant trading opportunities as per analysis upon price action confirmation we may take this trade. Smash the like button if you find value in this analysis and drop a comment if you have any questions or let me know which pair to cover in my next analysis.

EURUSD, GBPUSD and AUDUSD Analysis todayHello traders, this is a complete multiple timeframe analysis of this pair. We see could find significant trading opportunities as per analysis upon price action confirmation we may take this trade. Smash the like button if you find value in this analysis and drop a comment if you have any questions or let me know which pair to cover in my next analysis.

Still keeping a close eye on a potential USD pop...Although the EUR/USD and GBP/USD popped higher late last week, I'm still keeping a close eye to stay short on the EUR/USD considering the bearish rising broadening pattern coupled with a yearly pivot point inter-median level and negative divergence on the MACD. This is all based on the daily chart.
Many factors are in play right now with what's going on between Israel and Iran along with FOMC this week and Tariffs still in play.
On a purely technical analysis point of view, I potentially expect a bullish retracement in the USD while remaining long term bearish across the board.
we'll see how this one develops.
Good Luck & Trade Safe.

GBPUSD ready to jump?GBPUSD after retest of the daily support has got a bounce back to the upside with a momentum as the price already has got rejected back, we may see potential trend continuation. We can spot the double bottom on the lower timeframe from this support and may continue to rise to the resistance. A bullish trade is high probable after confirmation of potential inverted head and shoulder

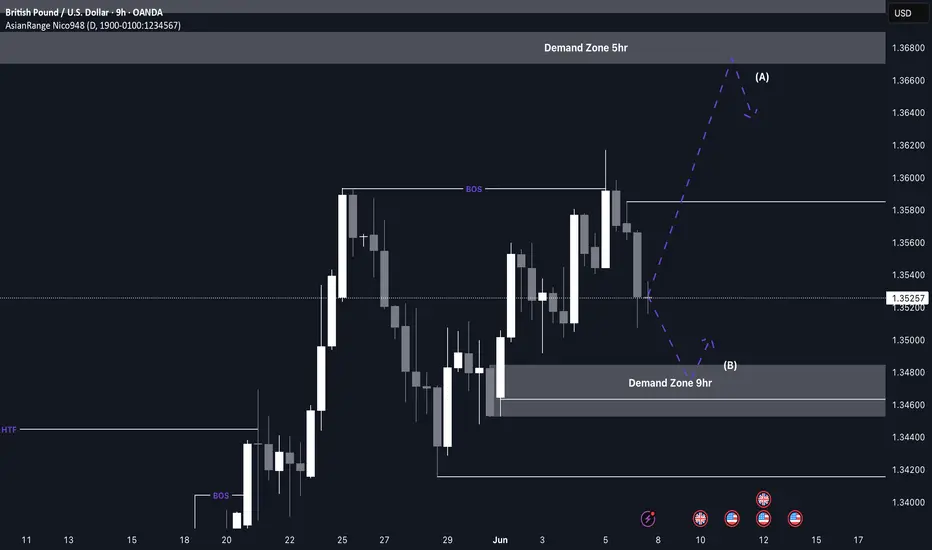
GBP/USD Buys from 1.34800 This week’s analysis focuses on capitalising on the strong bullish structure forming on GU. After a clear break of structure to the upside, price has been forming consistent higher highs and higher lows.
From this move, a key Point of Interest has been left around the 1.34800 level, which aligns with a clean 9H demand zone. As price now needs to retrace after the recent bullish push, this 9H zone becomes a likely area for accumulation and a potential continuation rally.
Confluences for GU Buys:
- GU has been very bullish overall on the higher timeframes
- The 9H demand zone caused the latest break of structure to the upside
- There’s plenty of liquidity and imbalance above that needs to be taken
- The DXY is moving bearish, supporting GU upside
P.S. If price pushes higher before retracing, it may enter a premium supply zone, where I’ll be watching for any significant reaction. Either way, patience is key — don’t hesitate to wait for your setup to fully form.
Wishing you a focused and profitable trading week!
EURUSD and GBPUSD Breakout?Hello traders, this is a complete multiple timeframe analysis of this pair. We see could find significant trading opportunities as per analysis upon price action confirmation we may take this trade. Smash the like button if you find value in this analysis and drop a comment if you have any questions or let me know which pair to cover in my next analysis.


GBPUSD Sell and Buy Trading PlanH4 - We have a clean bullish trend with the price creating a series of higher highs, higher lows structure
This strong bullish move ended with a bearish divergence
While measuring this strong bullish move using the Fibonacci retracement tool we have two key support zones that has formed (marked in green)
So based on this I expect short term bearish moves now towards the Fibonacci support zones and then continuation higher.
If you enjoy this idea, don’t forget to LIKE 👍, FOLLOW ✅, SHARE 🙌, and COMMENT ✍! Drop your thoughts and charts below to keep the discussion going. Your support helps keep this content free and reach more people! 🚀
--------------------------------------------------------------------------------------------------------------------
Disclosure: I am part of Trade Nation's Influencer program and receive a monthly fee for using their TradingView charts in my analysis.

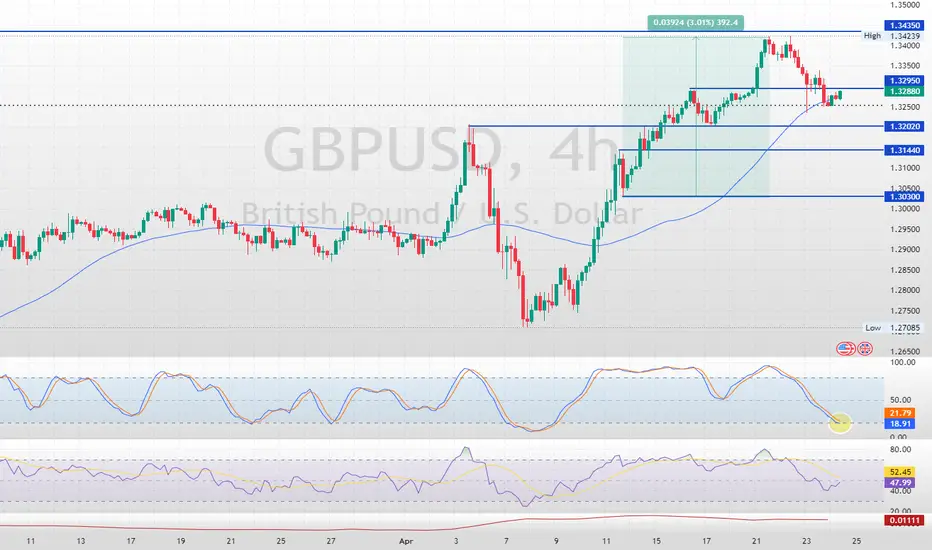
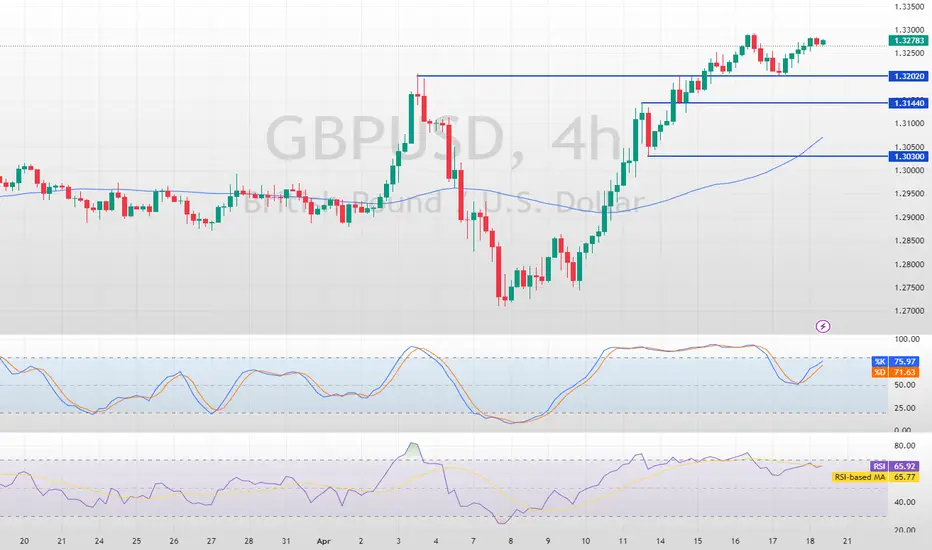
GBP/USD is Bullish: This Breakout Triggers the UptrendFenzoFx—GBP/USD fell from $1.3435, testing the 50-period simple moving average near $1.3276. The Stochastic Oscillator is nearing the 20 level, suggesting the US dollar is overbought in the short term.
Support lies at $1.3202. The outlook remains bullish while above this level, though a close above $1.3295 is needed to confirm upward momentum. A retest of $1.3435 could follow.
Bearish Scenario: A drop below $1.3202 would invalidate the bullish view, potentially extending the decline to $1.3144 or even $1.3030 under sustained selling pressure.

EURUSD and GBPUSD Analysis todayHello traders, this is a complete multiple timeframe analysis of this pair. We see could find significant trading opportunities as per analysis upon price action confirmation we may take this trade. Smash the like button if you find value in this analysis and drop a comment if you have any questions or let me know which pair to cover in my next analysis.

GBP/USD is Overbought at Critical Resistance LevelFenzoFx—GBP/USD climbed to $1.3435, a key resistance near the September 2024 high. While the trend remains bullish, overbought signals from Stochastic and RSI-14 suggest limited upside.
If the pair stays below $1.3435, it may retreat to 1.3295 or even 1.3202.
>>> No Deposit Bonus
>>> %100 Deposit Bonus
>>> Forex Analysis Contest
All at FenzoFx Decentralized Forex Broker

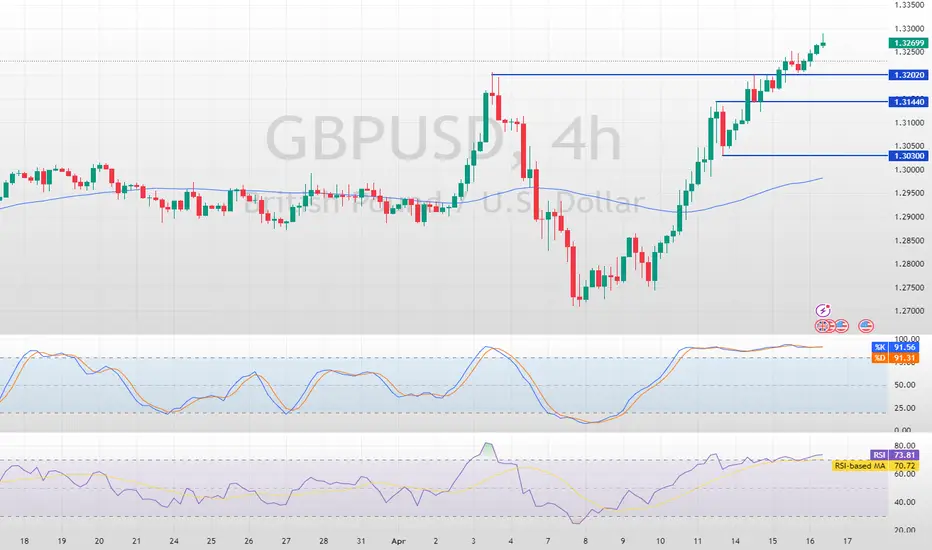
GBP/USD AnalysisFenzoFx—The GBP/USD pair rebounded from $1.3202 support, currently trading around $1.3277 and continuing its bullish trend.
As long as it stays above $1.3144, the next target could be $1.3435. On the flip side, a break below $1.3144 may trigger a bearish move towards $1.3030.
>>> No Deposit Bonus
>>> %100 Deposit Bonus
>>> Forex Analysis Contest
All at F enzo F x Decentralized Forex Broker
AUDUSD,GBPUSD and NZDUSDHello traders, this is a complete multiple timeframe analysis of this pair. We see could find significant trading opportunities as per analysis upon price action confirmation we may take this trade. Smash the like button if you find value in this analysis and drop a comment if you have any questions or let me know which pair to cover in my next analysis.

Market Analysis: GBP/USD Rockets HigherMarket Analysis: GBP/USD Rockets Higher
GBP/USD is gaining pace above the 1.3220 resistance.
Important Takeaways for GBP/USD Analysis Today
- The British Pound is attempting a fresh increase above 1.3220.
- There is a key bullish trend line forming with support near 1.3245 on the hourly chart of GBP/USD at FXOpen.
GBP/USD Technical Analysis
On the hourly chart of GBP/USD at FXOpen, the pair remained well-bid above the 1.2850 level. The British Pound started a decent increase above the 1.3000 zone against the US Dollar.
The bulls were able to push the pair above the 50-hour simple moving average and 1.3150. The pair even climbed above 1.3200 and traded as high as 1.3263. It is now consolidating gains and trading well above the 23.6% Fib retracement level of the upward move from the 1.3030 swing low to the 1.3263 high.
On the upside, the GBP/USD chart indicates that the pair is facing resistance near 1.3260. The next major resistance is near 1.3320. A close above the 1.3320 resistance zone could open the doors for a move toward 1.3450.
Any more gains might send GBP/USD toward 1.3500. On the downside, there is a key support forming near a bullish trend line at 1.3245.
If there is a downside break below 1.3245, the pair could accelerate lower. The next major support is at 1.3145. It is close to the 50% Fib retracement level of the upward move from the 1.3030 swing low to the 1.3263 high.
The next key support is seen near 1.3030, below which the pair could test 1.2860. Any more losses could lead the pair toward the 1.2745 support.
This article represents the opinion of the Companies operating under the FXOpen brand only. It is not to be construed as an offer, solicitation, or recommendation with respect to products and services provided by the Companies operating under the FXOpen brand, nor is it to be considered financial advice.

Inflation in the UK Has FallenInflation in the UK Has Fallen
According to Forex Factory, the Consumer Price Index (CPI) reading came in below expectations: while analysts had forecast a decline to 2.7% year-on-year from the previous 2.8%, the actual CPI figure was 2.6%.
Following the release of this news, the GBP/USD exchange rate rose to 1.3280 – the highest level in seven months.
On the one hand, falling inflation is a sign of a healthy economy and a relief for the Bank of England, especially considering that CPI stood in double digits just two years ago. As a result, analysts may now predict that interest rates could be cut at the meeting scheduled for 8 May.
On the other hand, demand for the dollar remains volatile due to Trump’s tariff policies, fears of a US recession, and a wave of bond sell-offs.
Technical Analysis of the GBP/USD Chart
In just one week, the pound-to-dollar rate has risen by approximately 4.2%, with the RSI indicator now hovering near extreme overbought levels. Furthermore, the price is approaching the upper boundary of the ascending channel, which has been in play since the beginning of 2025.
In such conditions, a correction (with a bearish breakout of the ascending trendline, shown in blue) appears a logical development. However, a key factor in sustaining the current trend of dollar weakness could be the speech by Federal Reserve Chair Jerome Powell, scheduled for today at 20:30 GMT+3.
This article represents the opinion of the Companies operating under the FXOpen brand only. It is not to be construed as an offer, solicitation, or recommendation with respect to products and services provided by the Companies operating under the FXOpen brand, nor is it to be considered financial advice.

GBP/USD Breaks $1.3202: Bullish Market InsightsFenzoFx—The GBP/USD currency pair shows strong bullish momentum, breaking above $1.3202 yesterday. With overbought signals from the Stochastic indicator, a consolidation phase may lead to declines toward $1.3144 and $1.3030.
Traders should watch for bullish candlestick patterns near these support levels.
>>> No Deposit Bonus
>>> %100 Deposit Bonus
>>> Forex Analysis Contest
All at F enzo F x Decentralized Forex Broker
GBPUSD potential buy zone in inverted head & shoulder!GDP in GBPUSD had spike in actual value with the forecast has boost in this pair. Prior to data release this instrument had a break of structure has given strong liquidity grab as it has broken from long term trend line. As the market structure remain intact we may see the price to bounce back to the daily resistance line. 15m timeframe already has formed an inverted head & shoulder which signaling potential breakout. Any liquidity grab may give us potential entry in this lower timeframe.

GBPUSD - Looking To Sell Pullbacks In The Short TermH1 - Strong bearish momentum
No opposite signs
Expecting bearish continuation until the two Fibonacci resistance zones hold
If you enjoy this idea, don’t forget to LIKE 👍, FOLLOW ✅, SHARE 🙌, and COMMENT ✍! Drop your thoughts and charts below to keep the discussion going. Your support helps keep this content free and reach more people! 🚀
--------------------------------------------------------------------------------------------------------------------
Disclosure: I am part of Trade Nation's Influencer program and receive a monthly fee for using their TradingView charts in my analysis.

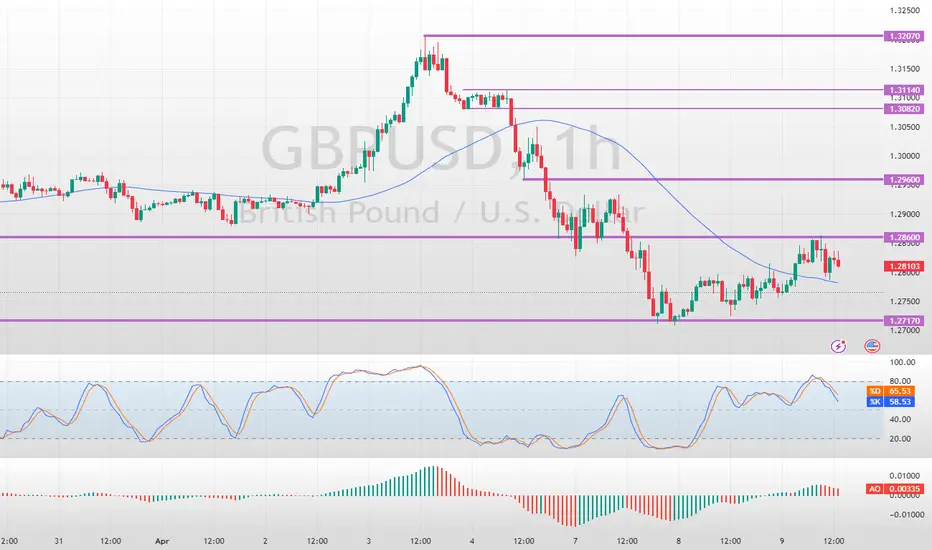
GBPUSD Made New Higher Highs amid Sell-offFenzoFx—GBP/USD trades bearish but is forming new higher highs with immediate resistance at $1.286. The next bullish target could be $1.2960 if bulls close and stabilize above this level.
Conversely, the bullish outlook should be invalidated if GBP/USD falls below $1.2717. If this scenario unfolds, the pound could fall toward the next support level at $1.2563.
USD Bear is here: Important Analysis on FX Pairs, Stock MarketIn this video I got over some important outlooks on the EUR/USD, GBP/USD and USD/JPY along with outlook on the stock market.
The U.S. Dollar has been getting absolutely crushed along with the stock market which usually has the opposite effect. Considering we may be into a stagflation scenario, this is not surprising.
Tariffs have spiked volatility and puts the Federal Reserve in a very tight spot of Interest Rate Policy. Interesting times ahead to say the least.
From a pure technical analysis point of view, the USD may be set for much further losses as monthly patterns suggest a big move may be on the horizon. Will be keeping a very close eye on these as we move forward in these stormy waters of the U.S. economy.
As always, Good Luck & Trade Safe.
