$GU (GBPUSD) 4HGBPUSD is forming a potential reversal structure with liquidity resting above and below the current range.
We expect a move to grab short-term liquidity above 1.3475 followed by a sweep of lows near 1.3369.
This would complete a rounded bottom structure, setting the stage for a bullish reversal.
Once the low is swept and buyers step in, the target sits around the 1.3600 handle.
Gbpusdlong


GBPUSD reversal to the upsideGBPUSD has been in a downtrend for about a week. Yesterday showed bullish momentum but the price was pushed back to near yesterday's low. Price couldn't break it. We could see a strong reversal in the coming days/start of next week. I think today's daily candle will be bullish with a long wick to the downside showing bullish momentum. I will take a 3:1 trade following that analysis.
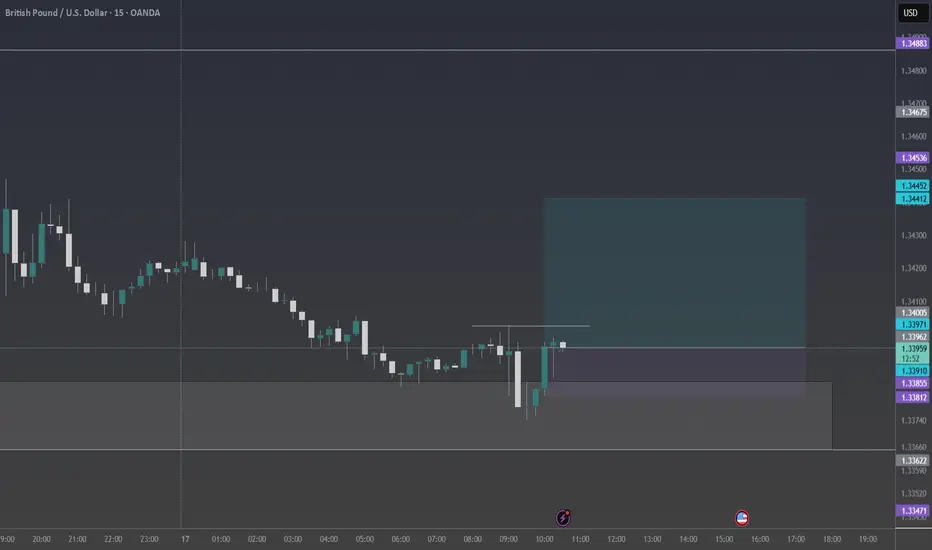
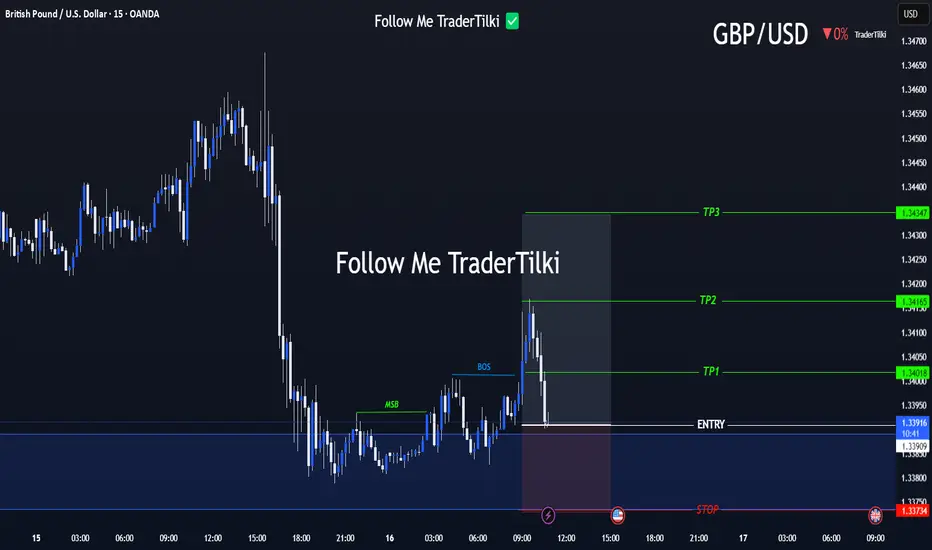
Strategic Entry, Clear Targets: The GBPUSD Game Plan Is Set📢 Hello Guys,
I've prepared a fresh GBPUSD signal for you:
🟢 Entry Level: 1.33918
🔴 Stop Loss: 1.33734
🎯 TP1: 1.34018
🎯 TP2: 1.34165
🎯 TP3: 1.34347
📈 Risk/Reward Ratio: 2,40
------
Your likes and support are what keep me motivated to share these analyses consistently.
Huge thanks to everyone who shows love and appreciation! 🙏
GBPUSD – Levels, Adjustments, and Scenario PlanningAs mentioned in our pinned analysis, we had two levels on GBPUSD —
✅ Both of them were broken.
📉 After the break of the first level, we shorted the pullback and took a great profit.
📍 Now after the second level has also broken, I’ve adjusted the level slightly —
There’s a chance price retraces to 1.35774 before continuing its drop.
🟢 Below, there’s a solid buy zone.
🔁 My Updated Scenarios:
✅ If price pulls back to the short level before hitting the buy zone → I’ll take the short.
⚠️ But if price touches the buy zone first, then any short afterward will just be partial or used for pyramiding — not a major trade.
Let’s stay patient and let the market tell us what to do.
📌 All previous scenarios are still valid.

LONG ON GBP/USDGU is currently in its pullback phase of its uptrend.
We have a nice sell side Liquidity sweep being completed at this moment.
Price should now tap into previous demand that broke a high to repeat history and rise again.
Very Nice Setup over 300 pips on the table to the previous high/supply zone.

GBPUSD: Two Strong Bullish Area To Buy From ?GU is currently in a bullish trend when examined on a daily time frame. There are two potential areas for purchase. The first area is currently active, as we anticipate a price reversal from this point. There is a significant possibility that price could decline to the second area and subsequently reverse from there directly. The sole reason we believe price could drop to the second area is if the US Dollar experiences corrections, which could cause GU to drop to our second area and subsequently rebound.
If you appreciate our analysis, we kindly request that you consider the following actions:
-Liking the Ideas
-Commenting on the Ideas
-Sharing the Ideas
We extend our sincere gratitude for your continuous support. We trust that our insights have provided even a modicum of assistance.
Team Setupsfx_
❤️🚀

GBPUSD LONG FORECAST Q3 D14 W29 Y25GBPUSD LONG FORECAST Q3 D14 W29 Y25
Welcome back to the watchlist GBPUSD ! Let's go long ! Alignment across all time frames.
Professional Risk Managers👋
Welcome back to another FRGNT chart update📈
Diving into some Forex setups using predominantly higher time frame order blocks alongside confirmation breaks of structure.
Let’s see what price action is telling us today!
💡Here are some trade confluences📝
✅Daily order block
✅1H Order block
✅Intraday breaks of structure
✅4H Order block
📈 Risk Management Principles
🔑 Core Execution Rules
Max 1% risk per trade
Set alerts — let price come to your levels
Minimum 1:2 RR
Focus on process, not outcomes
🧠 Remember, the strategy works — you just need to let it play out.
🧠 FRGNT Insight of the Day
"The market rewards structure and patience — not emotion or urgency."
Execute like a robot. Manage risk like a pro. Let the chart do the talking.
🏁 Final Words from FRGNT
📌 GBPUSD is offering textbook alignment — structure, order flow, and confirmation all check out.
Let’s approach the trade with clarity, conviction, and risk-managed execution.
🔑 Remember, to participate in trading comes always with a degree of risk, therefore as professional risk managers it remains vital that we stick to our risk management plan as well as our trading strategies.
📈The rest, we leave to the balance of probabilities.
💡Fail to plan. Plan to fail.
🏆It has always been that simple.
❤️Good luck with your trading journey, I shall see you at the very top.
🎯Trade consistent, FRGNT X

GBPUSD Long From Rising Support !
HI,Traders !
#GBPUSD is trading along
The rising support line
And the pair will soon hit
A trend-line from where we
Will be expecting a local
Bullish rebound and a
Further bullish move up !
Comment and subscribe to help us grow !

GBPUSD - at ultimate region? Pound long??#GBPUSD... market reached at his ultimate region that is around 1.3450 to 1.3480
Keep close and don't hold shorts until holds.
Good luck
Trade wisely

GBPUSD📌 GBPUSD – Scenario-Based Plan
The first level I’ve marked is a short-term zone.
If we get a strong buy signal there with good R/R, I’ll enter and trail aggressively.
The second level is a stronger demand zone and a better area for potential long setups.
❗️Remember: These are just scenarios — not predictions.
We stay ready for whatever the market delivers.

Gbpusd long scalp I like current consolidations near equal high depicted with green line.
I want to see a draw towards the equal highs.
This would be simulation trade #7 out of 100

Intraday Drop into Support Zone — Can GBP/USD Bounce?Hi everyone,
GBP/USD continues to consolidate below the 1.36850 level. Price failed to break above and moved lower into the 1.35300–1.34600 zone, providing us with a clean intraday trade setup.
A drop into this area was highlighted as the more probable short‑term path, and we’re now looking for GBP/USD to find support in this region; and more importantly, to hold above the 1.33800 level to form the base for another push higher.
As previously noted, a decisive break above 1.37500 would renew our expectation for further upside, with the next key target around 1.38400. We'll be monitoring price action closely to see how it unfolds.
We’ll continue to provide updates on the projected path for GBP/USD as price approaches this target.
The longer-term outlook remains bullish, and we expect the rally to continue extending further from the 1.20991 January low towards 1.40000 and 1.417000.
We’ll be keeping you updated throughout the week with how we’re managing our active ideas. Thanks again for all the likes/boosts, comments and follows — we appreciate the support!
All the best for the week ahead. Trade safe.
BluetonaFX

Gbpusd long scalpWaiting confirmation with close above 1.35565, entry will at retest of that level for trade #7.
So far 6 out of 100 trades.
5 losses 1 win.

Gbpusd long scalp Same idea as previous post, I want to see a close above 1.35832 and a return into that level would be my entry. 3 targets as depicted.

#GBPUSD: A strong bullish move incoming, comment your views The price has shown a possible price divergence, which could lead to a long-term move to 1.37. We expect the US dollar to weaken, which will likely push the price of GBPUSD to our target. Key economic data will be released later today and tomorrow, which could shape the price pattern.
Good luck and trade safely!
Team Setupsfx_

GBPUSD UPDATE (NICE CHART)Hello friends
Given the failure of the pain and the strong growth of the price, you can see that the price is in correction, which is a good opportunity for safe purchases at the indicated support points, of course with capital and risk management...
*Trade safely with us*

Gbpusd long idea after reversalUpdate of previous call after we broke structure.
I see this one attacking buyside liquidity at equal highs formed on Tuesday.
Possible market maker buy model playing out here.

#GBPUSD: Detailed View Of Next Possible Price Move! GBPUSD exhibited a favourable movement after rejecting a pivotal level previously identified. We anticipate a smooth upward trajectory, potentially reaching approximately 1.45. Conversely, the US Dollar is on the brink of collapse around 90, which will directly propel the price into our take-profit range.
During GBPUSD trading, it is imperative to adhere to precise risk management principles. Significant news is scheduled to be released later this week.
We kindly request your support by liking, commenting, and sharing this idea.
Team Setupsfx_

GBPUSD: Targeting 1.4200 Swing Move Target! Swing Trading GBPUSD: We’ve identified a key reversal zone where our long-term take-profit target is set at 1.4200. This is a long-term approach, but in the short term, we could target 1.3900, which is a reasonable take-profit area. Before taking any buying entry, please do your own analysis.
Good luck and trade safely!
Like
Comment
Share
Team Setupsfx_

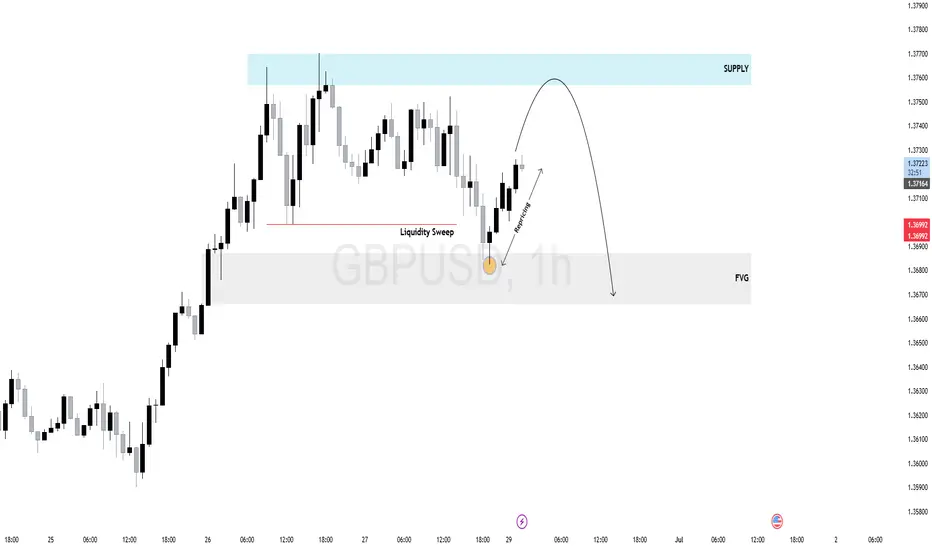
$GU (GBPUSD) 1H AnalysisPrice swept internal liquidity before dropping into a clear 1H Fair Value Gap (FVG), which acted as a draw on liquidity. Following the mitigation, GBPUSD is now retracing toward a high-probability supply zone.
Expect potential rejection as price rebalances inefficiency and seeks sell-side liquidity.
Watch for bearish confirmation inside the supply zone — ideal for intraday shorts if the structure shifts.
Pullbacks = short opportunities.
GBPUSD ANALYSIS After seeing that the previous candle closed really bullish on the week we could expect that momentum to continue since the daily and the 4hr structure are not showing any signs of reversal

GBP/USD Robbery: Can You Grab the Cash Before the Cops Arrive?🚨 GBP/USD "The Cable" forex bank Heist Alert: The Bullish Breakout Robbery Plan (Swing & Scalp Strategy) 🚨
🌟 Hi! Hola! Ola! Bonjour! Hallo! Marhaba! 🌟
Attention Money Makers & Market Robbers! 🤑💰💸
Based on the 🔥Thief Trading Style🔥, here’s our master plan to loot the GBP/USD "The Cable" forex bank. Follow the strategy on the chart—focusing on LONG entries—and escape near the high-risk Red Zone. This area is overbought, consolidating, and a potential reversal trap where bears lurk. 🏆 Take profits fast—you’ve earned it! 💪
🎯 Heist Entries:
📈 Entry 1: "The Breakout Heist!" – Wait for Resistance (1.36200) to break, then strike! Bullish profits await.
📈 Entry 2: "Big Players’ Pullback!" – Jump in at 1.34000+ buy above at any price for a safer steal.
🔔 Pro Tip: Set a chart alert to catch the breakout instantly!
🛑 Stop Loss Rules:
*"Yo, listen! 🗣️ If you’re entering with a buy-stop, DON’T set your SL until AFTER the breakout. Place it at the nearest swing low (3H timeframe) or wherever your risk allows—but remember, rebels risk more! 🔥"*
🏴☠️ Target: 1.37500
🧲 Scalpers: Only play LONG! Use trailing SL to lock in profits. Big wallets? Go all in. Small stacks? Join the swing heist!
📊 Market Pulse:
The GBP/USD "The Cable" is neutral but primed for bullish momentum. Watch:
Fundamentals (COT, Macro, Geopolitics)
Sentiment & Intermarket Trends
Positioning & Future Targets & Overall score
📌 Check our bioo linkks for deep analysis! 🔗🌍
⚠️ Trading Alert:
News = Volatility! Protect your loot:
Avoid new trades during major news
Use trailing stops to secure profits
💥 Boost This Heist!
Hit 👍 & 🔄 to strengthen our robbery crew! Let’s dominate the market daily with the Thief Trading Style. 🚀💵
Stay tuned—another heist drops soon! 🎯🐱👤
