SELL GBPUSD - great trade opportunityGBPUSD has been in a clear downtrend in the last few weeks and is very likely to keep heading to the downside. GBPUSD has recently broken a very powerful support level and then retraced back towards it, the price also struggled to break through resistance and only managed to break through support levels. The price is very likely to keep dropping and drop all the way to the next support level (shown as the take profit level on the chart) - SELL!!
Gbpusdlong

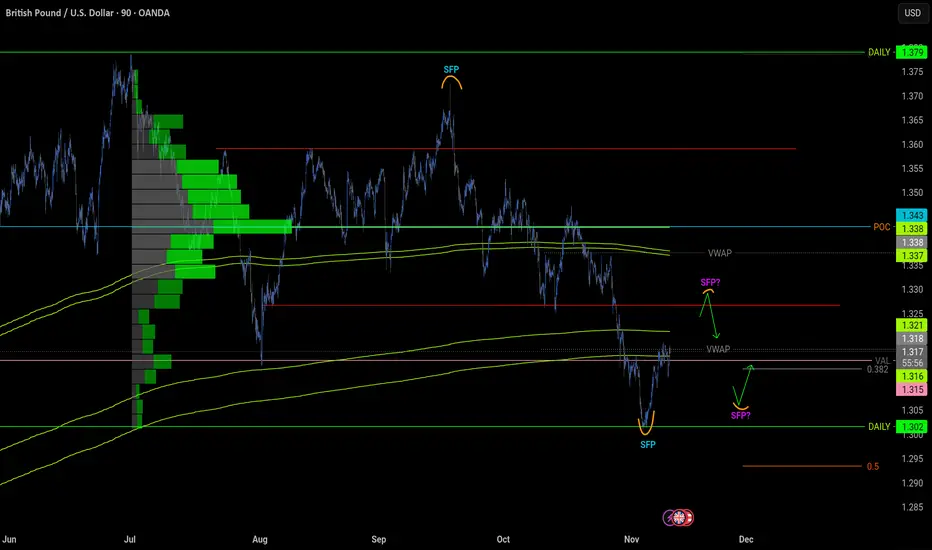
GBPUSD idea 11.11.2025On this chart I am currently looking for a short from around 1.32 where the price could react. I would first take a long around 1.307 where the SFP could be below the local bottom, but I don't know if it will hold and we don't look at another level below.
GBPUSD FRGNT Daily Forecast - Q4 | W47| D21 | Y25 |📅 Q4 | W47| D21 | Y25 |
📊 GBPUSD FRGNT Daily Forecast
🔍 Analysis Approach:
I’m applying Smart Money Concepts, focusing on:
Identifying Points of Interest on the Higher Time Frames (HTFs) 🕰️
Using those POIs to define a clear trading range 📐
Refining those zones on Lower Time Frames (LTFs) 🔎
Waiting for a Break of Structure (BoS) for confirmation ✅
This method allows me to stay precise, disciplined, and aligned with the market narrative, rather than chasing price.
💡 My Motto:
"Capital management, discipline, and consistency in your trading edge."
A positive risk-to-reward ratio, paired with a high win rate, is the backbone of any solid trading plan 📈🔐
⚠️ Losses?
They’re part of the mathematical game of trading 🎲
They don’t define you — they’re necessary, they happen, and we move forward 📊➡️
🙏 I appreciate you taking the time to review my Daily Forecast.
Stay sharp, stay consistent, and protect your capital
— FRNGT 🚀
FX:GBPUSD

SELL GBPUSD - great profitable trade opportunityGBPUSD has been in a clear downtrend in the last few weeks and is very likely to keep heading to the downside. GBPUSD has recently broken a very powerful support level and then retraced back towards it, the price also struggled to break through resistance and only managed to break through support levels. The price is likely to keep dropping and drop all the way to the next support level (shown as the take profit level on the chart) - SELL!!

GBP/USD Price Outlook – Trade Setup📊 Technical Structure
FPMARKETS:GBPUSD GBP/USD has bounced from the Support Zone at 1.3061–1.3029, after a sharp four-day decline. Price is now consolidating just above support around 1.3060, with the next Resistance Zone seen near 1.3147–1.3174.
As long as 1.3030 holds, the structure favours a corrective rebound back into the previous consolidation band. A decisive break above 1.3120 would open the way toward 1.3170+. Conversely, a clean close below 1.3030 would invalidate the bullish setup and expose the 1.2980–1.3000 region.
🎯 Trade Setup
Idea: Buy near support for a rebound toward the resistance zone.
Entry: 1.3039 – 1.3061
Stop Loss: 1.3032
Take Profit 1: 1.3147
Take Profit 2: 1.3174
Risk–Reward Ratio: ≈ 1 : 2.6
Bias remains cautiously bullish while price holds above 1.3030.
🌐 Macro Background
Cable is trading with mild gains around 1.3060, snapping a four-day losing streak as markets turn cautious ahead of the delayed US September NFP release.
FXStreet’s Lallalit Srijandorn notes that markets now see a BoE December rate cut as likely, after UK CPI slowed to 3.6% YoY in October, reinforcing expectations of policy easing and limiting medium-term upside for GBP. At the same time, the coming UK budget on 26 November could further shape BoE expectations.
On the US side, the labour-market picture remains blurred by the 43-day government shutdown, which delayed key economic data. Economists expect around 50k new jobs in September and unemployment at 4.3%. A weaker-than-expected NFP print could weigh on the USD and support GBP/USD, while a strong report would reinforce the Fed’s cautious stance and potentially cap the pair’s recovery.
FOMC minutes showed “strongly differing views” on the December decision: while most officials still support cuts in principle, many are open to keeping rates steady for the rest of the year, leaving the policy path highly data-dependent.
Overall, GBP faces headwinds from BoE cut pricing, but short-term, a softer USD on weak NFP could allow a technical rebound toward 1.3150–1.3170.
🔑 Key Technical Levels
Resistance: 1.3147 – 1.3174
Support: 1.3039 – 1.3061
Psychological Levels: 1.3000, 1.3100
📌 Trade Summary
GBP/USD is attempting to base above 1.3039 support after an extended selloff. The setup favours buying dips toward support, targeting a corrective move into the 1.3147–1.3174 resistance band, especially if the US NFP report disappoints and pressures the USD. A daily close below 1.3030 would negate this view and argue for a deeper slide toward 1.2980.
⚠️ Disclaimer
This analysis is for reference only and does not constitute trading advice. Trading involves significant risk, and proper risk management is essential.

GBPUSD FRGNT Daily Forecast -Q4 | W47| D20 | Y25 |📅 Q4 | W47| D20 | Y25 |
📊 GBPUSD FRGNT Daily Forecast
🔍 Analysis Approach:
I’m applying Smart Money Concepts, focusing on:
Identifying Points of Interest on the Higher Time Frames (HTFs) 🕰️
Using those POIs to define a clear trading range 📐
Refining those zones on Lower Time Frames (LTFs) 🔎
Waiting for a Break of Structure (BoS) for confirmation ✅
This method allows me to stay precise, disciplined, and aligned with the market narrative, rather than chasing price.
💡 My Motto:
"Capital management, discipline, and consistency in your trading edge."
A positive risk-to-reward ratio, paired with a high win rate, is the backbone of any solid trading plan 📈🔐
⚠️ Losses?
They’re part of the mathematical game of trading 🎲
They don’t define you — they’re necessary, they happen, and we move forward 📊➡️
🙏 I appreciate you taking the time to review my Daily Forecast.
Stay sharp, stay consistent, and protect your capital
— FRNGT 🚀
FX:GBPUSD

GBPUSD Monthly Chart Check GBPUSD Market Direction
Rebound from Strong Support the way to complete Long

BUY GBPUSD (head and shoulders pattern formed)A head and shoulder pattern was recently formed on the GBPUSD paid indicating it is time for a major reversal to the upside. The price also broke through all the last resistance levels and has nowhere else to go to except the next resistance zone which is marked as the next take profit level. We will be buying GBPUSD NOW!

The uptrend is confirmedAfter a recent upward move, there’s been a minor pullback, but the uptrend is confirmed.
Buy 1.31450 - 1.31500
TP 1.31900 - 1.32400 - 1.32800
Accurate signals updated daily. They serve as a reliable guide for trading issues – feel free to refer to them. Hope they help!

GBPUSD FRGNT Daily Forecast -Q4 | W47| D19 | Y25 |📅 Q4 | W47| D19 | Y25 |
📊 GBPUSD FRGNT Daily Forecast
🔍 Analysis Approach:
I’m applying Smart Money Concepts, focusing on:
Identifying Points of Interest on the Higher Time Frames (HTFs) 🕰️
Using those POIs to define a clear trading range 📐
Refining those zones on Lower Time Frames (LTFs) 🔎
Waiting for a Break of Structure (BoS) for confirmation ✅
This method allows me to stay precise, disciplined, and aligned with the market narrative, rather than chasing price.
💡 My Motto:
"Capital management, discipline, and consistency in your trading edge."
A positive risk-to-reward ratio, paired with a high win rate, is the backbone of any solid trading plan 📈🔐
⚠️ Losses?
They’re part of the mathematical game of trading 🎲
They don’t define you — they’re necessary, they happen, and we move forward 📊➡️
🙏 I appreciate you taking the time to review my Daily Forecast.
Stay sharp, stay consistent, and protect your capital
— FRNGT 🚀
FX:GBPUSD

GBPUSD Buy Strategy: From Safe Zone to the TopGuys,
I have prepared a GBPUSD analysis for you.
📌 When GBPUSD reaches the 1.31642 - 1.31495 zone, I will open a buy position, aiming for the 1.37937 level as my target.
My friends, I share these analyses thanks to each like I receive from you. I sincerely thank all of you who support me with your appreciation.

GBPUSD NEXT MOVE📉 Overall Market Structure (1H GBP/USD)
1. Downtrend Dominance
The chart shows a clear long-term downtrend starting from early September through October and into November.
Price has consistently been making:
Lower highs
Lower lows
This is classic bearish structure.
🔄 Recent Price Action (Mid–November)
Recently, price has pulled back upward after making a local low around 1.29xx.
Now price is trading around 1.3147, consolidating sideways after the pullback.
This behaviour often indicates:
A retracement inside a downtrend, or
A potential accumulation zone before a reversal (less likely unless major fundamentals support it).
⚠️ Key Levels (from your chart)
Resistance:
1.34747 (marked on your chart): A major resistance from early October.
1.3200–1.3250 zone: Minor resistance inside the pullback area.
Support:
1.31000 – Current support where recent consolidation is forming.
1.30000 – Psychological support below.
📈 What It May Suggest (NOT financial advice)
Given the current structure:
✔️ Bearish bias still strong unless price breaks above 1.3200–1.3250 with strength.
✔️ Current sideways movement may be:
A correction before another drop, or
A build-up before retesting resistance.
The overall trend still suggests sellers are in control.
For More Updates Stay Tuned

GBPUSD FRGNT Daily Forecast - Q4 | W47| D17 | Y25 |📅 Q4 | W47| D17 | Y25 |
📊 GBPUSD FRGNT Daily Forecast
🔍 Analysis Approach:
I’m applying Smart Money Concepts, focusing on:
Identifying Points of Interest on the Higher Time Frames (HTFs) 🕰️
Using those POIs to define a clear trading range 📐
Refining those zones on Lower Time Frames (LTFs) 🔎
Waiting for a Break of Structure (BoS) for confirmation ✅
This method allows me to stay precise, disciplined, and aligned with the market narrative, rather than chasing price.
💡 My Motto:
"Capital management, discipline, and consistency in your trading edge."
A positive risk-to-reward ratio, paired with a high win rate, is the backbone of any solid trading plan 📈🔐
⚠️ Losses?
They’re part of the mathematical game of trading 🎲
They don’t define you — they’re necessary, they happen, and we move forward 📊➡️
🙏 I appreciate you taking the time to review my Daily Forecast.
Stay sharp, stay consistent, and protect your capital
— FRNGT 🚀
FX:GBPUSD

DXY FRGNT Daily Forecast -Q4 | W47| D17 | Y25 |📅 Q4 | W47| D17 | Y25 |
📊 DXY FRGNT Daily Forecast
🔍 Analysis Approach:
I’m applying Smart Money Concepts, focusing on:
Identifying Points of Interest on the Higher Time Frames (HTFs) 🕰️
Using those POIs to define a clear trading range 📐
Refining those zones on Lower Time Frames (LTFs) 🔎
Waiting for a Break of Structure (BoS) for confirmation ✅
This method allows me to stay precise, disciplined, and aligned with the market narrative, rather than chasing price.
💡 My Motto:
"Capital management, discipline, and consistency in your trading edge."
A positive risk-to-reward ratio, paired with a high win rate, is the backbone of any solid trading plan 📈🔐
⚠️ Losses?
They’re part of the mathematical game of trading 🎲
They don’t define you — they’re necessary, they happen, and we move forward 📊➡️
🙏 I appreciate you taking the time to review my Daily Forecast.
Stay sharp, stay consistent, and protect your capital
— FRNGT 🚀
TVC:DXY

Uptrend Oscillation: Pullback Post-Open, 1.3300 BreakoutGenerally, it’s still in an upward oscillation.
Post-market opening, a minor retracement is expected before the uptrend resumes, with significant resistance near 1.3300—await a breakout
Buy 1.31500 - 1.31600
TP 1.31900 - 1.32400 - 1.32800
Accurate signals updated daily. They serve as a reliable guide for trading issues – feel free to refer to them. Hope they help!

GBP/USD FVG Retest: Target Range HighThe GBP/USD 4H chart is signaling a high-probability continuation based on Candle Range Theory (CRT) principles. This setup is designed to capture the explosive move to the range high after institutions have manipulated the market and are now entering the accumulation or distribution phase.
The roadmap is clear: Price has made a strong bullish move and is now pulling back toward the Fair Value Gap (FVG), which is marked on your chart. The FVG is a critical institutional point of interest, acting as a magnet for re-entry before the major push continues. This pullback often provides the precise, low-risk entry needed to ride the larger trend.
The ultimate objective is the liquidity resting above the high at 1.33696. This target represents the conclusion of the price cycle—the Distribution (Candle 3) phase—where the initial positions are exited for profit. To maximize conviction, this entry must be confirmed with the Smart Money Technique (SMT), checking the DXY. A failed follow-through on the Dollar Index at the moment GBP/USD enters this FVG confirms that smart money is ready to push this pair higher.
Strategy: Wait for price to enter and respect the FVG, then look for a lower-timeframe shift in market structure (like a Model #1 setup) to confirm the continuation toward the 1.33696 target. Be patient and selective—only participate in the best trades available.
Greetings,
MrYounity

BUY GBPUSD (head and shoulders pattern formed)A head and shoulder pattern was recently formed on the GBPUSD paid indicating it is time for a major reversal to the upside. The price also broke through all the last resistance levels and has nowhere else to go to except the next resistance zone which is marked as the next take profit level. We will be buying GBPUSD NOW!

GBPUSD - 30min | OutlookGBPUSD looks like there's still some bullish momentum heading up to 1.323xx where new opportunities could present themselves, if GBPUSD manages to successfully break the diagonal resistance and close above 1.325xx we could expect to see more bullish momentum leading up to 1.35xxx and based on the current Outlook on the $-index we could see a weakening USD thus fueling the current bullish narrative, else if GBPUSD fails to break 1.324xx we could expect to see new short term bearish opportunities.

GBP/USD – Head & Shoulders Pattern (13.11.2025)🧠 Setup Overview FX:GBPUSD
GBP/USD is forming a Head & Shoulders pattern on the 1H chart — a classical bullish reversal structure after a prolonged downtrend.
Price is currently holding above the right-shoulder support zone, showing early signs of accumulation. A breakout above the neckline would confirm bullish momentum toward the next resistance targets.
📊 Trading Plan✅ Bullish Scenario
If confirmed → Expect bullish continuation toward:
🟢 1st Resistance: 1.3287
🟢 2nd Resistance: 1.3360
⚡ Fundamental Updates
1️⃣ U.S. Treasury yields eased slightly as consumer confidence declined.
2️⃣ Markets now price a 66% chance of a rate cut in December, according to CME’s FedWatch Tool.
3️⃣ U.S. government shutdown concerns keep the dollar under mild pressure as investors watch debt issuance risk.
💬 Summary
A clear trendline rejection combined with fundamental USD weakness supports a short bias.
Wait for confirmation before entering — patience protects capital.
#GBP/USD #ForexAnalysis #TradingView #PriceAction #Trendline #Ichimoku #TechnicalAnalysis #ForexTrader #Fundamentals #SwingTrading #KABHI_TA_TRADING
⚠️ Disclaimer
This analysis is for educational purposes only and not financial advice.
Always do your own research and manage risk wisely.
📢 Support My Work
💚 Like, Comment & Share this idea to motivate more chart updates!
🧠 “Charts Don’t Lie, Traders Don’t Quit.”

GBPUSD FRGNT Daily Forecast & Full Pre LDN Open Breakdown📅 Q4 | W46 | D13 | Y25 |
📊 GBPUSD FRGNT Daily Forecast & Full Pre LDN Open Breakdown
🔍 Analysis Approach:
I’m applying Smart Money Concepts, focusing on:
Identifying Points of Interest on the Higher Time Frames (HTFs) 🕰️
Using those POIs to define a clear trading range 📐
Refining those zones on Lower Time Frames (LTFs) 🔎
Waiting for a Break of Structure (BoS) for confirmation ✅
This method allows me to stay precise, disciplined, and aligned with the market narrative, rather than chasing price.
💡 My Motto:
"Capital management, discipline, and consistency in your trading edge."
A positive risk-to-reward ratio, paired with a high win rate, is the backbone of any solid trading plan 📈🔐
⚠️ Losses?
They’re part of the mathematical game of trading 🎲
They don’t define you — they’re necessary, they happen, and we move forward 📊➡️
🙏 I appreciate you taking the time to review my Daily Forecast.
Stay sharp, stay consistent, and protect your capital
— FRNGT 🚀
FX:GBPUSD

GBPUSD FRGNT Daily Forecast - Q4 | W46 | D13 | Y25 |📅 Q4 | W46 | D13 | Y25 |
📊 GBPUSD FRGNT Daily Forecast
🔍 Analysis Approach:
I’m applying Smart Money Concepts, focusing on:
Identifying Points of Interest on the Higher Time Frames (HTFs) 🕰️
Using those POIs to define a clear trading range 📐
Refining those zones on Lower Time Frames (LTFs) 🔎
Waiting for a Break of Structure (BoS) for confirmation ✅
This method allows me to stay precise, disciplined, and aligned with the market narrative, rather than chasing price.
💡 My Motto:
"Capital management, discipline, and consistency in your trading edge."
A positive risk-to-reward ratio, paired with a high win rate, is the backbone of any solid trading plan 📈🔐
⚠️ Losses?
They’re part of the mathematical game of trading 🎲
They don’t define you — they’re necessary, they happen, and we move forward 📊➡️
🙏 I appreciate you taking the time to review my Daily Forecast.
Stay sharp, stay consistent, and protect your capital
— FRNGT 🚀
FX:GBPUSD

GBPUSD FRGNT Daily Forecast & Breakdown -Q4 | W46 | D12 | Y25 |
📅 Q4 | W46 | D12 | Y25 |
📊 GBPUSD FRGNT Daily Forecast & Breakdown
🔍 Analysis Approach:
I’m applying Smart Money Concepts, focusing on:
Identifying Points of Interest on the Higher Time Frames (HTFs) 🕰️
Using those POIs to define a clear trading range 📐
Refining those zones on Lower Time Frames (LTFs) 🔎
Waiting for a Break of Structure (BoS) for confirmation ✅
This method allows me to stay precise, disciplined, and aligned with the market narrative, rather than chasing price.
💡 My Motto:
"Capital management, discipline, and consistency in your trading edge."
A positive risk-to-reward ratio, paired with a high win rate, is the backbone of any solid trading plan 📈🔐
⚠️ Losses?
They’re part of the mathematical game of trading 🎲
They don’t define you — they’re necessary, they happen, and we move forward 📊➡️
🙏 I appreciate you taking the time to review my Daily Forecast.
Stay sharp, stay consistent, and protect your capital
— FRNGT 🚀
FX:GBPUSD

BUY GBPUSD (head and shoulder pattern formed)A head and shoulder pattern was recently formed on the GBPUSD paid indicating it is time for a major reversal to the upside. The price also broke through all the last resistance levels and has nowhere else to go to except the next resistance zone which is marked as the next take profit level. We will be buying GBPUSD NOW!
