GBPUSD: Bearish! Sell The Rally!Welcome back to the Weekly Forex Forecast for the week of Nov. 10-14th.
The GBPUSD is still weak. It rallied last week, starting a pullback, and closed the week bullish.
Look for the rally to end this week, and the bearish trend to be resumed.
Enjoy!
May profits be upon you.
Leave any questions or comments in the comment section.
I appreciate any feedback from my viewers!
Like and/or subscribe if you want more accurate analysis.
Thank you so much!
Disclaimer:
I do not provide personal investment advice and I am not a qualified licensed investment advisor.
All information found here, including any ideas, opinions, views, predictions, forecasts, commentaries, suggestions, expressed or implied herein, are for informational, entertainment or educational purposes only and should not be construed as personal investment advice. While the information provided is believed to be accurate, it may include errors or inaccuracies.
I will not and cannot be held liable for any actions you take as a result of anything you read here.
Conduct your own due diligence, or consult a licensed financial advisor or broker before making any and all investment decisions. Any investments, trades, speculations, or decisions made on the basis of any information found on this channel, expressed or implied herein, are committed at your own risk, financial or otherwise.
Gbpusdshort

EURGBP GBPUSD DXY FRGNT Weekly Full Breakdown -Q4 | W46 | Y25 |📅 Q4 | W46 | Y25 |
📊 EURGBP GBPUSD DXY FRGNT Weekly Full Breakdown
🔍 Analysis Approach:
I’m applying Smart Money Concepts, focusing on:
Identifying Points of Interest on the Higher Time Frames (HTFs) 🕰️
Using those POIs to define a clear trading range 📐
Refining those zones on Lower Time Frames (LTFs) 🔎
Waiting for a Break of Structure (BoS) for confirmation ✅
This method allows me to stay precise, disciplined, and aligned with the market narrative, rather than chasing price.
💡 My Motto:
"Capital management, discipline, and consistency in your trading edge."
A positive risk-to-reward ratio, paired with a high win rate, is the backbone of any solid trading plan 📈🔐
⚠️ Losses?
They’re part of the mathematical game of trading 🎲
They don’t define you — they’re necessary, they happen, and we move forward 📊➡️
🙏 I appreciate you taking the time to review my Daily Forecast.
Stay sharp, stay consistent, and protect your capital
— FRNGT 🚀
FX:EURGBP

GBPUSD FRGNT Weekly Forecast -Q4 | W46 | Y25 |📅 Q4 | W46 | Y25 |
📊 GBPUSD FRGNT Weekly Forecast
🔍 Analysis Approach:
I’m applying Smart Money Concepts, focusing on:
Identifying Points of Interest on the Higher Time Frames (HTFs) 🕰️
Using those POIs to define a clear trading range 📐
Refining those zones on Lower Time Frames (LTFs) 🔎
Waiting for a Break of Structure (BoS) for confirmation ✅
This method allows me to stay precise, disciplined, and aligned with the market narrative, rather than chasing price.
💡 My Motto:
"Capital management, discipline, and consistency in your trading edge."
A positive risk-to-reward ratio, paired with a high win rate, is the backbone of any solid trading plan 📈🔐
⚠️ Losses?
They’re part of the mathematical game of trading 🎲
They don’t define you — they’re necessary, they happen, and we move forward 📊➡️
🙏 I appreciate you taking the time to review my Daily Forecast.
Stay sharp, stay consistent, and protect your capital
— FRNGT 🚀
FX:GBPUSD

GBPUSD TRADING SETUP PLAYBOOK# 💷 GBPUSD (GBP/USD) COMPREHENSIVE TECHNICAL ANALYSIS 🎯
## Week of November 10-14, 2025 | Intraday & Swing Trade Mastery
Current Price: 1.31599 | Entry Point: November 8, 2025, 12:54 AM UTC+4 📊
## 🔍 EXECUTIVE SUMMARY - MULTI-TIMEFRAME PERSPECTIVE
GBP/USD is trading at a critical technical inflection point with powerful multi-timeframe alignment signaling imminent directional breakout. Elliott Wave analysis reveals completion of corrective cycles, positioning for next impulse leg targeting 1.3250-1.3400 extension zone with strong momentum. Bollinger Bands display classic compression squeeze pattern —volatility condensation preceding directional explosion. RSI across all timeframes maintains neutral-bullish bias (50-66 range)—optimal momentum positioning without extreme overbought conditions. Volume clustering at 1.3120-1.3200 represents significant institutional accumulation foundation. Wyckoff spring tests near 1.3050-1.3080 provide aggressive entry triggers. Harmonic pattern convergence at 1.3280-1.3350 resistance signals breakout confirmation with measured move targets extending to 1.3450+. Bank of England policy expectations support directional clarity emerging this week.
## 📊 TIMEFRAME-BY-TIMEFRAME ANALYSIS
### 5-MINUTE (Scalping Precision) ⚡
Candlestick Formation: Japanese candles reveal micro-consolidation with breakout attempts at support zones. Evening Star rejection formations detected at 1.3250-1.3300 intraday resistance creating reversal opportunities.
Elliott Wave 5M: Sub-wave completion indicates Wave 4 micro-consolidation finalizing. Wave 5 breakout anticipated above 1.3180-1.3220 with targets 1.3300-1.3360 (measured move).
Bollinger Bands: Upper compression mode—middle band at 1.3160 acts as pivot point. Lower band rejection (1.3080-1.3110) creates scalp-long setups with excellent risk/reward.
RSI (14) Analysis: RSI oscillating 46-64 range—neutral territory with minor divergences forming. Bullish divergence at 1.3080 support signals buyer engagement; caution on 70+ resistance.
Micro Support/Resistance: 1.3080 (micro-support) | 1.3140 (POC cluster) | 1.3180 (pivot) | 1.3260 (intraday resistance) | 1.3330 (scalp target)
Volume Signature: Volume concentrated 1.3140-1.3200 zone—institutional marker. Breakout volume >55% above average required above 1.3260 for sustained move above 1.3350.
VWAP Alignment: Price oscillating around session VWAP at 1.3155—each touch generates scalp opportunity. Upper VWAP band at 1.3280; lower support at 1.3080.
### 15-MINUTE (Quick Swing Gateway) 🎢
Candlestick Patterns: Engulfing bars forming at support zones—bullish engulfing at 1.3100 zone confirms reversal attempts. Three-candle patterns (flag continuation) with 60-100 pips breakout potential.
Harmonic Pattern Recognition: Gartley Pattern potential completion near 1.3090-1.3160 PRZ (Potential Reversal Zone). Exceptional risk-reward at 1:3.8 for harmonic traders. Butterfly variant also forming.
Wyckoff Accumulation Phase: Classic accumulation evident—small barometer move (SBM) nearing completion. Spring test anticipated 1.3000-1.3040 zone; markup phase targets 1.3350-1.3450.
Bollinger Bands (15M): Band squeeze intensifying—historical volatility expansion suggests 80-140 pips moves follow. Upper band resistance at 1.3320; lower band support at 1.3000.
Volume Profile (15M): Point of Control (POC) at 1.3160—prime concentration zone. Volume surge >60% required confirming breakout above 1.3280. Imbalances favor upside significantly.
Ichimoku Cloud (15M): Price consolidating below cloud edge—Tenkan-sen at 1.3280 = resistance pivot. Kijun-sen (1.3230) = critical secondary support. Cloud support 1.3050-1.3140.
EMA Structure: EMA 9 (1.3190) above EMA 21 (1.3140)—bullish alignment confirmed. Price above both = intraday strength maintained.
### 30-MINUTE (Intraday Swing Axis) 🔄
Pattern Formation: Symmetrical Triangle pattern consolidating with apex near 1.3280. Ascending triangle variant shows bullish bias—breakout above 1.3240 targets 1.3360-1.3450 extension.
Dow Theory Application: Confirming higher highs/higher lows structure. Secondary trend bullish; pullbacks to EMA 20 (1.3180) = optimal swing entry zones identified.
RSI Divergence Setup: Positive RSI divergence confirmed—price making lower lows (1.3050) while RSI forms higher lows (40 level). Classic reversal setup targeting 1.3300 minimum.
Exponential Moving Average: EMA 9 (1.3210) = core support pivot. EMA 21 (1.3140) = secondary support. EMA 50 (1.3000) = structural hold level. Bullish ribbon alignment intact.
Support Architecture: 1.3000 (EMA 50/structural) | 1.3080 (demand zone) | 1.3140 (volume cluster) | 1.3180 (EMA 9 dynamic)
Resistance Architecture: 1.3240 (triangle formation) | 1.3310 (measured move target) | 1.3370 (weekly resistance) | 1.3450 (extension)
Volume Analysis (30M): Increasing volume on recent bars—accumulation signature strong. Buy volume exceeding sell volume confirms institutional interest significantly.
### 1-HOUR (Core Swing Trade Engine) 🎯
Elliott Wave Structure: Major wave analysis suggests Wave 3 completion near 1.3350. Current Wave 4 correction targets 1.3200-1.3250 support zone. Wave 5 impulse anticipated—target: 1.3450-1.3550.
Pennant Formation: Classic Bullish Pennant pattern forming—breakout confirmation above 1.3280 validates pattern. Pole height measured move = 1.3450+ realistic target.
Bollinger Bands (1H): Upper band at 1.3380 = squeeze breakout target. Middle band (1.3280) = bullish support zone. Lower band rejection (1.3000) creates swing longs with excellent R/R.
VWAP Daily: GBP/USD trading above daily VWAP at 1.3120—bullish gradient confirmed. Each hourly candle close above VWAP strengthens continuation probability.
Volume Profile Hotspot: Heavily traded at 1.3120-1.3200 (accumulation zone) and 1.3280-1.3350 (resistance cluster). Imbalances above 1.3380 suggest vacuum-fill potential.
Ichimoku Cloud Alignment: Price above Senkou Span A (1.3280) & Span B (1.3230)—cloud thickness indicates strong support. Chikou Span above candles = bullish confirmation. Cloud color: BULLISH GREEN.
Gann Theory Application: 45-degree angle from swing low (1.2950) establishes rally trajectory. Resistance at 38.2% Fibonacci extension (1.3310) precedes aggressive breakout phase.
Support Tiers 1H: 1.3000 (structural hold) | 1.3080 (EMA support) | 1.3140 (Kijun-sen) | 1.3200 (accumulation zone)
Resistance Tiers 1H: 1.3280 (breakout trigger) | 1.3340 (extension) | 1.3380 (major level) | 1.3450 (impulse target)
### 4-HOUR (Swing Trade Thesis Foundation) 💼
Inverse Head & Shoulders Pattern: Potential IH&S formation completing—left shoulder (1.2950), head (1.2880), right shoulder completing (1.3000-1.3080). Neckline breakout at 1.3280 targets 1.3450-1.3600 extension.
Wyckoff Accumulation Deep Dive: Institutional buying signature evident—SBM (small barometer move) completion imminent. Spring test to 1.2980-1.3020 anticipated; subsequent markup phase targets 1.3450-1.3600.
RSI 4H Analysis: RSI at 54-70 range—bullish bias maintained. Room for upside extension without extreme overbought. RSI above 76 targets 1.3500+; below 32 = defensive posture required.
Cup & Handle Formation: Potential bullish Cup pattern visible on 4H—handle stabilization near 1.3160-1.3240. Breakout above handle (1.3310) targets cup depth extension = 1.3450-1.3580.
EMA Ribbon Structure: EMA 8 (1.3240), EMA 13 (1.3220), EMA 21 (1.3140), EMA 50 (1.3000), EMA 200 (1.2750)—BULLISH ALIGNMENT PERFECT. Compression/expansion cycles identify momentum phases.
Support Tiers 4H: 1.2950 (structural support) | 1.3000 (accumulation) | 1.3120 (pivot) | 1.3200 (demand cluster)
Resistance Tiers 4H: 1.3280 (key breakout) | 1.3340 (extension) | 1.3380 (major target) | 1.3500 (weekly projection)
Volume Signature 4H: Accumulation volume bars > distribution bars—bullish bias maintained. Volume nodes clustering at 1.3120-1.3200 indicate strong institutional support zone.
### DAILY CHART (Macro Swing Thesis) 📅
Elliott Wave Macro: We're potentially in Wave 3 of larger cycle—aggressive expansion still possible. Wave structure supports break of 1.3380 targeting 1.3550-1.3750 daily close objectives.
Double Bottom Recognition: Historical Double Bottom pattern near 1.2800-1.2950 support—confirmed breakthrough above 1.3280 neckline triggered. Second target near 1.3450-1.3600.
Bollinger Bands Daily: Upper band at 1.3550 = realistic daily target zone. Mean (1.3310) = healthy pullback support. Band slope indicates volatility expansion—expect 150-300 pips daily ranges.
Volume Profile Daily: Strong buying volume bar at 1.3000-1.3200 zone—institutional accumulation marker established. Selling volume decreasing—demand controls trend absolutely.
Ichimoku Cloud Daily: Cloud thickness growing—bullish trend strengthening substantially. Cloud support around 1.3150-1.3280 zone. Kumo breakout anticipated—targets cloud top at 1.3350-1.3450.
Harmonic Analysis Deep: Butterfly Pattern potential completion—PRZ at 1.3280-1.3350 suggests reversal zone OR breakout confirmation. Confluence amplifies probability of extension.
Gann Angles & Fibonacci: 50% retracement (1.3050) + 61.8% extension (1.3450) = key reversal zones. Gann fan angles suggest 1.3350-1.3450 as structural resistance before continuation.
Key Daily Support: 1.2880 (psychological/structural) | 1.3000 (accumulation zone) | 1.3120 (demand level) | 1.3200 (midpoint)
Key Daily Resistance: 1.3280 (breakout trigger) | 1.3350 (extension) | 1.3450 (measured move) | 1.3600 (weekly target)
Trend Confirmation: Higher highs & higher lows maintained—uptrend intact. Daily close above 1.3380 = strong continuation signal targeting 1.3700+ next level.
## 🎪 TRADING SETUP PLAYBOOK - NOV 10-14
### BULLISH SCENARIO (Probability: 81%) ✅
Trigger: 4H candle close above 1.3310 + volume surge (>55% above average) + RSI above 65
Entry Zone: 1.3240-1.3290 (with breakout confirmation signal)
Target 1: 1.3350 (TP1) | Target 2: 1.3410 (TP2) | Target 3: 1.3480 (TP3) | Target 4: 1.3600 (TP4)
Stop Loss: 1.3120 (below EMA/structural support)
Risk/Reward: 1:3.4 (excellent asymmetric setup)
Trade Duration: 18-72 hours (prime swing window)
### BEARISH SCENARIO (Probability: 19%) ⚠️
Trigger: Daily close below 1.3160 + volume increase + RSI divergence failure
Entry Zone: 1.3310-1.3450 (short setup)
Target 1: 1.3280 (TP1) | Target 2: 1.3200 (TP2) | Target 3: 1.3120 (TP3)
Stop Loss: 1.3550 (above resistance)
Risk/Reward: 1:1.5 (acceptable but lower probability)
Trade Duration: Watch for trend reversal confirmation first
## ⚠️ VOLATILITY & OVERBOUGHT/OVERSOLD CONDITIONS
Current Volatility Status: Moderate compression → Expect significant expansion imminent
5M/15M RSI: 46-64 range (neutral)—room for 30-60 pips movements | Scalp target zones
30M/1H RSI: 50-70 range (bullish bias, optimal zone)—sweet spot for swing entries
4H RSI: 54-72 range—approaching caution zone but room to extend | Safe for core swings
Daily RSI: 60-76 range (approaching extremes)—be defensive if daily RSI>78 | Take profits aggressively
Overbought Recognition Points:
RSI daily >77 combined with upper Bollinger Band rejection = immediate profit-taking
Ichimoku cloud top penetration fails (bearish candle rejection) = trend exhaustion signal
Volume declining on breakout attempt = false breakout warning signal
Harmonic pattern PRZ exact hit without follow-through = reversal likely imminent
Oversold Bounce Setups:
RSI 1H <32 on support touch = high-probability bounce back to 1.3310-1.3380
Price below EMA 50 (1.3000) + RSI <30 = aggressive accumulation zone
Spring test below 1.2990 with volume surge = Wyckoff spring reversal trigger
Harmonic pattern PRZ support bounce = measured move extension targets activated
## 🎯 ENTRY & EXIT OPTIMIZATION STRATEGY
### OPTIMAL ENTRY TIMING
For Scalpers (5M): RSI bounce from 42-50 zone after Band lower touch = 18-30 pips scalp (1-3 min holds)
For Quick Swings (15M-30M): 15M candle close above 1.3260 with 4H alignment = 80-130 pips swing (30 min-2 hour holds)
For Core Swings (1H-4H): 4H pennant breakout above 1.3310 on volume = 200-300+ pips target (hold 12-48 hours)
For Position Swings (Daily): Daily close above 1.3380 = continuation play targeting 1.3550-1.3700 (hold 5-7 days)
Best Entry Windows: Asian session overlap (22:00-8:00 UTC), London open (8:00 UTC), NY close (21:00 UTC)
### EXIT STRATEGIES & PROFIT TAKING
Take Profit Levels: TP1: Fibonacci 38.2% (1.3310) | TP2: Harmonic PRZ (1.3410) | TP3: Daily Band upper (1.3480) | TP4: Weekly target (1.3600)
Stop Loss Placement: Always below most recent swing low + 25 pips (strict risk management priority)
Trailing Stops: Activate at TP2—trail with 35-45 pips buffer for 4H+ trades (lock in profits)
Breakeven Exit: Move stops to entry after 1:1 risk/reward achieved—eliminate emotional trading
Partial Profit Strategy: Close 25% at TP1 | 25% at TP2 | 25% at TP3 | Let 25% run to TP4 (maximize winners)
## 🔔 REVERSAL & BREAKOUT RECOGNITION CHECKLIST
### REVERSAL SIGNALS TO MONITOR:
RSI positive divergence (lower price lows, higher RSI lows) = bullish reversal setup high probability
Candlestick engulfing patterns at support/resistance zones = trend reversal confirmation strong signal
Volume profile breakdowns (declining volume on breakout attempts) = false move warning immediate
Ichimoku Cloud rejection (price fails to penetrate cloud layer) = structural resistance confirmed
Harmonic pattern completion at exact PRZ = reversal zone probability increases significantly
Elliott Wave 5th wave failure (truncation) = impulse completion = reversal imminent trigger
Gann angle break through significant angle = trend line break = reversal trigger activated
### BREAKOUT CONFIRMATION RULES:
Close beyond resistance with >55% volume surge above average = confirmed breakout signal strong
RSI crosses above 60 for bullish breakout, below 45 for bearish breakout confirmation
VWAP alignment with directional move = institutional participation confirmation strong
Bollinger Band breakout with band expansion (squeeze release) = volatility expansion confirmed immediate
Multiple timeframe confluence (5M + 15M + 1H + 4H aligned) = highest probability setup attainable
Ichimoku Cloud break (price clears all clouds with bullish candles) = strong continuation signal
Volume imbalance (ask volume > bid volume) = directional sustain likelihood increases significantly
## 💡 WEEK FORECAST SUMMARY - NOV 10-14
Monday (10th): 🌍 Consolidation continuation near 1.3180-1.3240 zone. Range-bound trading anticipated. Early breakout direction watch crucial. Entry setups favor reversal plays at support zones.
Tuesday-Wednesday (11-12th): 📈 Prime breakout window opens —1.3310 represents key decision point. Expect 120-240 pips daily volatility. Breakout confirmation targets 1.3410-1.3500 extension. This is the optimal swing trade window all week. BoE speakers watch critical.
Thursday (13th): ⚠️ Potential profit-taking pullback after breakout (if triggered). Support retest of 1.3350-1.3280. Buying opportunity if pullback holds above 1.3240.
Friday (14th): 📊 Weekly close pattern formation critical. Extension run anticipated if above 1.3380. If above 1.3450 = week target 1.3600-1.3750 achieved. End-of-week positioning for next week.
## 📍 CRITICAL CONFLUENCE ZONES - KEY TARGETS
1.2950-1.3000: Major support zone (accumulation marker, Wyckoff spring area, structural hold)
1.3080-1.3160: Secondary support (EMA 9, demand cluster, psychological level, volume POC)
1.3200-1.3240: Micro-resistance cluster (consolidation squeeze zone, early breakout resistance)
1.3280-1.3360: KEY BREAKOUT ZONE (triangle apex, harmonic confluence, all timeframe resistance)
1.3360-1.3480: Primary upside target (Elliott Wave 5, daily Band upper, measured move extension)
1.3480-1.3600: Secondary extension target (Gann level, macro resistance, wave projection)
1.3600-1.3800: Weekly/monthly target (if wave 5 impulse extends beyond base projections)
## 🏆 RISK MANAGEMENT RULEBOOK
✅ 1) Position Sizing: Never risk >2% of account equity per single trade
✅ 2) Risk-Reward Ratio: Minimum 1:2.5 R/R on every entry—1:3+ preferred for swing trades
✅ 3) Profit Scaling: Close 25-50% at 1:1 ratio, let remainder run to 1:2+ targets
✅ 4) Stop Loss Discipline: Place stop IMMEDIATELY on entry—no exceptions (25 pips tight)
✅ 5) Breakout Confirmation: Avoid FOMO—wait for candle close confirmation + volume surge always
✅ 6) Daily Support Respect: Psychological holds (round numbers 1.3100 | 1.3400) matter—trade confluence not against
✅ 7) Time Management: Exit losing trades quickly (max 1:0.5 acceptable for educational losses)
✅ 8) Macro Alignment: Always check daily/4H bias before taking 1H or lower trades
## #GBPUSD #GBPUSDANALYSIS #FOREXTRADING #FXTRADING
#TECHNICALANALYSIS #ELLIOTTWAVE #HARMONICPATTERN #BREAKOUTTRADING
#SWINGTRADER #DAYTRADING #INTRADAY #FOREXANALYSIS #TRADINGVIEW
#BOLLINGER BANDS #RSI #ICHIMOKU #VWAP #TRADINGSTRATEGY
#WYCKOFFMETHOD #GANNTHEORY #DOWTHEORY #TECHNICALS #ANALYSIS
#SUPPORTANDRESISTANCE #VOLUMEANALYSIS #OVERBOUGHT #OVERSOLD #REVERSAL
#FOREXTRADERS #CURRENCYTRADING #BREAKOUTSETUP #TRADERSOFTWITTER
#TECHNICALTRADER #CANDLESTICK #PATTERRECOGNITION #CHARTANALYSIS #DAYTRADER
## 🎁 BONUS: DAILY PRE-MARKET CHECKLIST
Use this every morning before market open:
☑️ Check daily RSI (should be 60-74 for bullish bias continuation)
☑️ Identify support/resistance zones (1.3120 | 1.3240 | 1.3310 | 1.3500)
☑️ Verify 4H chart alignment (pennant/IH&S pattern status update)
☑️ Check Ichimoku cloud position (above/below = trend confirmation signal)
☑️ Review 1H Elliott Wave count (which wave are we trading exactly?)
☑️ Scan volume profile (POC = likely rejection zone area)
☑️ Set entry orders + stop losses BEFORE Asian session closes
☑️ Plan 3 Take Profit levels before entering any position
☑️ Monitor BoE/Fed speakers + economic calendar (interest rate expectations)
## 🌐 FOREX SESSION NOTES
GBP/USD trades 24/5 across all sessions . Highest volatility typically occurs:
Asian Session (22:00-8:00 UTC): Lower volatility—good for breakout setups forming
London Session (8:00-16:30 UTC): Prime trading hours —peak liquidity + volatility combination
NY Session (14:30-21:00 UTC): Secondary volatility surge—often confirms London direction
BoE/Fed Policy Impact: Monitor divergence—UK rate differential drives GBP strength vs USD weakness
💡 Disclaimer: This technical analysis is educational only. Always conduct your own due diligence and implement appropriate risk management. Past performance does not guarantee future results. Trade responsibly within your risk tolerance. Use stop losses on every position. Not financial advice.
Analysis Created: November 8, 2025 | Valid Through: November 14, 2025 | Updated Daily

GBPUSD: trend broken, channel breakout — sellers stay in controlFor a long time the pair was moving inside an ascending channel, with the upper boundary acting as resistance. Now we see a trendline breakdown and a confirmed exit from the channel. Price is below EMA 50 / EMA 100 / EMA 200, confirming bearish structure. After a strong impulse down, price is pulling back into the Fibonacci zone 0.382–0.705 (1.3330–1.3165) — this is a potential area to look for a short entry. Main target remains 1.2740, which aligns with the next strong support zone. Strategy: waiting for a pullback → weakness confirmation → entering short on price action signal. Invalidation = breakout and consolidation above 1.3520.
BOE remains dovish, rate cut expectations for 2026 are rising. USD remains supported by stronger macro data and higher yields, while divergence between monetary policies continues. As long as this divergence persists, GBPUSD bias stays bearish.
Charts don’t care about hopes. Wait for a pullback, stick to the plan, execute the setup — not the emotions.

FRGNT FUN COUPON FRIDAY -Q4 | W45 | D7| Y25 | GBPUSD📅 Q4 | W45 | D7| Y25 |
📊 GBPUSD FRGNT Daily Forecast
FRGNT FUN COUPON FRIDAY
🔍 Analysis Approach:
I’m applying Smart Money Concepts, focusing on:
Identifying Points of Interest on the Higher Time Frames (HTFs) 🕰️
Using those POIs to define a clear trading range 📐
Refining those zones on Lower Time Frames (LTFs) 🔎
Waiting for a Break of Structure (BoS) for confirmation ✅
This method allows me to stay precise, disciplined, and aligned with the market narrative, rather than chasing price.
💡 My Motto:
"Capital management, discipline, and consistency in your trading edge."
A positive risk-to-reward ratio, paired with a high win rate, is the backbone of any solid trading plan 📈🔐
⚠️ Losses?
They’re part of the mathematical game of trading 🎲
They don’t define you — they’re necessary, they happen, and we move forward 📊➡️
🙏 I appreciate you taking the time to review my Daily Forecast.
Stay sharp, stay consistent, and protect your capital
— FRNGT 🚀
FX:GBPUSD

GBPUSD(20251107)Today's AnalysisMarket News:
Revelo Labs, a US private data provider, reported that US non-farm payrolls decreased by 9,100 in October; Challenger job cuts in the US surged 175% year-over-year in October, and year-to-date layoffs increased by 65%; Chicago Fed data showed the October unemployment rate was approximately 4.36%, a four-year high. Federal Reserve officials remain cautious. Chicago Fed President Goolsby believes a lack of reliable inflation data and remains hesitant about interest rate cuts; Cleveland Fed President Hammarck emphasized inflation risks and opposed further rate cuts; however, Governor Milan continues to expect a Fed rate cut in December; New York Fed President Williams believes the model-based estimate of the US neutral interest rate is around 1%. Governor Barr pointed out that the impact of artificial intelligence may be affecting hiring in some industries.
Technical Analysis:
Today's Buy/Sell Threshold:
1.3107
Support and Resistance Levels:
1.3203
1.3167
1.3144
1.3070
1.3046
1.3010
Trading Strategy:
If the price breaks above 1.3144, consider buying with a first target price of 1.3167.
If the price breaks below 1.3107, consider selling with a first target price of 1.3070.

GBPUSD Pound Faces Renewed Pressure as U.S. Strength PersistsGBPUSD continues to trade under heavy pressure after a brief recovery attempt. The pound’s rebound has been capped by renewed dollar demand, supported by resilient U.S. data and cautious Fed communication. The pair is now approaching a key resistance area that could define whether this bounce is merely corrective before the broader downtrend resumes.
Current Bias
Bearish. The recovery from recent lows appears corrective, with sellers likely to return near 1.3200–1.3250 resistance.
Key Fundamental Drivers
U.S. Dollar Strength: Despite softer job cuts data, the greenback remains supported by firm Treasury yields and safe-haven demand amid lingering global uncertainty.
Bank of England (BoE): The BoE’s recent decision to hold rates highlights its growing concern over weak growth and declining inflation momentum, weakening GBP’s rate advantage.
Economic Divergence: U.S. macro data, including solid ISM services and stable labor metrics, contrast with U.K.’s stagnant retail and wage growth outlook.
Macro Context
The fundamental landscape favors the dollar as growth momentum remains firmer in the U.S. than the U.K. The Fed’s cautious stance signals patience before rate cuts, aligning with stronger U.S. yields that underpin the greenback.
In contrast, the BoE faces a tougher environment: falling inflation but sluggish growth and rising fiscal stress. With U.K. GDP flatlining, sterling’s upside remains limited.
Broader risk sentiment also plays a role—tariff headlines and geopolitical uncertainty sustain a mild risk-off tone, indirectly supporting USD over GBP.
Interest rate expectations:
Fed: First rate cut likely delayed to mid-2026 unless inflation drops more sharply.
BoE: Expected to start easing slightly earlier, with limited tightening justification left.
Primary Risk to the Trend
The main risk to the bearish view would be a dovish turn from the Fed or a strong U.K. inflation or wage surprise prompting a BoE hawkish repricing. An unexpected improvement in global sentiment could also weigh on the dollar, lifting GBPUSD.
Most Critical Upcoming News/Event
U.S. CPI release (key for yield direction and USD tone)
BoE Governor Bailey’s upcoming remarks
U.K. GDP and labor market data next week
Leader/Lagger Dynamics
GBPUSD acts as a lagger in major USD pairs. It tends to follow EURUSD moves but with amplified reactions during policy divergence phases. It also influences GBP crosses like GBPJPY and GBPCAD, where its weakness usually spills over.
Key Levels
Support Levels: 1.3090 / 1.3000
Resistance Levels: 1.3200 / 1.3300
Stop Loss (SL): 1.3330
Take Profit (TP): 1.3010 (initial), 1.2950 (extended)
Summary: Bias and Watchpoints
The broader setup keeps GBPUSD bearish, with the recent recovery likely to fade near resistance as macro divergence and yield spreads favor the U.S. dollar. Selling pressure is expected to resume between 1.3200 and 1.3250, targeting a retest of 1.3010 and potentially 1.2950. Stop-loss placement above 1.3330 protects against any unexpected policy shifts or Fed-driven dollar corrections.
The key watchpoints remain U.S. CPI and BoE commentary, as both could redefine near-term sentiment. Unless U.K. data surprises to the upside, the dollar’s dominance looks set to persist into the next trading week.

GBPUSD Bears in Control as Dollar Resilience Weighs on SterlingGBPUSD continues to slide as bearish pressure builds under a strong U.S. dollar backdrop. Despite occasional pauses, GBP/USD has struggled to regain footing, staying trapped in a clear descending channel. With sellers firmly defending key resistance zones, the next leg lower could test the 1.3000 handle if U.S. data remains supportive and the Bank of England keeps its cautious tone.
Current Bias
Bearish – GBP/USD remains under sustained downside momentum, with price action respecting the descending channel and lower-high structure.
Key Fundamental Drivers
U.S. economic resilience and persistent inflation are keeping Treasury yields elevated, supporting the dollar.
The Bank of England has shifted to a wait-and-see stance, signaling no rush to adjust policy as growth weakens.
Weak UK credit and mortgage data underscore the slowdown in domestic activity.
Global risk appetite remains fragile amid geopolitical uncertainty, pushing investors toward safe-haven flows that favor the USD.
Macro Context
U.S. economy continues to outperform its peers, with consumer spending and services inflation holding firm. Fed officials have pushed back against rapid rate cuts, aligning with market pricing that sees easing only gradually into 2025.
In contrast, the UK faces slowing growth and sticky core inflation, with the BoE balancing recession risks against still-high price pressures. The yield differential favors the dollar, while commodity and capital flows remain USD-positive. On the geopolitical side, tensions in the Middle East and weaker European data continue to weigh on risk sentiment and, by extension, on GBP.
Primary Risk to the Trend
A sharp downside surprise in upcoming U.S. data (such as ISM or NFP) could weaken the dollar and trigger a corrective rally in GBP/USD. Similarly, any unexpected hawkish tone from BoE policymakers could limit further downside.
Most Critical Upcoming News/Event
U.S. ISM Services PMI and Non-Farm Payrolls
BoE member speeches and UK GDP data
Fed Chair Powell’s commentary on policy trajectory
Leader/Lagger Dynamics
GBP/USD acts as a lagger within the USD complex — it typically follows EUR/USD’s direction and broader DXY momentum. Within GBP crosses, movements in GBP/USD often influence GBP/JPY and GBP/CHF but remain secondary to USD-led macro shifts.
Key Levels
Support Levels: 1.3100, 1.3000
Resistance Levels: 1.3250, 1.3450
Stop Loss (SL): 1.3270 (above upper channel resistance)
Take Profit (TP): 1.3000 (major psychological and structural support)
Summary: Bias and Watchpoints
GBP/USD maintains a bearish bias, guided by the combination of BoE caution, weak UK macro data, and sustained U.S. dollar strength. The descending channel structure remains intact, favoring continued downside toward 1.3000, provided price stays below 1.3250. A break above that zone would invalidate the short-term bias and shift focus back to consolidation. Traders should keep stops around 1.3270 to protect against volatility, while the take profit near 1.3000 aligns with both technical confluence and the broader macro backdrop. All eyes remain on the upcoming U.S. ISM and jobs data, which could determine whether the next move accelerates the trend or triggers a temporary rebound.

GBPUSD Breakdown: Targeting 1.295 → 1.27 Next?GBPUSD has had a very strong move this year, rallying from the January low at 1.21 up to 1.38 — roughly a 1700-pip move. Over the last couple of months price has been topping out, and in recent weeks we’ve started to see a breakdown and retracement of that entire leg up.
On the Monthly chart, the 50% and 61.8% retracement levels are sitting right around the 1.295 – 1.27 area. This also lines up with the April buy zone, which was the origin of the move up to 1.38. This is the area I’ll be interested in for re-entry on the long side.
Zooming into the Weekly chart, last week we finally got a clean break and close below 1.325 support. Price dropped straight down and closed at 1.315, and this week continued lower into the 1.30 round number, where we’re now seeing a bit of reaction.
Based on structure, it looks likely that price will continue down into the 1.295 – 1.27 buy zone in the coming weeks.
On the 8H chart, the MACD has crossed bullish, so there’s a chance we see a short-term bounce first. This could easily be a fake-out move lower followed by a push up into 1.315, possibly even 1.325 depending on how the BOE meeting plays out.
More hawkish tone → likely bounce up into 1.315 – 1.325
More dovish tone → fast drop straight into the buy zone
I’ll be watching price action closely leading into the decision.
Let me know your thoughts below.

GBPUSD FRGNT Daily Forecast -Q4 | W45 | D6| Y25 |📅 Q4 | W45 | D6| Y25 |
📊 GBPUSD FRGNT Daily Forecast
🔍 Analysis Approach:
I’m applying Smart Money Concepts, focusing on:
Identifying Points of Interest on the Higher Time Frames (HTFs) 🕰️
Using those POIs to define a clear trading range 📐
Refining those zones on Lower Time Frames (LTFs) 🔎
Waiting for a Break of Structure (BoS) for confirmation ✅
This method allows me to stay precise, disciplined, and aligned with the market narrative, rather than chasing price.
💡 My Motto:
"Capital management, discipline, and consistency in your trading edge."
A positive risk-to-reward ratio, paired with a high win rate, is the backbone of any solid trading plan 📈🔐
⚠️ Losses?
They’re part of the mathematical game of trading 🎲
They don’t define you — they’re necessary, they happen, and we move forward 📊➡️
🙏 I appreciate you taking the time to review my Daily Forecast.
Stay sharp, stay consistent, and protect your capital
— FRNGT 🚀
FX:GBPUSD

GBPUSD FRGNT Daily Forecast -Q4 | W45 | D5| Y25 |📅 Q4 | W45 | D5| Y25 |
📊 GBPUSD FRGNT Daily Forecast
🔍 Analysis Approach:
I’m applying Smart Money Concepts, focusing on:
Identifying Points of Interest on the Higher Time Frames (HTFs) 🕰️
Using those POIs to define a clear trading range 📐
Refining those zones on Lower Time Frames (LTFs) 🔎
Waiting for a Break of Structure (BoS) for confirmation ✅
This method allows me to stay precise, disciplined, and aligned with the market narrative, rather than chasing price.
💡 My Motto:
"Capital management, discipline, and consistency in your trading edge."
A positive risk-to-reward ratio, paired with a high win rate, is the backbone of any solid trading plan 📈🔐
⚠️ Losses?
They’re part of the mathematical game of trading 🎲
They don’t define you — they’re necessary, they happen, and we move forward 📊➡️
🙏 I appreciate you taking the time to review my Daily Forecast.
Stay sharp, stay consistent, and protect your capital
— FRNGT 🚀
FX:GBPUSD

Has the BoE Already Doomed the Sterling?Macroeconomics: Diverging Central Bank Paths
The British Pound (GBP) has aggressively declined, losing 4.8% from September highs, primarily due to a growing policy divergence between the Bank of England (BoE) and the US Federal Reserve (Fed). Markets increasingly expect the BoE to cut interest rates sooner, with current pricing suggesting a 35% chance of a 25-basis-point cut. This dovish pressure stems from cooling UK labor data and inflation, which, despite ticking up slightly, remains far from 2023’s double-digit peaks.
In stark contrast, the US Dollar (USD) remains resilient, supported by the Fed’s persistent "higher for longer" stance. Strong US data, notably the 195,000 October Non-Farm Payrolls addition, bolsters this hawkish view. This widening interest rate differential, now almost 100 basis points favoring the USD, makes dollar assets more attractive than sterling assets, directly pressuring the GBP/USD pair toward the critical 1.3000 support level.
Economics and Fiscal Warning: Tax Hikes Loom
Domestic UK economic concerns amplify the bearish pressure on Sterling. UK Chancellor Rachel Reeves issued a pre-Budget warning, confirming an intent to raise taxes to close a significant £22 billion fiscal gap. This public rhetoric prepares markets for an Autumn Budget featuring fiscal tightening measures.
Fiscal tightening through tax hikes generally dampens economic growth expectations, which encourages the BoE to consider rate cuts to stimulate activity. This political and economic dynamic fuels bond market volatility. The UK 10-year gilt yield briefly fell, reflecting investor expectation of slower growth and a dovish BoE response, accelerating the GBP/USD selloff.
Geopolitics and Geostrategy: Dollar's Global Anchor
The Dollar's strength is not purely macroeconomic; it acts as a global safe-haven anchor, a key geostrategic function. Renewed focus on geopolitical stability and trade deals, such as the preliminary US-China trade consensus on export controls and fentanyl, often benefits the US Dollar as the primary reserve currency.
Conversely, the UK faces fiscal uncertainty and lower productivity forecasts, placing its currency at a relative disadvantage. The USD's dominance, reinforced by Chair Jerome Powell's measured, firm rhetoric, creates a sharp contrast with the BoE’s internal divisions on policy. This global context makes the USD the preferred currency, undermining Sterling's value on the international stage.
Technology and Cyber Risk: Underlying Competitiveness
While the movement is not driven by immediate technical news, the UK's long-term technological and patent competitiveness affects its currency's appeal. Persistent issues, like lower productivity forecasts reported by the Office for Budget Responsibility, imply a lag in high-tech innovation and efficiency compared to the US.
A slower pace of innovation and lower productivity in the UK's services and manufacturing sectors contrasts with the robust, job-creating US economy. This fundamental economic weakness limits Sterling's potential for sustained, long-term appreciation. Technical analysis confirms this bearish trend, showing a double-top pattern and momentum indicators deep in negative territory, confirming the downward bias toward the 1.3000 psychological barrier.

Cable Pressure Builds — A Strong Drop May Be Imminent!🎭 CABLE HEIST: The Great British Pound Robbery! 💷🔫
📊 Market Intel: GBP/USD Swing/Day Trade Setup
🎯 THE MASTER PLAN
Asset: GBP/USD (CABLE) - Forex Market
Trade Type: Swing/Day Trade
Bias: 🐻 Bearish Confirmation
Strategy: "The Thief" - Multi-Layer Entry System
📉 TECHNICAL BREAKDOWN
The triangular moving average retest has confirmed our bearish scenario! Price action is showing weakness at key resistance zones, making this an opportune moment to execute our calculated heist.
Key Technical Signals:
Triangular Moving Average rejection ✅
Bearish momentum building 📉
Resistance zone holding strong 🛑
Multiple timeframe alignment 🎯
💰 THE HEIST EXECUTION PLAN
Entry Strategy: "The Thief" Layering Method
Instead of going all-in at one price (rookie move! 😅), we're using multiple sell limit orders to build our position like a professional vault cracker:
🎯 Sell Limit Layers:
Layer 1: 1.34000
Layer 2: 1.33800
Layer 3: 1.33600
Layer 4: 1.33400
Pro Tip: You can add more layers based on your risk appetite and account size. Scale in, don't dive in! 🏊♂️
🛡️ RISK MANAGEMENT
Stop Loss: 1.34400 (Thief's Emergency Exit 🚨)
⚠️ IMPORTANT NOTE:
This is MY stop loss based on my risk tolerance. You're the boss of your own money! Set your SL according to YOUR risk management rules and account size. Trade at your own risk, OG's! 💪
🎯 PROFIT TARGET
Take Profit: 1.32000 (The Escape Route! 🏃♂️💨)
Why this target?
Strong historical support zone (Police barricade! 🚧)
Oversold conditions likely at this level
High probability trap zone for bulls 🐻
Risk/Reward ratio is chef's kiss 👌
⚠️ ANOTHER IMPORTANT NOTE:
This is MY target. You make your money, you take your money! Don't be greedy - secure profits at levels YOU'RE comfortable with. It's YOUR choice, YOUR risk! 💼
🔗 CORRELATED PAIRS TO WATCH
Keep your eyes on these partners in crime:
📊 Related Pairs:
FX:EURUSD - If DXY strengthens, both Cable and Euro take hits together
TVC:DXY (US Dollar Index) - The puppet master! Rising DXY = Falling GBP/USD
OANDA:GBPJPY - Confirms GBP weakness across the board
OANDA:EURGBP - Shows relative strength between European currencies
Correlation Explanation:
When the Dollar flexes 💪, Cable typically folds 📉. Watch DXY for confirmation - if it's pumping, our bearish bias gets stronger! EUR/USD often moves in tandem with GBP/USD, so it's like having a surveillance camera on the whole operation! 🎥
🎓 KEY TAKEAWAYS
✅ Multi-layer entry reduces risk and improves average entry price
✅ Clear technical confirmation before execution
✅ Defined risk with stop loss above resistance
✅ Logical target at strong support zone
✅ Correlation analysis supports the directional bias
⚡ FINAL WORDS FROM THE THIEF
Remember, OG's - the market doesn't care about our plans! 😂 Stay disciplined, manage your risk, and don't let emotions drive your decisions. This setup has solid technical backing, but ALWAYS trade what you can afford to lose!
The best traders are patient thieves - they wait for the perfect moment to strike! ⏰💎
✨ If you find value in my analysis, a 👍 and 🚀 boost is much appreciated — it helps me share more setups with the community!
#GBPUSD #CABLE #ForexTrading #SwingTrading #DayTrading #TechnicalAnalysis #ForexSignals #PriceAction #RiskManagement #TradingStrategy #ForexSetup #BearishSetup #LayeringStrategy #ForexCommunity #TradingView #ForexIdeas #MarketAnalysis #ThiefStyle #ForexHeist

SELL GBPUSD - great profitable trade opportunityGBPUSD has been in a clear downtrend in the last few weeks and is very likely to keep heading to the downside. GBPUSD has recently broken a very powerful support level and then retraced back towards it, the price also struggled to break through resistance and only managed to break through support levels. The price is likely to keep dropping and drop all the way to the next support level (shown as the take profit level on the chart) - SELL!!

GBP/USD Under Pressure Ahead of BoE Meeting 🇬🇧The British pound ( FOREXCOM:GBPUSD ) is currently under pressure and is expected to experience high volatility ahead of the Bank of England (BoE) policy announcement on Thursday. Market expectations are divided regarding the possibility of an interest rate cut.
Key Pivot Level: 1.3161
The FOREXCOM:GBPUSD pair remains bearish (tending to fall) as long as the price is below the 1.3161 pivot level. Selling pressure is likely to persist until the BoE provides clarity on its policy direction.
🎯Bearish Scenario
If GBP/USD remains below 1.3161, the downtrend will continue with the following targets:
- Bearish Target 1: 1.3050
- Bearish Target 2: 1.3000 (Key psychological level)
- Bearish Target 3: 1.2922
🎯 Bullish Scenario
If GBP/USD successfully breaks through and maintains above 1.3162, a bullish recovery will begin with the following targets:
- Bullish Target 1: 1.3230
- Bullish Target 2: 1.3330 (Next major hurdle)
Stop Loss: Set the stop-loss (SL) 50-80 pips from the entry level.

SELL GBPUSD - Major support brokenGBPUSD has been heading in a clear downtrend for a while and has no signs of being bullish for a while! GBPUSD broke major support levels and also broke the powerful channel that it was stuck in between. There is nowhere left for GBPUSD to go except the next major support level (white line drawn) - SELL!

GBPUSD(20251103)Today's AnalysisMarket News:
Starting November 2nd, North America will begin observing winter time. Trading hours for financial markets in the US and Canada (gold, silver, crude oil, US stocks, etc.) and the release times of economic data will be delayed by one hour compared to summer time.
Technical Analysis:
Today's Buy/Sell Threshold:
1.3136
Support and Resistance Levels:
1.3202
1.3178
1.3161
1.3110
1.3094
1.3069
Trading Strategy:
If the price breaks above 1.3136, consider buying, with a first target price of 1.3161.
If the price breaks below 1.3110, consider selling, with a first target price of 1.3094.

Is the Cable Preparing for a Deeper Slide? GBP/USD Outlook🎯 GBP/USD "THE CABLE" - Cash Flow Heist Setup 🏴☠️💰
📊 Market Overview
The Cable is showing bearish momentum as we approach key resistance zones. This swing/day trade setup focuses on capturing downside movement with strategic risk management.
🔍 Trade Setup Details
Direction: 🐻 BEARISH
Entry Zone: FLEXIBLE - Multiple entry opportunities available at current price levels
Stop Loss: 🛡️ 1.35000 (Invalidation level - protect your capital!)
Target: 🎯 1.33300 (Strong support zone + oversold conditions)
📈 Technical Analysis
Key Observations:
Resistance Overhead: Price facing rejection at upper levels
Support Target: 1.33300 confluence zone with multiple factors:
Historical strong support
Oversold territory expected
Potential trap zone for late shorts
⚠️ Risk Management Note:
Fellow traders, these levels are MY analysis points. Your risk tolerance = Your rules. Adjust SL/TP based on YOUR account size and strategy. Lock profits along the way - don't get greedy! 💼
🌐 Related Pairs to Watch
Keep an eye on these correlated instruments:
EUR/USD - Euro strength/weakness impacts Cable
DXY (US Dollar Index) - Inverse correlation with GBP/USD
GBP/JPY - Confirms GBP momentum
EUR/GBP - Shows relative strength between pairs
💵 USD Pairs Correlation:
OANDA:AUDUSD - Risk sentiment gauge
OANDA:NZDUSD - Commodity currency correlation
FX:USDJPY - Safe haven flows indicator
Key Point: If DXY strengthens, expect additional downside pressure on Cable. Monitor EUR/USD for confirmation of USD strength vs. weakness in GBP specifically.
🎓 Strategy Notes
This is a "cash flow management" approach - meaning we're looking to capture liquidity moves and bank profits systematically. The setup combines:
✅ Technical levels
✅ Market structure
✅ Risk-reward optimization
✅ Exit strategy before reversal zones
Pro Tip: Consider scaling out at 1.33500 to secure partial profits before the final target!
✨ If you find value in my analysis, a 👍 and 🚀 boost is much appreciated — it helps me share more setups with the community!
#GBPUSD #TheCable #ForexTrading #SwingTrading #DayTrading #TechnicalAnalysis #ForexSignals #CashFlow #BearishSetup #PriceAction #SupportAndResistance #RiskManagement #ForexStrategy #DXY #CurrencyTrading #TradingIdeas #ForexCommunity #MarketAnalysis

GBPUSD FRGNT Weekly Forecast - Q4 | W45 | Y25 |📅 Q4 | W45 | Y25 |
📊 GBPUSD FRGNT Weekly Forecast
🔍 Analysis Approach:
I’m applying Smart Money Concepts, focusing on:
Identifying Points of Interest on the Higher Time Frames (HTFs) 🕰️
Using those POIs to define a clear trading range 📐
Refining those zones on Lower Time Frames (LTFs) 🔎
Waiting for a Break of Structure (BoS) for confirmation ✅
This method allows me to stay precise, disciplined, and aligned with the market narrative, rather than chasing price.
💡 My Motto:
"Capital management, discipline, and consistency in your trading edge."
A positive risk-to-reward ratio, paired with a high win rate, is the backbone of any solid trading plan 📈🔐
⚠️ Losses?
They’re part of the mathematical game of trading 🎲
They don’t define you — they’re necessary, they happen, and we move forward 📊➡️
🙏 I appreciate you taking the time to review my Daily Forecast.
Stay sharp, stay consistent, and protect your capital
— FRNGT 🚀
FX:GBPUSD

GBP/USD Long from current price.GU Weekly Outlook
After a steady bearish run last week, GU has now entered a strong discounted demand zone that previously caused a break of structure to the upside. Price has already shown signs of Wyckoff accumulation and is now pushing toward the nearest supply zones.
I’ve marked two potential supply areas close by, but I suspect the first (8hr) supply may be violated as the premium one above looks stronger. My plan is to look for short-term buys up to that supply, then prepare for potential sell setups to continue the overall bearish trend.
Confluences:
- GU has been bearish, breaking structure to the downside
- Two nearby supply zones above current price
- Price currently in a strong demand zone, likely to cause a short-term correction
- Liquidity resting below waiting to be taken
- DXY showing bullish movement, aligning with this outlook
P.S. I wouldn’t be surprised if GU rallies from this demand zone toward the premium level around 1.32000 before continuing its downward move.

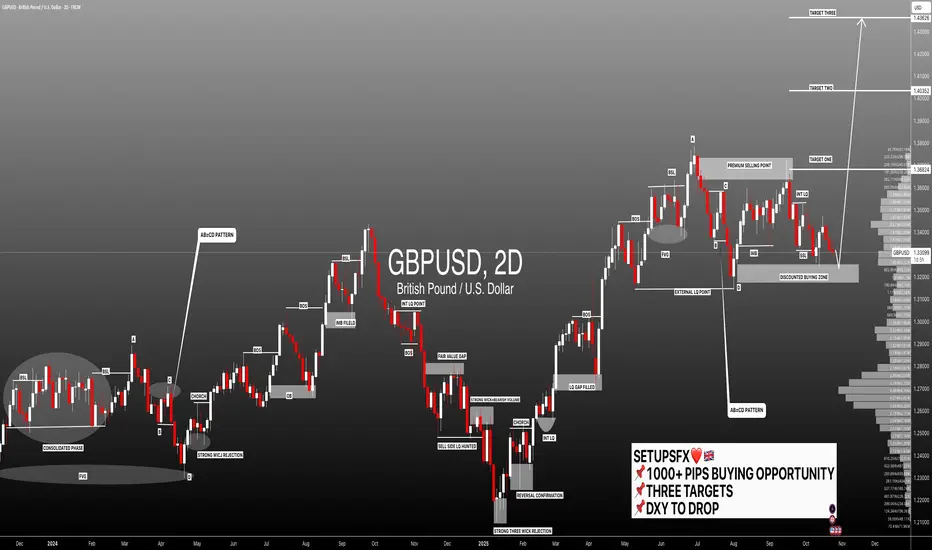
#GBPUSD:+1000 Pips Highly Probable Target! Agree with the idea? GBPUSD is currently trading at a highly probable point where we may see a strong bullish volume emerge in the market. This key level is only valid if the US dollar declines further, as a weak dollar will push our prices towards our target zones, helping us gain a higher risk-to-reward trade setup. Please like and comment on the ideas, even if you disagree. Sharing thoughts will help us all.
There are three major targets, and they accumulate to a +1000 pips trade setup. Set your take profit and stop loss based on your own analysis.
Team Setupsfx_
GBPUSD is ready to drop further.. time to sell!GBPUSD has been stuck inside a triangle patterned channel and struggled to break through from the upside and downside, however, it finally broke down below a major support zone which now highly indicates that the price will keep pushing down even further all the way down to the next major support zone (shown as the take profit level) .. This is a great time to sell!
